

Admin Portal
The Admin Portal is a collection of dashboards available in the included information_schema database in Heavy Immerse. The dashboards display point-in-time information of the HEAVY.AI platform resources and users of the system.
Access to system dashboards is controlled using Immerse privileges; only users with Admin privileges or users/roles with access to the information_schema database can access the system dashboards.
The information_schema database and Admin Portal dashboards and system tables are installed when you install or upgrade to HEAVY.AI 6.0. For more detailed information on the tables available in the Admin Portal, see System Tables.
With the Admin Portal, you can see:
- Database monitoring and database and web server logs.
- Real-time data reporting for the system.
- Point-in-time resource metrics and user engagement dashboards.
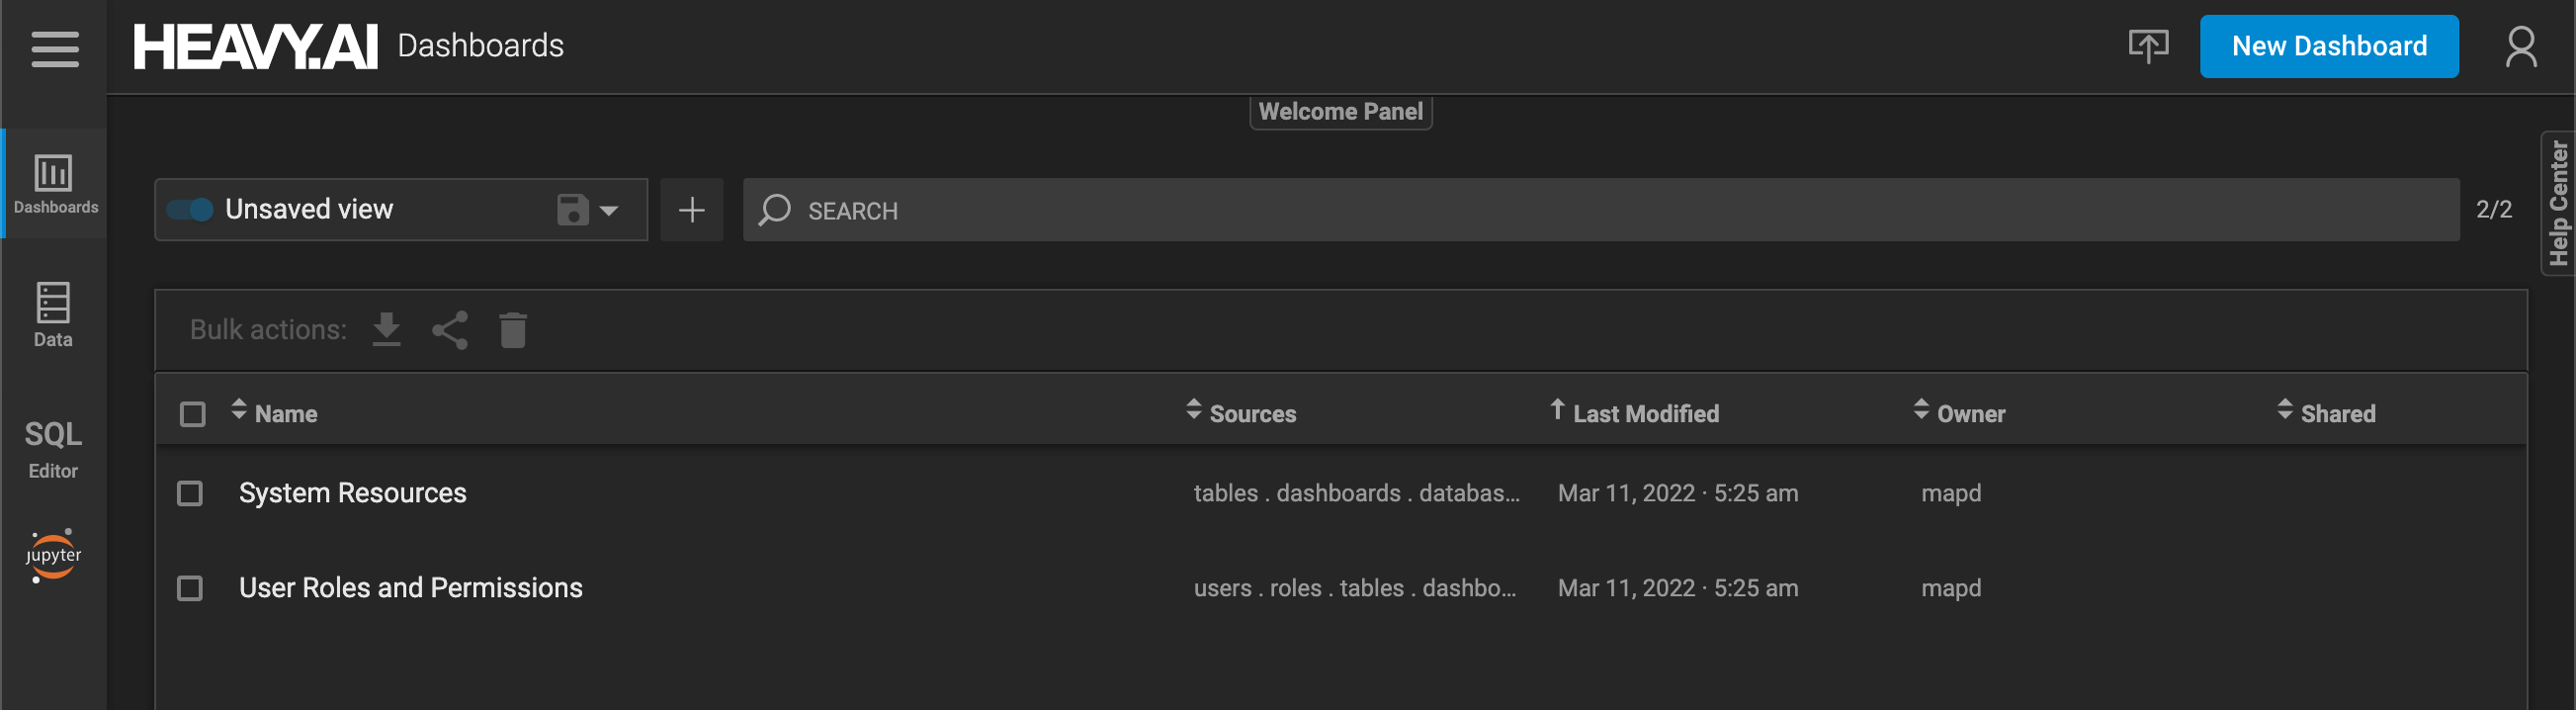
When you log in to the information_schema database, you see the Request Logs and Monitoring, System Resources, and User Roles and Permissions dashboards.
Request Logs and Monitoring
By default, the Request Logs and Monitoring dashboard does not appear in the Admin portal. To turn on the dashboard, set the enable-logs-system-tables parameter to TRUE in heavy.conf and restart the database.
The Request Logs and Monitoring dashboard includes the following charts on three tabs:
Database Monitoring
Database Logs
Web Server Logs
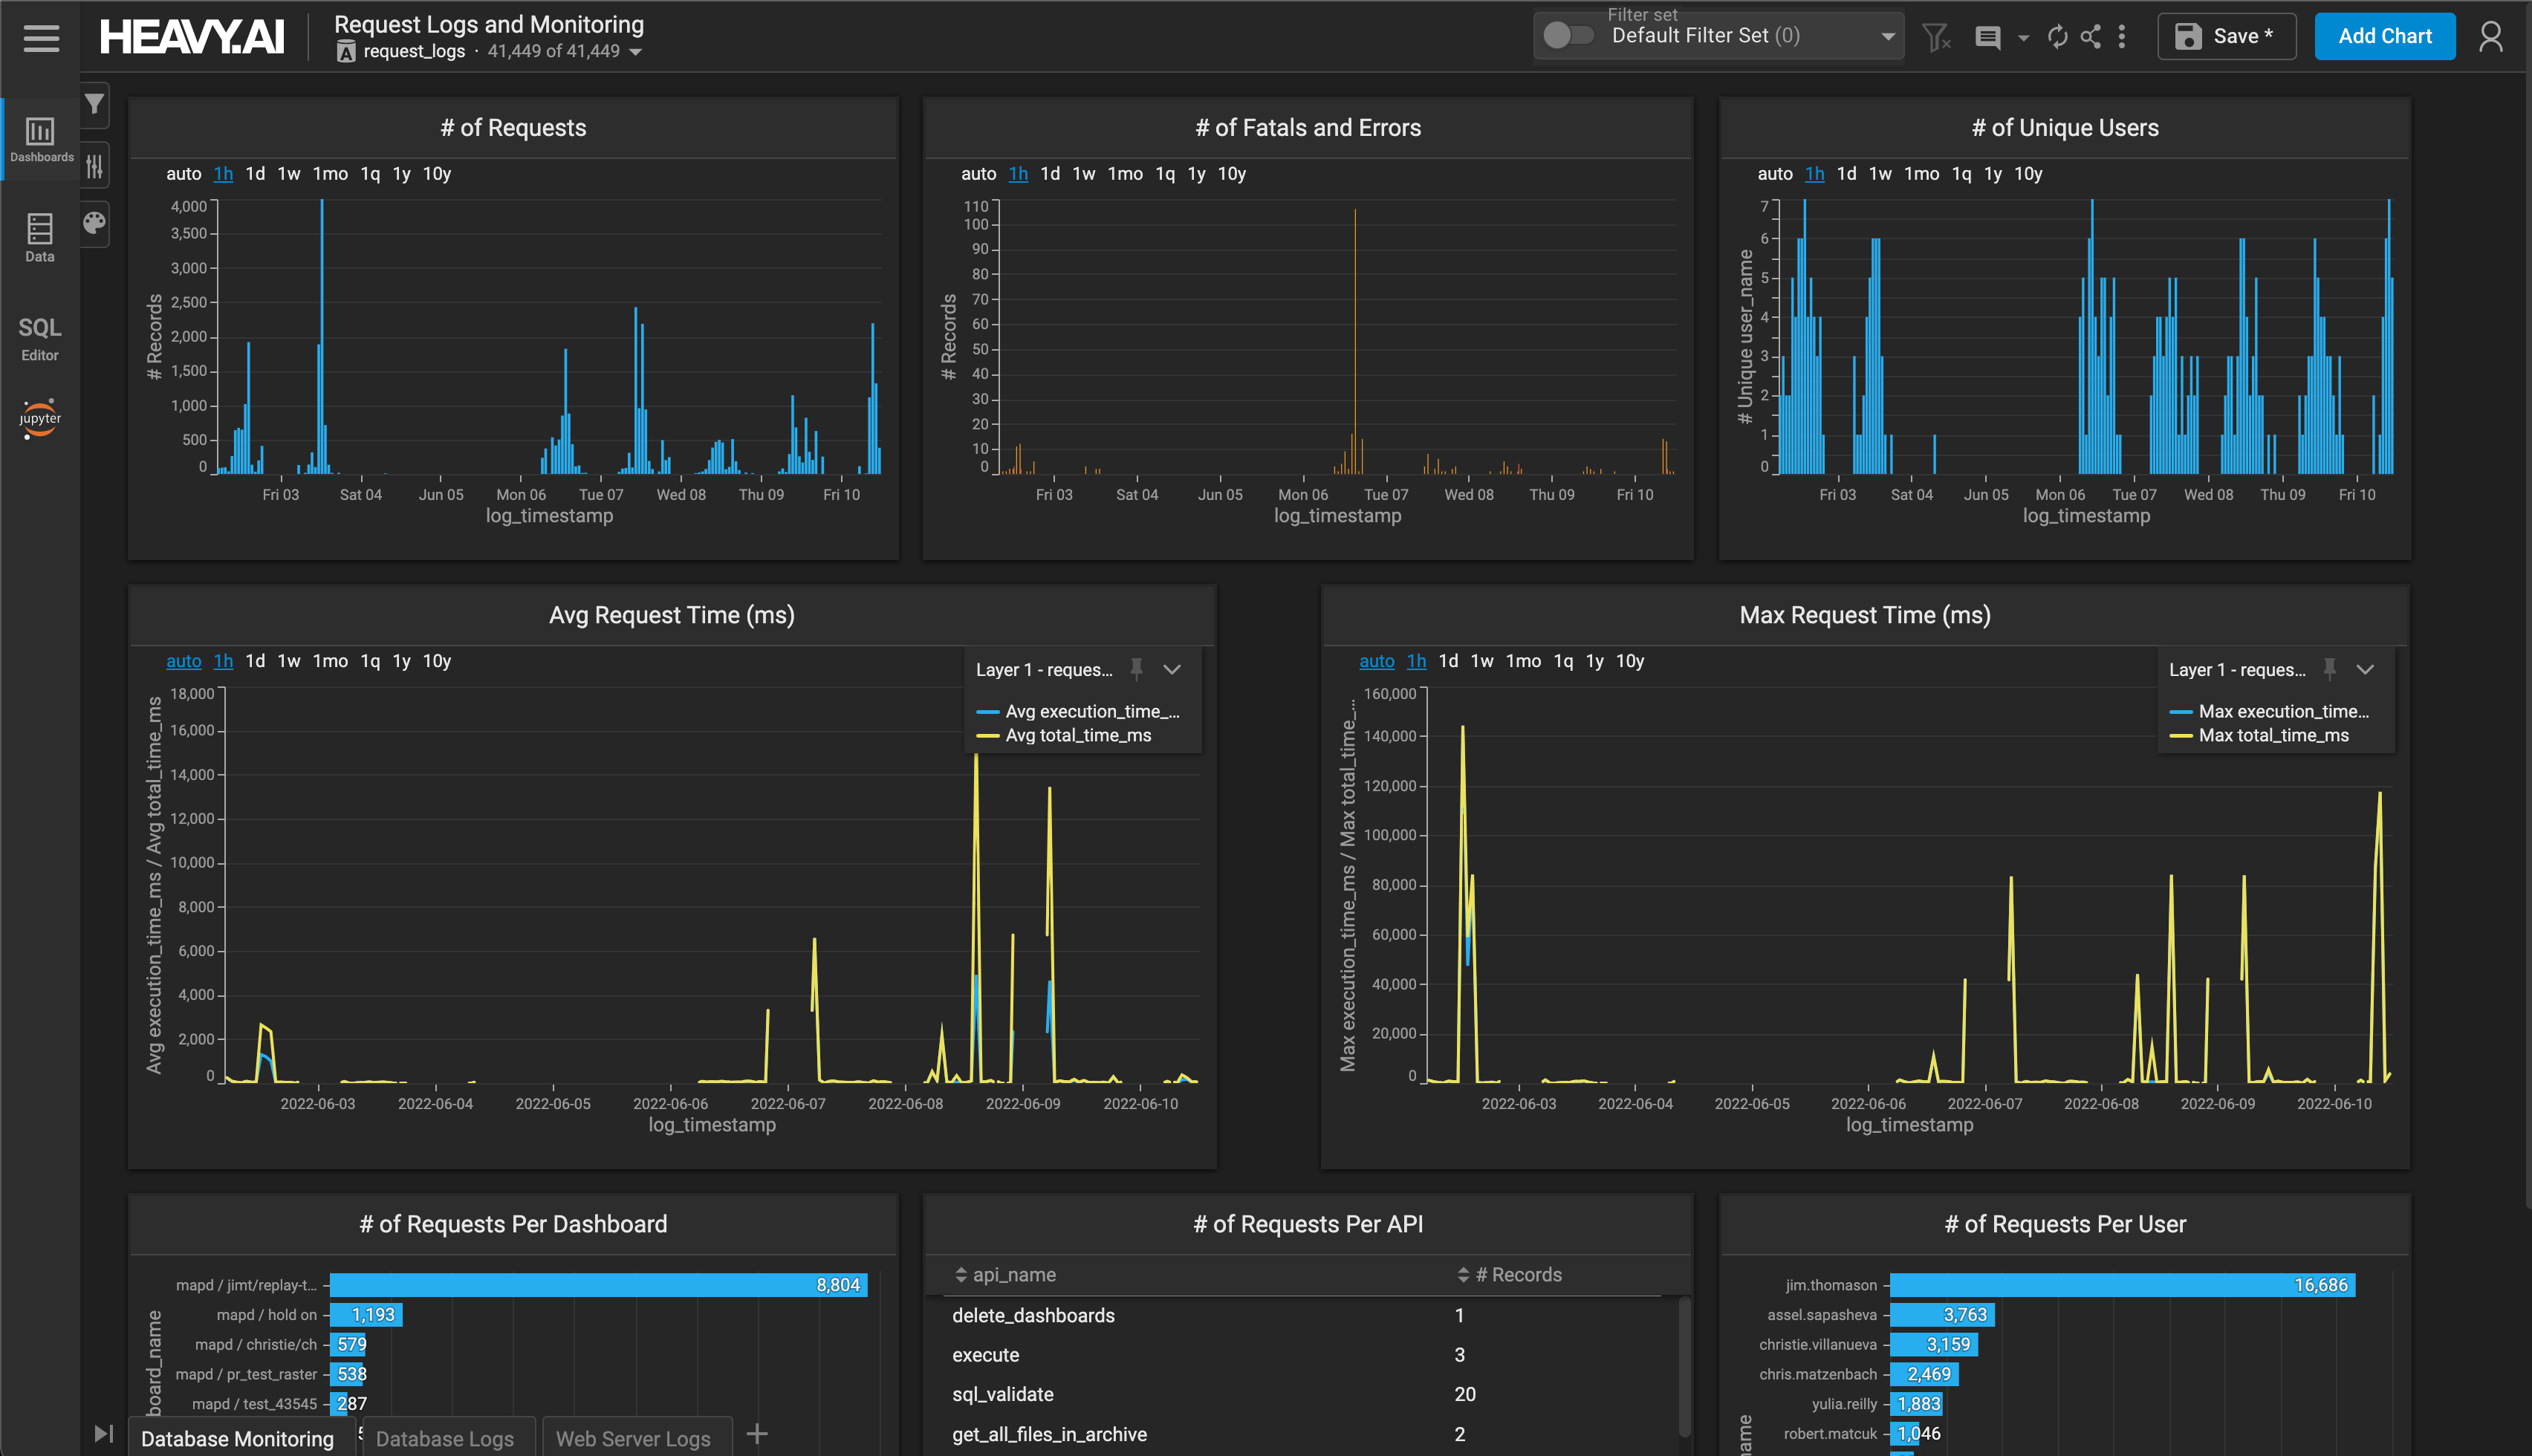
- Number of Requests
- Number of Fatals and Errors
- Number of Unique Users
- Avg Request Time (ms)
- Max Request Time (ms)
- Number of Requests per Dashboard
- Number of Requests per API
- Number of Requests per User
System Resources Dashboard
The System Resources dashboard includes the following charts on three tabs:
Database Catalog tab
Memory Utilization tab
Storage Utilization tab
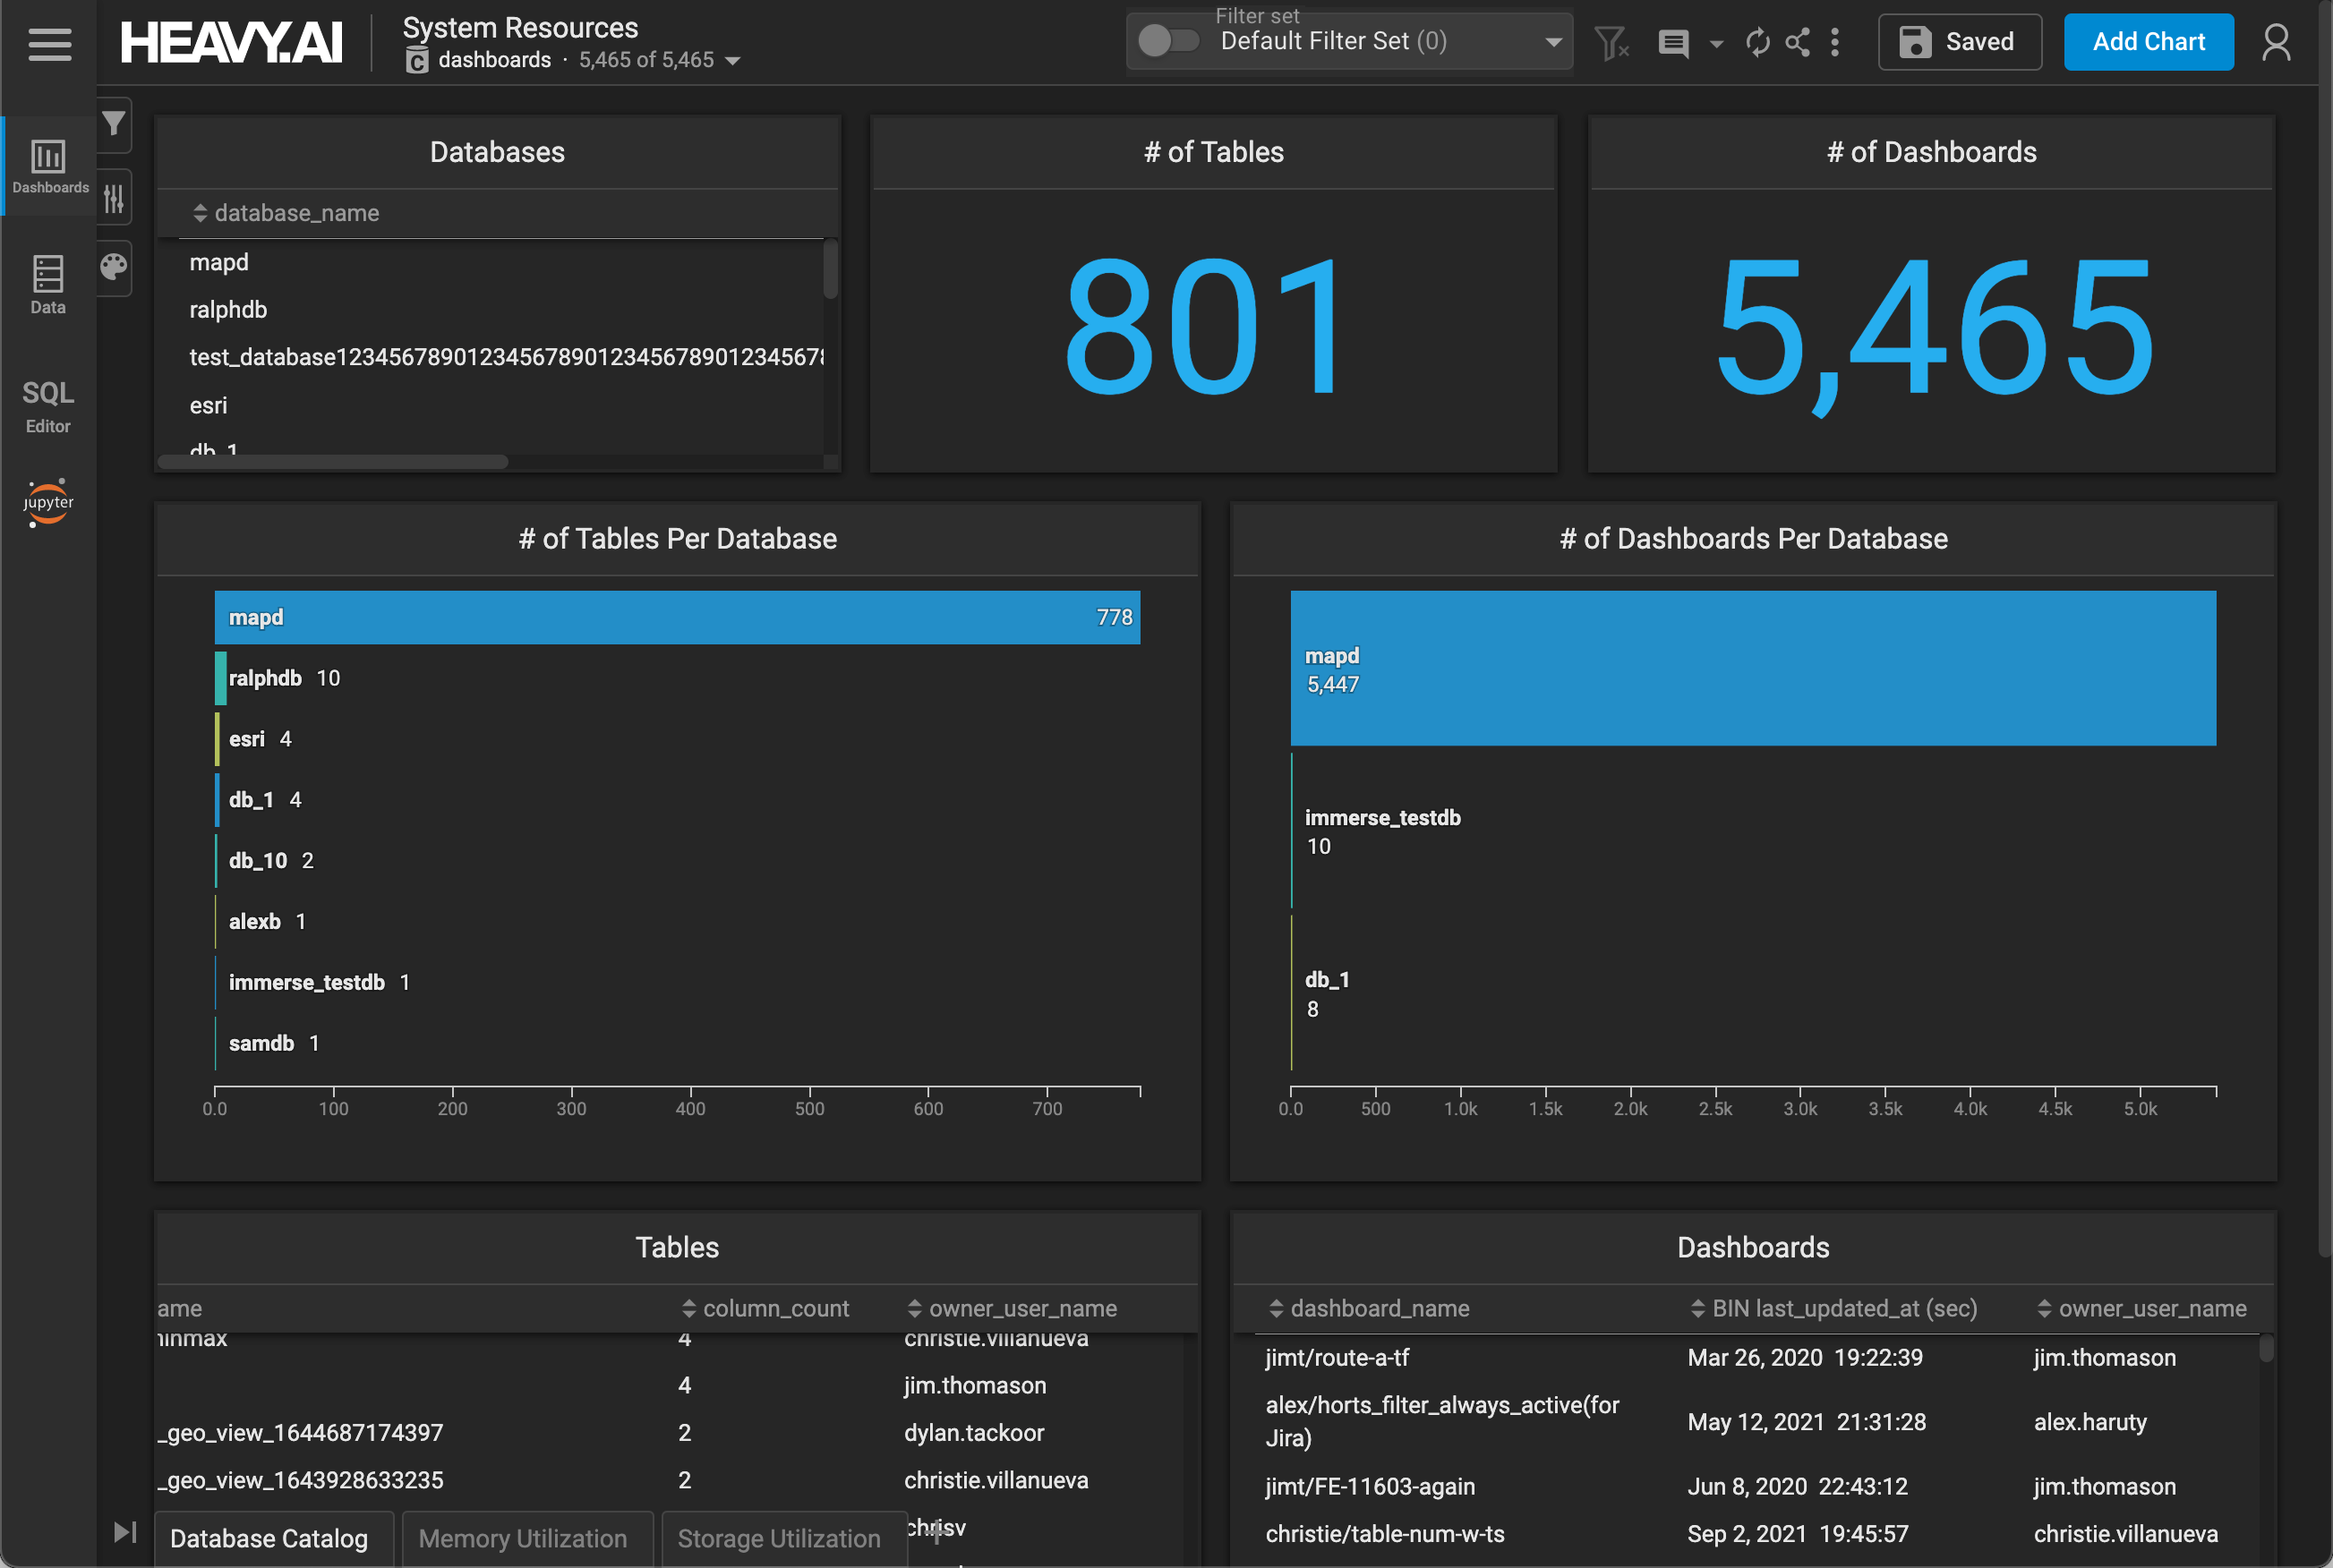
- Databases - Names of all available databases
- # of Tables - Total number of tables
- # of Dashboards - Total number of dashboards
- # of Tables Per Database
- # of Dashboards Per Database
- Tables - Sortable name, column count, and owner information for all tables.
- Dashboards - Sortable name, last update time, and owner information for all databases.
User Roles and Permissions Dashboard
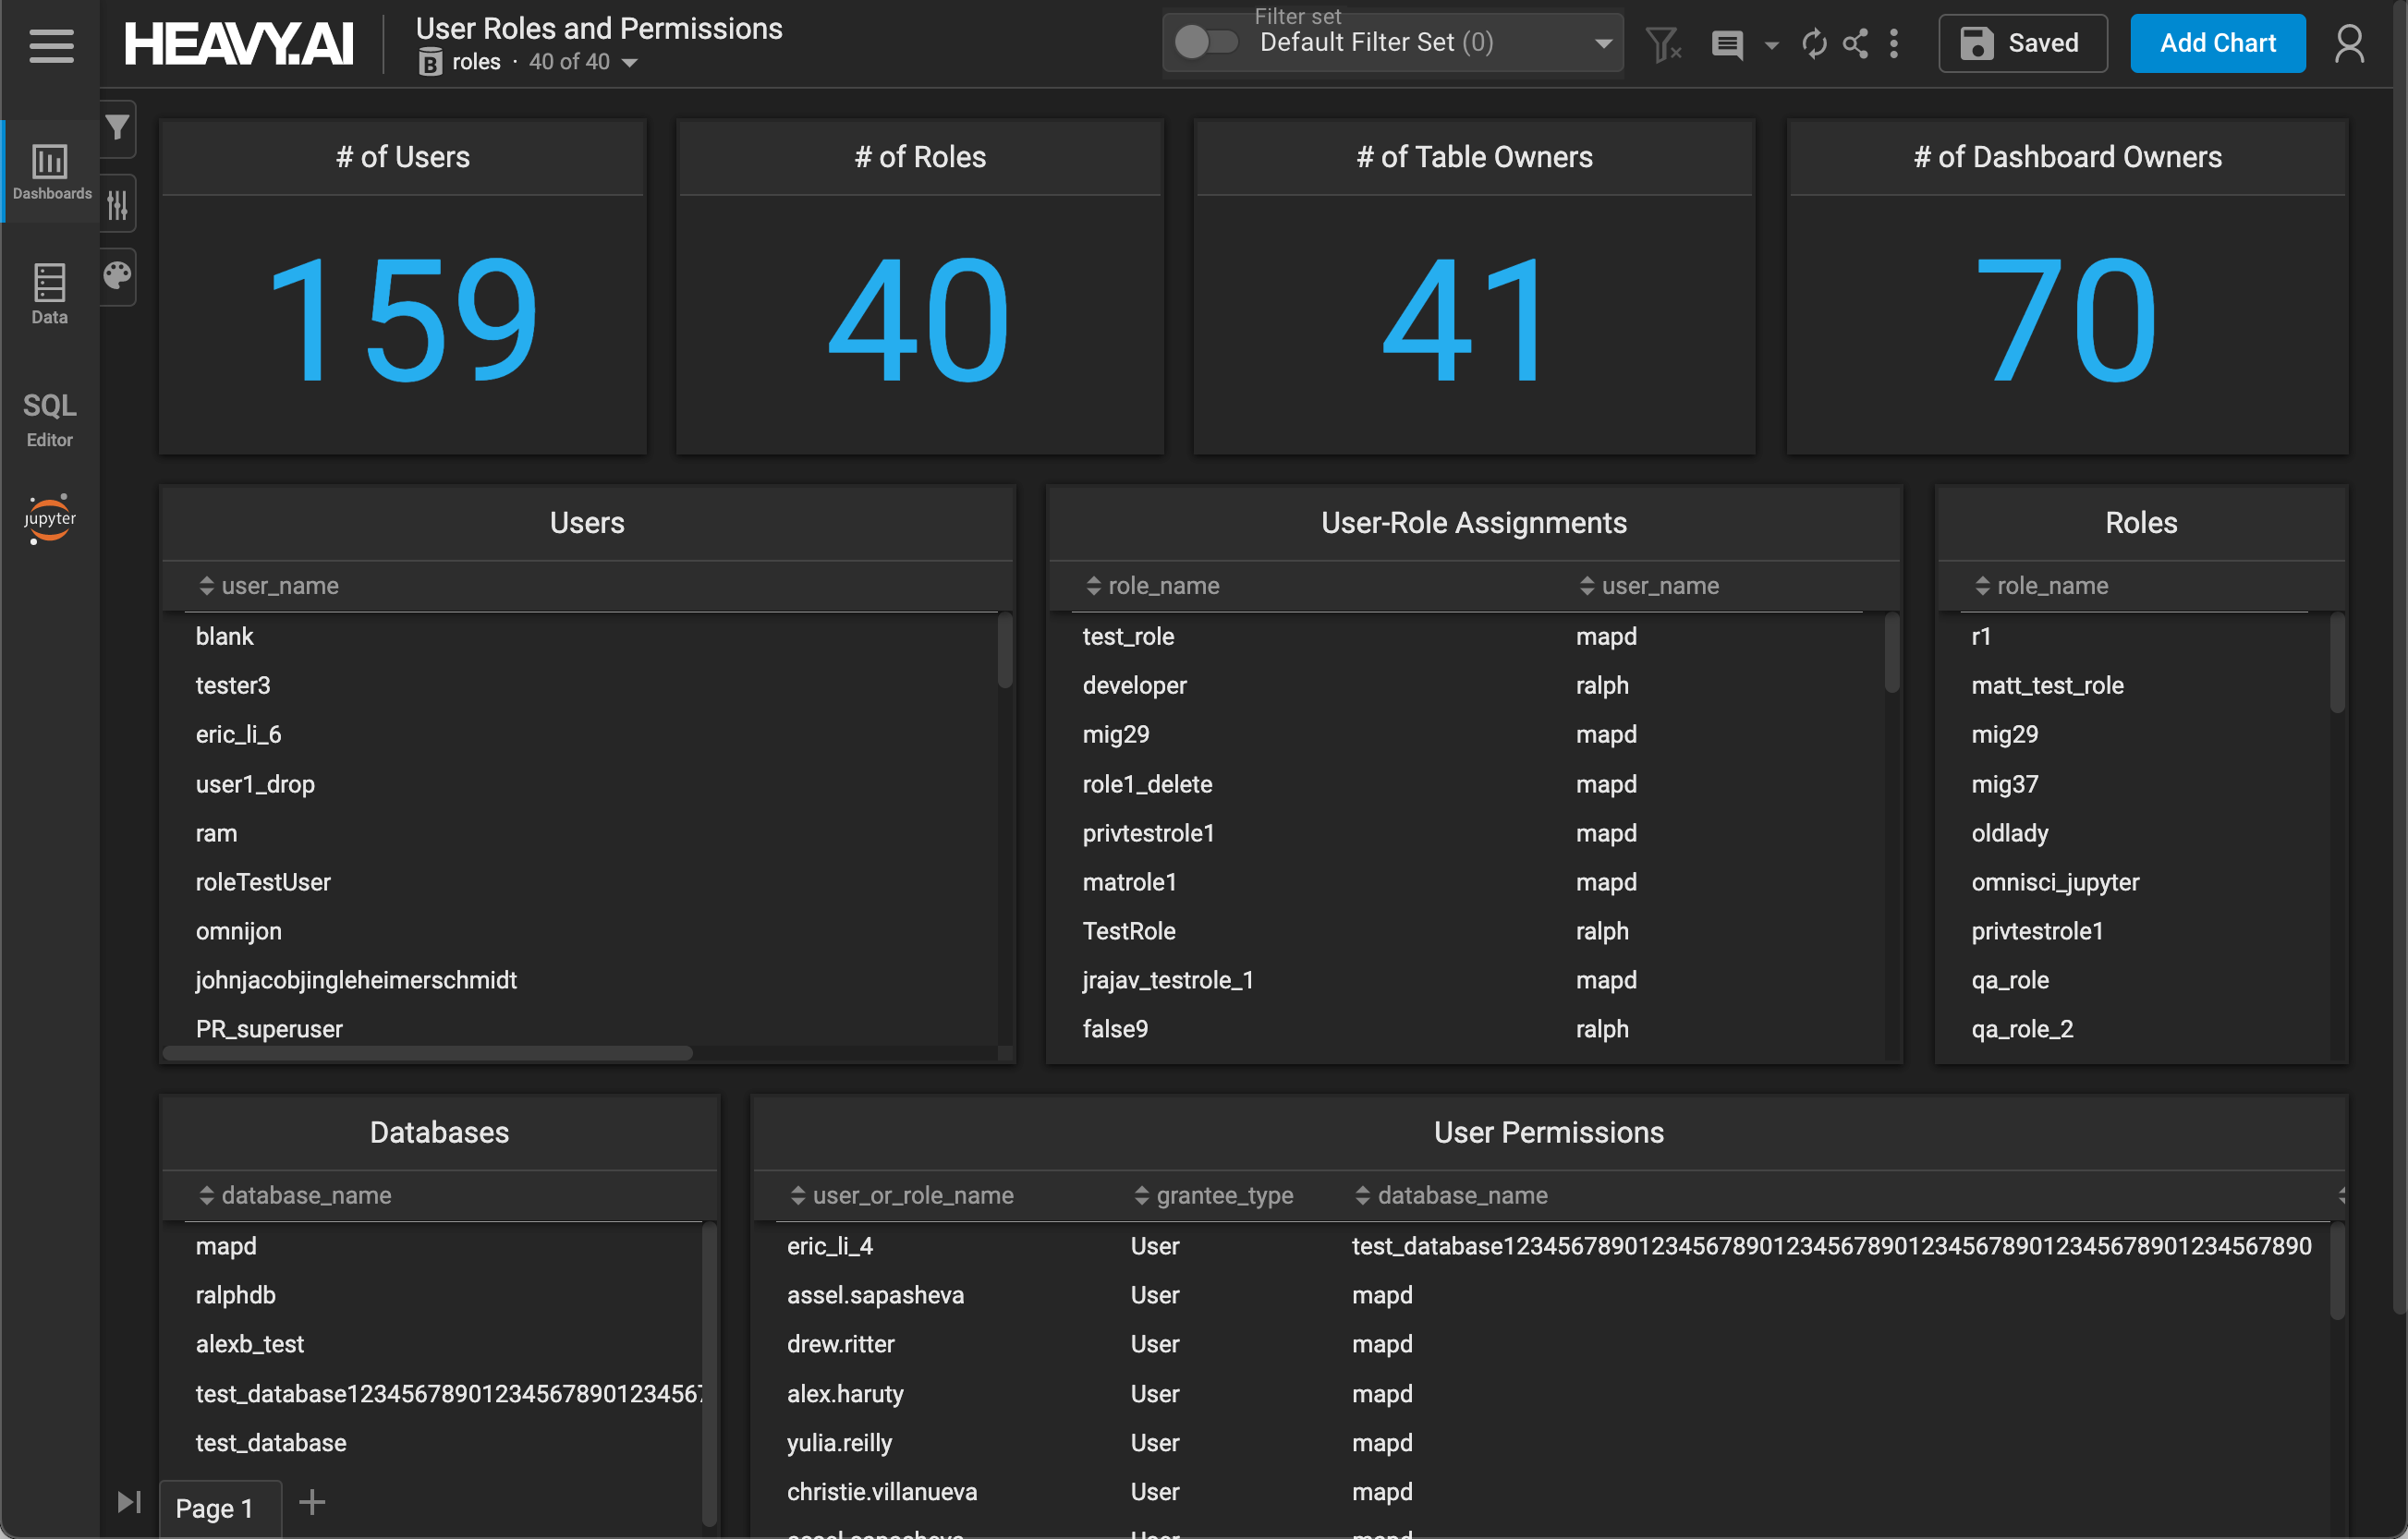
The User Roles and Permission Dashboard includes the following charts:
- # of Users - Total number of users on the system
- # of Roles - Total number of roles on the system
- # of Table Owners - Total number of table owners on the system
- # of Dashboard Owners - Total number of dashboard owners on the system
- Users - Sortable list of users on the system
- User-Role Assignments - Mapping of role names to user names, sortable by role or user
- Roles - Sortable list of roles on the system
- Databases - Sortable list of databases on the system
- User Permissions - Mapping of user or role name, permission type, and database, sortable by any column.