Observability Stack Configuration#
The BCM cm-kubernetes-setup wizard deploys all the foundational components for observability, by default enabling observability within the K8s space. However, additional configuration is needed to enable time-series and logging data sources from BCM.
Configure storage and retention for Prometheus#
Create a new YAML file on the head node for this setup:
cat << EOF > prom_config.yaml
prometheus:
  prometheusSpec:
    retention: 90d
    storageSpec:
      volumeClaimTemplate:
        spec:
          accessModes: ["ReadWriteOnce"]
          resources:
            requests:
              storage: 300Gi
  persistence:
    enabled: true
    storageClassName: local-path
    type: pvc
    enabled: true
EOF
With the configuration file in place, apply these values to the K8s cluster:
helm upgrade kube-prometheus-stack prometheus-community/kube-prometheus-stack -n prometheus -f prom_config.yaml --reuse-values
Configure storage and retention for Loki#
This will require a redeployment of the Helm chart for Loki as we need to set a new storage value and we can’t resize this live.
Create a new YAML file on the head node for this setup:
cat << EOF > loki_config.yaml
backend:
  replicas: 3
chunksCache:
  writebackSizeLimit: 500MB
commonConfig:
  replication_factor: 3
compactor:
  replicas: 0
deploymentMode: SimpleScalable
distributor:
  maxUnavailable: 0
  replicas: 0
indexGateway:
  maxUnavailable: 0
  replicas: 0
ingester:
  replicas: 0
loki:
  limits_config:
    ingestion_rate_mb: 75
    ingestion_burst_size_mb: 150
    per_stream_rate_limit: 16MB
    per_stream_rate_limit_burst: 64MB
    retention_period: 90d
  auth_enabled: false
  commonConfig:
    replication_factor: 3
  schemaConfig:
    configs:
    - from: '2025-09-04'
      index:
        period: 24h
        prefix: loki_index_
      object_store: s3
      schema: v13
      store: tsdb
  storage:
    type: s3
minio:
  enabled: true
  persistence:
    size: 500Gi
querier:
  maxUnavailable: 0
  replicas: 0
queryFrontend:
  maxUnavailable: 0
  replicas: 0
queryScheduler:
  replicas: 0
read:
  replicas: 3
singleBinary:
  replicas: 0
write:
  replicas: 3
EOF
Uninstall the existing Helm chart:
helm uninstall loki -n lokiDelete any lingering PVCs:
kubectl delete pvc --all -n lokiInstall the Helm chart for Loki, using the new values:
helm install loki grafana/loki -n loki -f loki_config.yaml
Enable Prometheus scrape endpoint in BCM#
On the head node (both head nodes, if configured for HA) using
sedto inline edit the configuraiton:sed -i 's/# EnablePrometheusExporterService = true/EnablePrometheusExporterService = true/g' /cm/local/apps/cmd/etc/cmd.confDisable certificate-based authentication for the scrape endpoint, and enable extra information to be added to the metrics:
cm-manipulate-advanced-config.py PrometheusExporterExtraInfo=1 PrometheusExporterInfo=1 PrometheusExporterEnum=0 PrometheusExporterRequireCertificate=0 PrometheusLabelIncludeSerialNumber=1 PrometheusLabelIncludePartNumber=1 PrometheusLabelIncludeSystemName=1 MaxMeasurablesPerProducer=1600If you have integrated your BMS with BCM, then you will additionally need a config like so:
cm-manipulate-advanced-config.py PushMonitoringDeviceStatusMetrics=CDUStatus,CDULiquidSystemPressure,CDULiquidReturnTemperatureRestart the cmd service:
systemctl restart cmdAfter cmd restarts, run the following to validate that metrics is being successfully exported through curl:
curl -sk https://localhost:8081/exporter | tail -n 2The exporter could take some time to start from restart of cmd:
writetime_total{base_type="Device",category="default",hostname="node001",type="PhysicalNode",parameter="vda"} 0
writetime_total{base_type="Device",category="default",hostname="node001",type="PhysicalNode",parameter="vdb"} 3882985
Configure Prometheus to scrape metrics from BCM endpoint#
With Prometheus deployed earlier through the BCM K8s wizard, interaction with the Prometheus operator is required to make configuration changes, enabling this data source.
Prepare the configuration files#
K8s typically uses YAML files with custom values to make configuration changes. Create three of these YAML files on the head node for this setup.
bcm_prom_endpoint.yaml:
cat << EOF > /tmp/bcm_prom_endpoint.yaml
apiVersion: v1
kind: Endpoints
metadata:
  name: external-bcmexporter
  namespace: prometheus
  labels:
    app: external-bcmexporter
subsets:
  - addresses:
$(cmsh -c 'device; list -f ip:0 -t headnode' | xargs -I{} echo "    - ip: {}")
    ports:
    - name: metrics
      port: 8081
EOF
bcm_prom_svc.yaml:
cat << EOF > /tmp/bcm_prom_svc.yaml
apiVersion: v1
kind: Service
metadata:
  name: external-bcmexporter
  namespace: prometheus
  labels:
    app: external-bcmexporter
spec:
  clusterIP: None
  ports:
  - name: metrics
    port: 8081
    targetPort: 8081
EOF
bcm_prom_svcmon.yaml:
cat << EOF > /tmp/bcm_prom_svcmon.yaml
apiVersion: monitoring.coreos.com/v1
kind: ServiceMonitor
metadata:
  name: external-bcmexporter
  namespace: prometheus
  labels:
    release: kube-prometheus-stack
spec:
  endpoints:
  - port: metrics
    interval: 30s
    path: /exporter
    scheme: https
    tlsConfig:
      insecureSkipVerify: true
  selector:
    matchLabels:
      app: external-bcmexporter
  namespaceSelector:
    matchNames:
      - prometheus
EOF
With these configuration files in place, apply these values to the K8s cluster:
kubectl apply -f /tmp/bcm_prom_endpoint.yaml
kubectl apply -f /tmp/bcm_prom_svc.yaml
kubectl apply -f /tmp/bcm_prom_svcmon.yaml
Configure Prometheus to scrape metrics from DCGM endpoints#
As with the scraping of metrics from the BCM Prometheus endpoint, we also need to configure the Prometheus instance in K8s to scrape the dcgm-exporter service from each GB200 compute tray.
Prepare the configuration files#
Enable the XID errors count metric on the software image used for DGX nodes:
echo "DCGM_EXP_XID_ERRORS_COUNT, gauge, Count of XID Errors within user-specified time window (see xid-count-window-size param)." >> /cm/images/<image name>/etc/dcgm-exporter/default-counters.csv
Enable the dcgm-exporter service on the software image:
cm-chroot-sw-img /cm/images/<image name> << EOF
  systemctl enable nvidia-dcgm-exporter.service
  exit
EOF
Run an image update, writing the changes to active nodes:
cmsh -c "device; foreach -c dgx-gb200 (imageupdate -w)"
Using PDSH, restart the service.:
pdsh -g category=dgx-gb200 'systemctl restart nvidia-dcgm-exporter.service'
Create three YAML files on the head node for this setup to define the external-dcgmexporter service monitor scraping. These files assume that your GB200 compute trays are in a category named dgx-gb200.
dcgm_prom_endpoint.yaml:
cat << EOF > /tmp/dcgm_prom_endpoint.yaml
apiVersion: v1
kind: Endpoints
metadata:
  name: external-dcgmexporter
  namespace: prometheus
  labels:
    app: external-dcgmexporter
subsets:
  - addresses:
$(cmsh -c 'device; list -c dgx-gb200 -t physicalnode -f ip:0' | xargs -I{} echo "    - ip: {}")
    ports:
    - name: metrics
      port: 9400
EOF
dcgm_prom_svc.yaml:
cat << EOF > /tmp/dcgm_prom_svc.yaml
apiVersion: v1
kind: Service
metadata:
  name: external-dcgmexporter
  namespace: prometheus
  labels:
    app: external-dcgmexporter
spec:
  clusterIP: None
  ports:
  - name: metrics
    port: 9400
    targetPort: 9400
EOF
dcgm_prom_svcmon.yaml:
cat << EOF > /tmp/dcgm_prom_svcmon.yaml
apiVersion: monitoring.coreos.com/v1
kind: ServiceMonitor
metadata:
  name: external-dcgmexporter
  namespace: prometheus
  labels:
    release: kube-prometheus-stack
spec:
  endpoints:
  - port: metrics
    interval: 30s
    path: /metrics
    scheme: http
  selector:
    matchLabels:
      app: external-dcgmexporter
  namespaceSelector:
    matchNames:
      - prometheus
EOF
With these configuration files in place, we can now apply these values to the K8s cluster:
kubectl apply -f /tmp/dcgm_prom_endpoint.yaml
kubectl apply -f /tmp/dcgm_prom_svc.yaml
kubectl apply -f /tmp/dcgm_prom_svcmon.yaml
We can validate that DCGM exporter is working by issuing a curl to the endpoint listening on 9400/tcp:
pdsh -g category=dgx-gb200 'curl -s http://localhost:9400/metrics | grep DCGM | tail -n 1' | dshbak -c
----------------
b06-p1-dgx-06-c06
----------------
DCGM_EXP_XID_ERRORS_COUNT{gpu="3",UUID="GPU-843eece3-8d4c-82e2-0f6d-eddd48380b14",pci_bus_id="00000019:01:00.0",device="nvidia3",modelName="NVIDIA GB200",Hostname="b06-p1-dgx-06-c06",DCGM_FI_DRIVER_VERSION="570.172.08",window_size_in_ms="300000"} 0
----------------
b06-p1-dgx-06-c07
----------------
DCGM_EXP_XID_ERRORS_COUNT{gpu="3",UUID="GPU-2635e627-944b-5810-e599-78747aef0107",pci_bus_id="00000019:01:00.0",device="nvidia3",modelName="NVIDIA GB200",Hostname="b06-p1-dgx-06-c07",DCGM_FI_DRIVER_VERSION="570.172.08",window_size_in_ms="300000"} 0
----------------
b06-p1-dgx-06-c08
----------------
DCGM_EXP_XID_ERRORS_COUNT{gpu="3",UUID="GPU-059a99b0-8f4a-43ee-9e22-e843be6fbf78",pci_bus_id="00000019:01:00.0",device="nvidia3",modelName="NVIDIA GB200",Hostname="b06-p1-dgx-06-c08",DCGM_FI_DRIVER_VERSION="570.172.08",window_size_in_ms="300000"} 0
----------------
b06-p1-dgx-06-c09
----------------
DCGM_EXP_XID_ERRORS_COUNT{gpu="3",UUID="GPU-26d2e46e-ed78-f470-c5a1-09d9f76bb400",pci_bus_id="00000019:01:00.0",device="nvidia3",modelName="NVIDIA GB200",Hostname="b06-p1-dgx-06-c09",DCGM_FI_DRIVER_VERSION="570.172.08",window_size_in_ms="300000"} 0
Grafana and querying BCM metrics#
Grafana should be available on your head node listening on HTTPS on the /grafana sub-domain.
Using a web browser, navigate to
https://<headnode>/grafana.By default, the administrative account is admin with password prom-operator.
Once authenticated, click on Explore on the left.
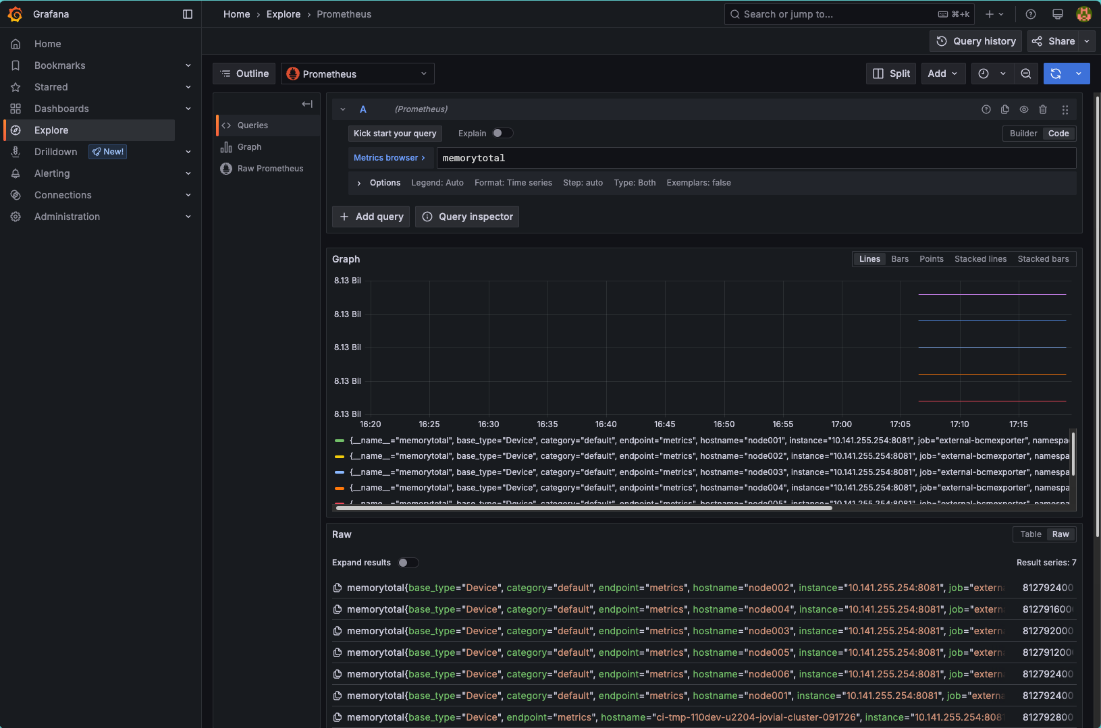
Once in the Explore interface, set the query editor to code and query the metric memorytotal.
BCM provides many metrics out of the box, a list of which can be found in Grafana by using the Metric browser selecting all metrics which include the label job with the value external-bcmexporter.
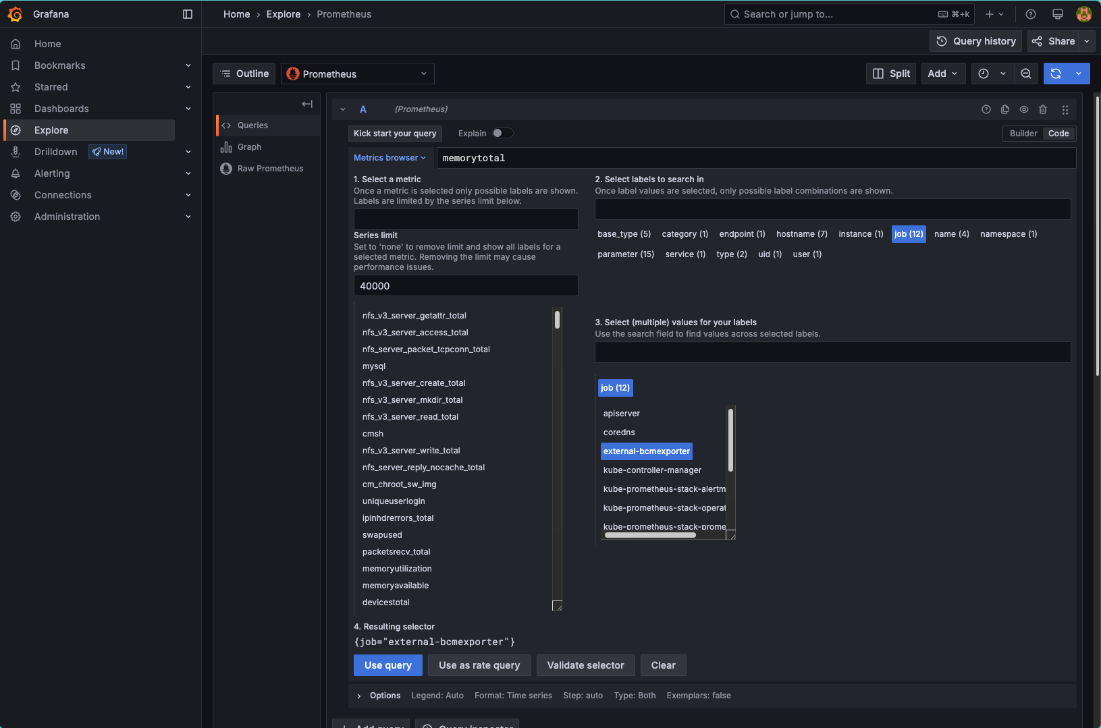
Available metrics from BCM can also be found by inspecting the output of the BCM Prometheus exporter endpoint.
The following CURL command will inspect the output of the BCM Prometheus exporter endpoint:
curl -sk https://localhost:8081/exporter | grep -Ev '# HELP|# TYPE' | cut -d '{' -f1 | sort -u

alertlevel
...
writetime_total
Configure Promtail to scrape logs from head nodes#
Note
Promtail configuration is accomplished as part of the wizard install of Autonomous Job Recovery.
Install NMC Grafana dashboards#
As part of NVIDIA Mission Control, a set of Grafana dashboards are provided that consolidate monitoring data across the cluster. These dashboards help track ongoing operations and support troubleshooting. This dashboard serves as a starting point for visualizing infrastructure telemetry. It is encouraged to modify or extend it based on the facility’s capabilities.
Prerequisites#
In addition to the steps above, the Infinity data source will need to be installed and configured to process data from the BCM REST API and UFM REST API.
Create a user to access the BCM REST API. Create user apiuser with password apiuserpassword with a read-only BCM profile:
cmsh -c "user; add apiuser; set password apiuserpassword; set profile readonly; commit"Create a new file with the following values. You will need credentials for accessing the UFM REST API:
cat << EOF > grafana_infinity.yaml
grafana:
  enabled: true
  plugins:
    - yesoreyeram-infinity-datasource
  additionalDataSources:
    - name: BCM API
      type: yesoreyeram-infinity-datasource
      access: proxy
      isDefault: false
      basicAuth: true
      basicAuthUser: apiuser
      jsonData:
        auth_method: 'basicAuth'
        allowedHosts:
          - https://master
        tlsSkipVerify: true
        timeoutInSeconds: 60
      secureJsonData:
        basicAuthPassword: apiuserpassword
    - name: UFM API
      type: yesoreyeram-infinity-datasource
      access: proxy
      isDefault: false
      basicAuth: true
      basicAuthUser: UFM_USER
      jsonData:
        auth_method: 'basicAuth'
        allowedHosts:
          - https://master
        tlsSkipVerify: true
        timeoutInSeconds: 60
      secureJsonData:
        basicAuthPassword: UFM_PASSWORD
EOF
Run the following command to apply the values:
helm upgrade kube-prometheus-stack prometheus-community/kube-prometheus-stack -n prometheus -f grafana_infinity.yaml --reuse-valuesTo access the UFM REST API, we need to install a port-forwarding rule within BCM as well. To configure this, you need to gather the IP address of the UFM appliance and replace it in the following command sequence:
cmsh -c "device; portforward create UFM_IP_ADDRESS 443 11443"This should be repeated on your secondary BCM head node, if you have one configured.
Note
The port-forwarding rules are not persisted on restarts of the BCM daemon process. If your head node reboots or the daemon restarts for any reason, you will need to rerun this port-forwarding sequence.
Download#
The dashboards are packaged as a Helm chart (.tgz file). Download the package appropriate to the customer account type:
Internal (NVIS / NVONLINE users)
Helm chart: https://apps.nvidia.com/PID/ContentLibraries/Detail?id=1142822
OEM Partners (via NVIDIA Partners Portal) 1142822
Note
OEMs must have an NVOnline account with Site Access. Contact the NVIDIA account team to set up an account if needed.
Installation#
Upload the .tgz file to the cluster head node.
Update values to enable folders within Grafana:
helm upgrade -n prometheus kube-prometheus-stack prometheus-community/kube-prometheus-stack \
  --reuse-values \
  --set grafana.sidecar.dashboards.enabled=true \
  --set grafana.sidecar.dashboards.provider.foldersFromFilesStructure=true
Run the following command (update the filename if needed):
helm upgrade --install -n prometheus nmc-dashboards nmc-grafana-dashboards-27.0.1.tgz --set gpu_type=b200
Run the following command (update the filename if needed):
helm upgrade --install -n prometheus nmc-dashboards nmc-grafana-dashboards-27.0.1.tgz --set gpu_type=gb200
Accessing dashboards#
In a browser, open:
https://<headnode>/grafanaLogin using default credentials:
Username: admin
Password: prom-operator
Navigate to Dashboards in the Grafana UI.
A folder named !! NMC Dashboards, which contains dashboards covering various operational aspects of the cluster, will be present.
Customization and BMS integration#
The dashboards included in this Helm chart are provided as examples. They are fully functional out of the box but are intended to be customized to match the customer’s specific cluster environment.
One dashboard, BMS View of Cluster, is configured to use NVIDIA Cronus as the Building Management System (BMS) data source. It displays power, liquid cooling, environmental, and other facility-level metrics.
Most customers will need to:
Integrate their own BMS with NVIDIA BCM.
Update the dashboard’s data source and queries to reflect their own BMS setup.
These dashboards serve as a starting point for visualizing infrastructure telemetry. The customer is encouraged to modify or extend them based on the facility’s capabilities and telemetry available. In some dashboards we show what filtering by rack can look like, but you might need to customize the filters to fit your situation.