Quickstart
Overview
Occupancy Analytics is a reference workflow or application for video analytics for the movements of people. This reference application analyzes the individual people movements, the distance between people, as well as the interactions between people and predefined feature maps such as a tripwire or a region of interest (ROI). This application provides various useful metrics as output including the people clusters where social distancing is violated, the counts of tripwire crossings and the number of people present in a given ROI. Developers can extrapolate this application to use cases other than people.
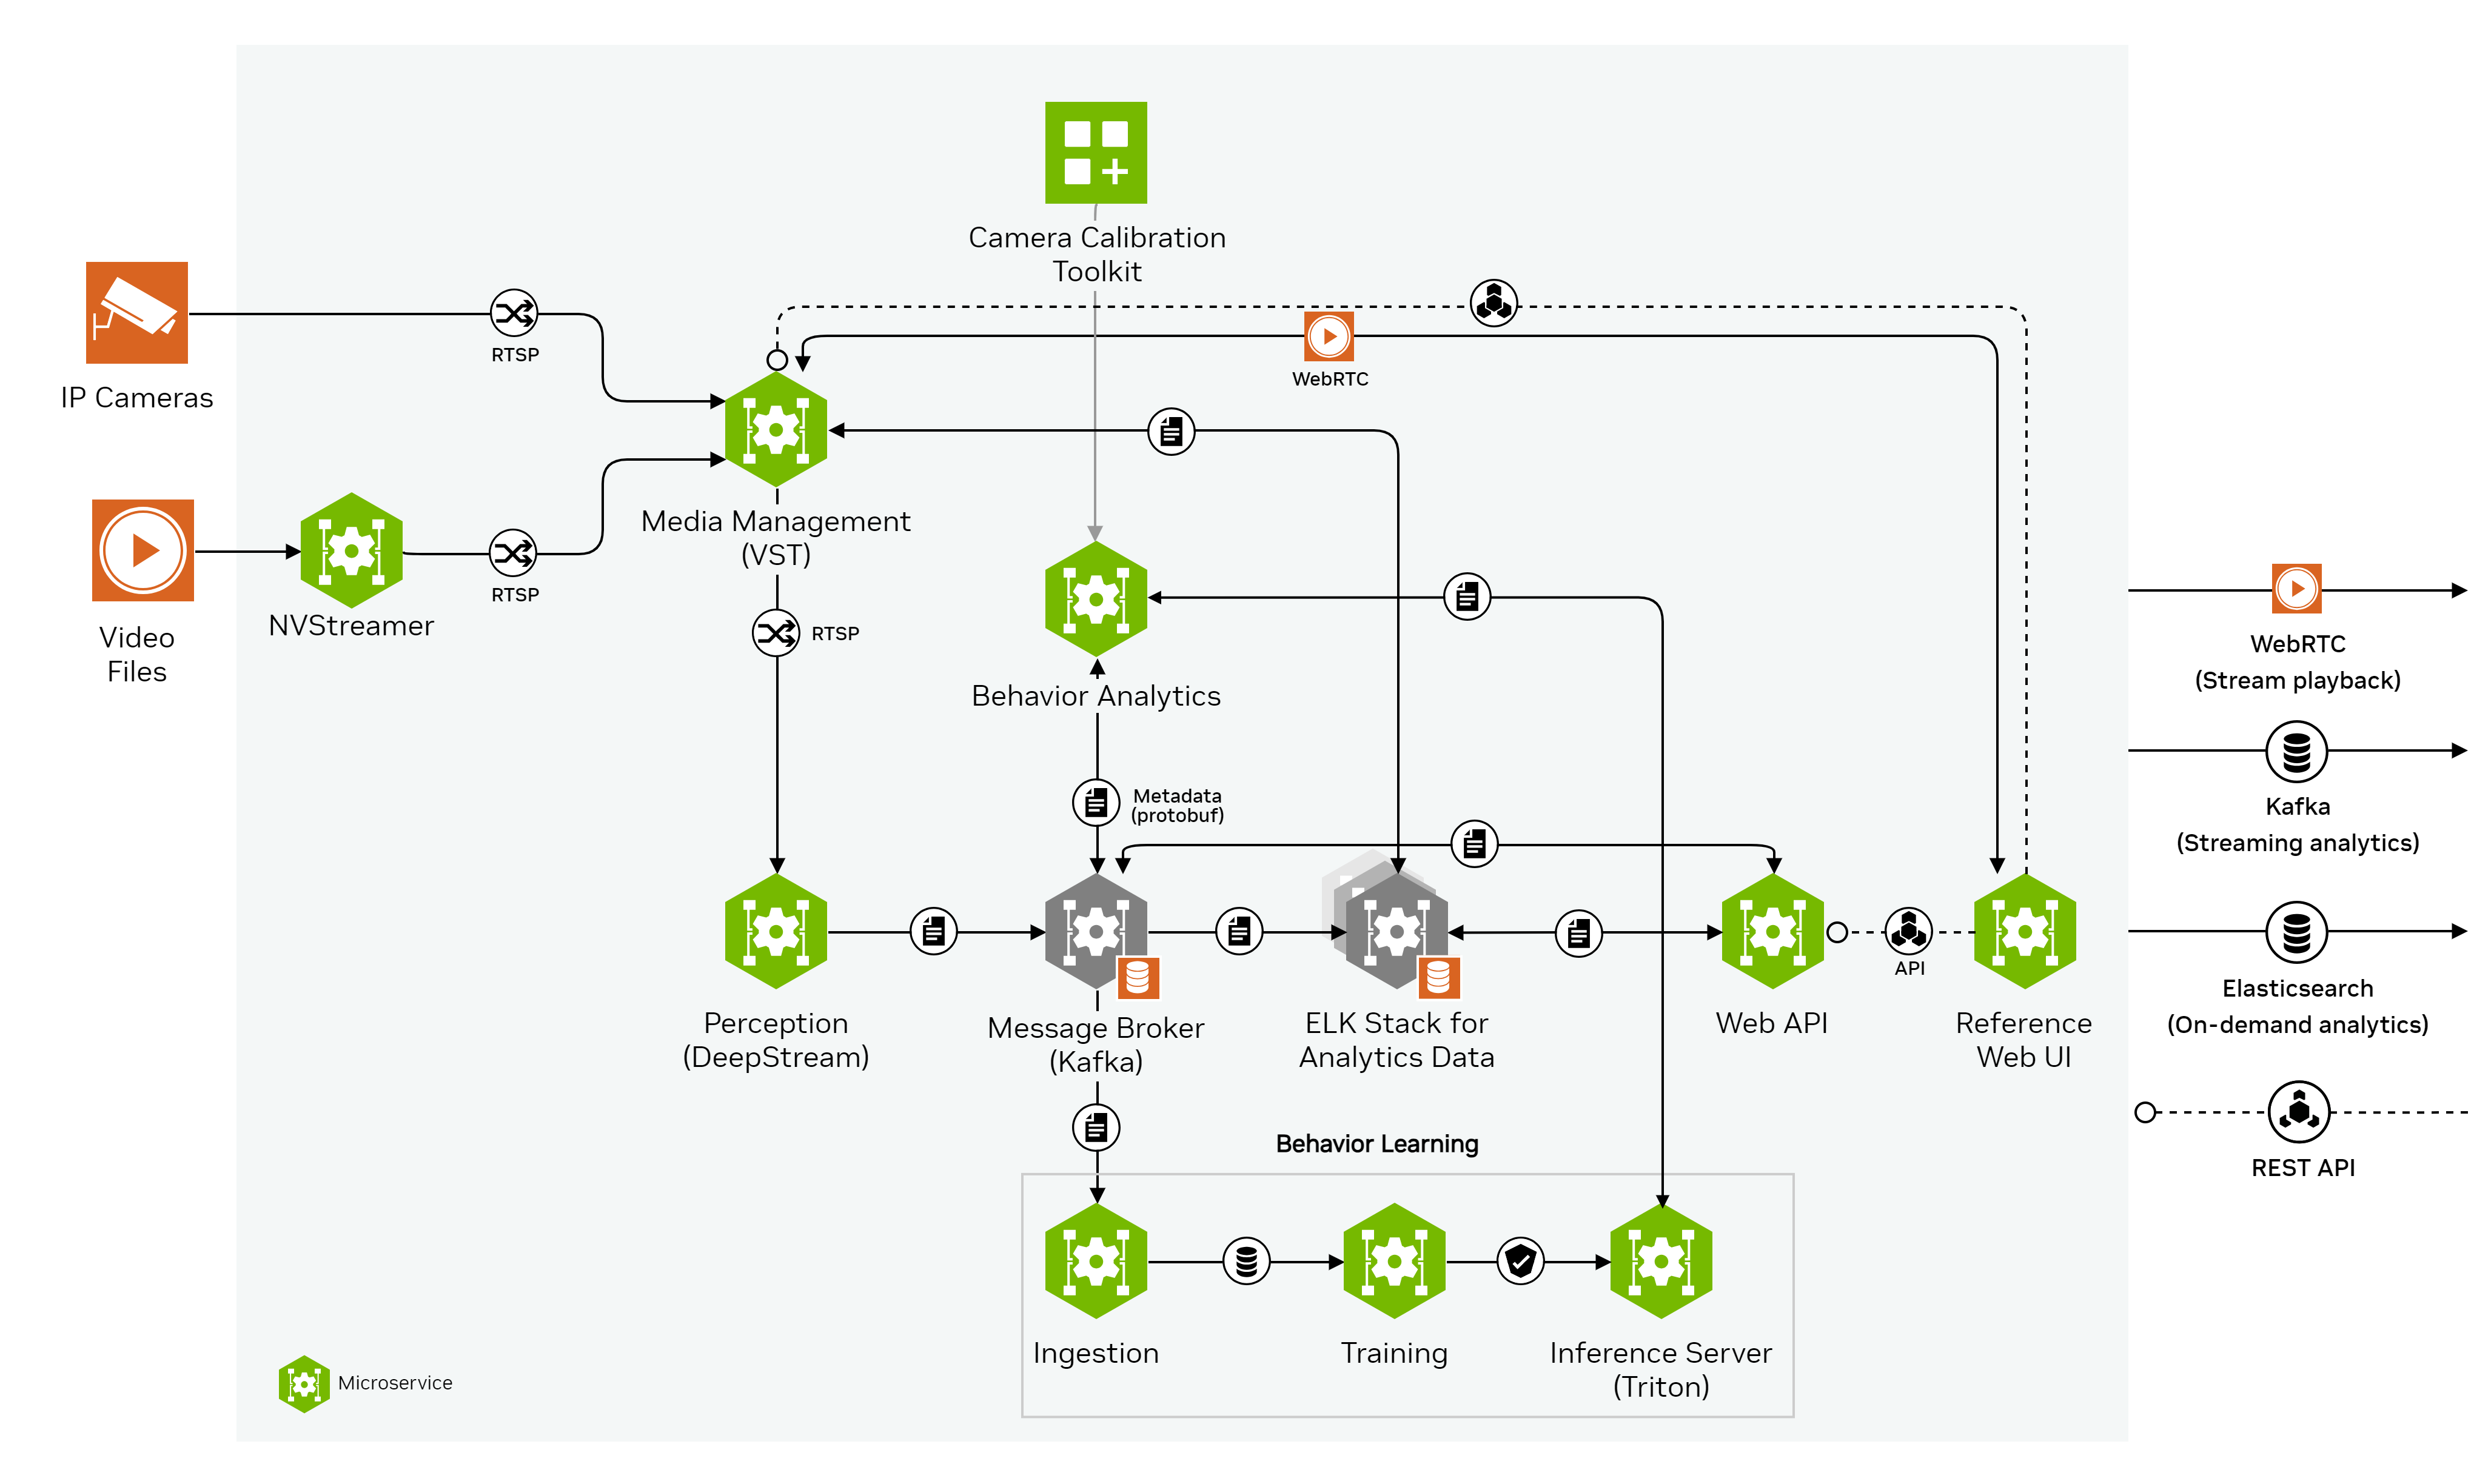
The image below shows the visual representation of the Occupancy Analytics end-to-end pipeline:

Media Management provides the video streaming and recording functionalities serving all downstream components as input sources. The RSTPs coming out from NVStreamer and VST goes to Perception (DeepStream) where raw meta data with bounding box, tracker id and class type for each detected object are generated. The raw meta data is transferred through Kafka message broker to Behavior Analytics where various behavioral characteristics are computed over time for each unique object and the behavior data are sent back to Kafka. Behavior learning keeps collecting the object oriented data and building models. The models are picked up by Triton Inference Server and Behavior Analytics uses the models from Triton to classify each behavior based on collected observations. The processed results from Behavior Analytics along with the raw meta data from Perception are saved in Elasticsearch via Kafka message broker and Logstash data ingestion. Web API queries saved data from Elasticsearch and provides endpoints with various integrated analytics and utilities and Web UI leverages the Web API endpoints and creates a browser based user interface for easy data visualization.
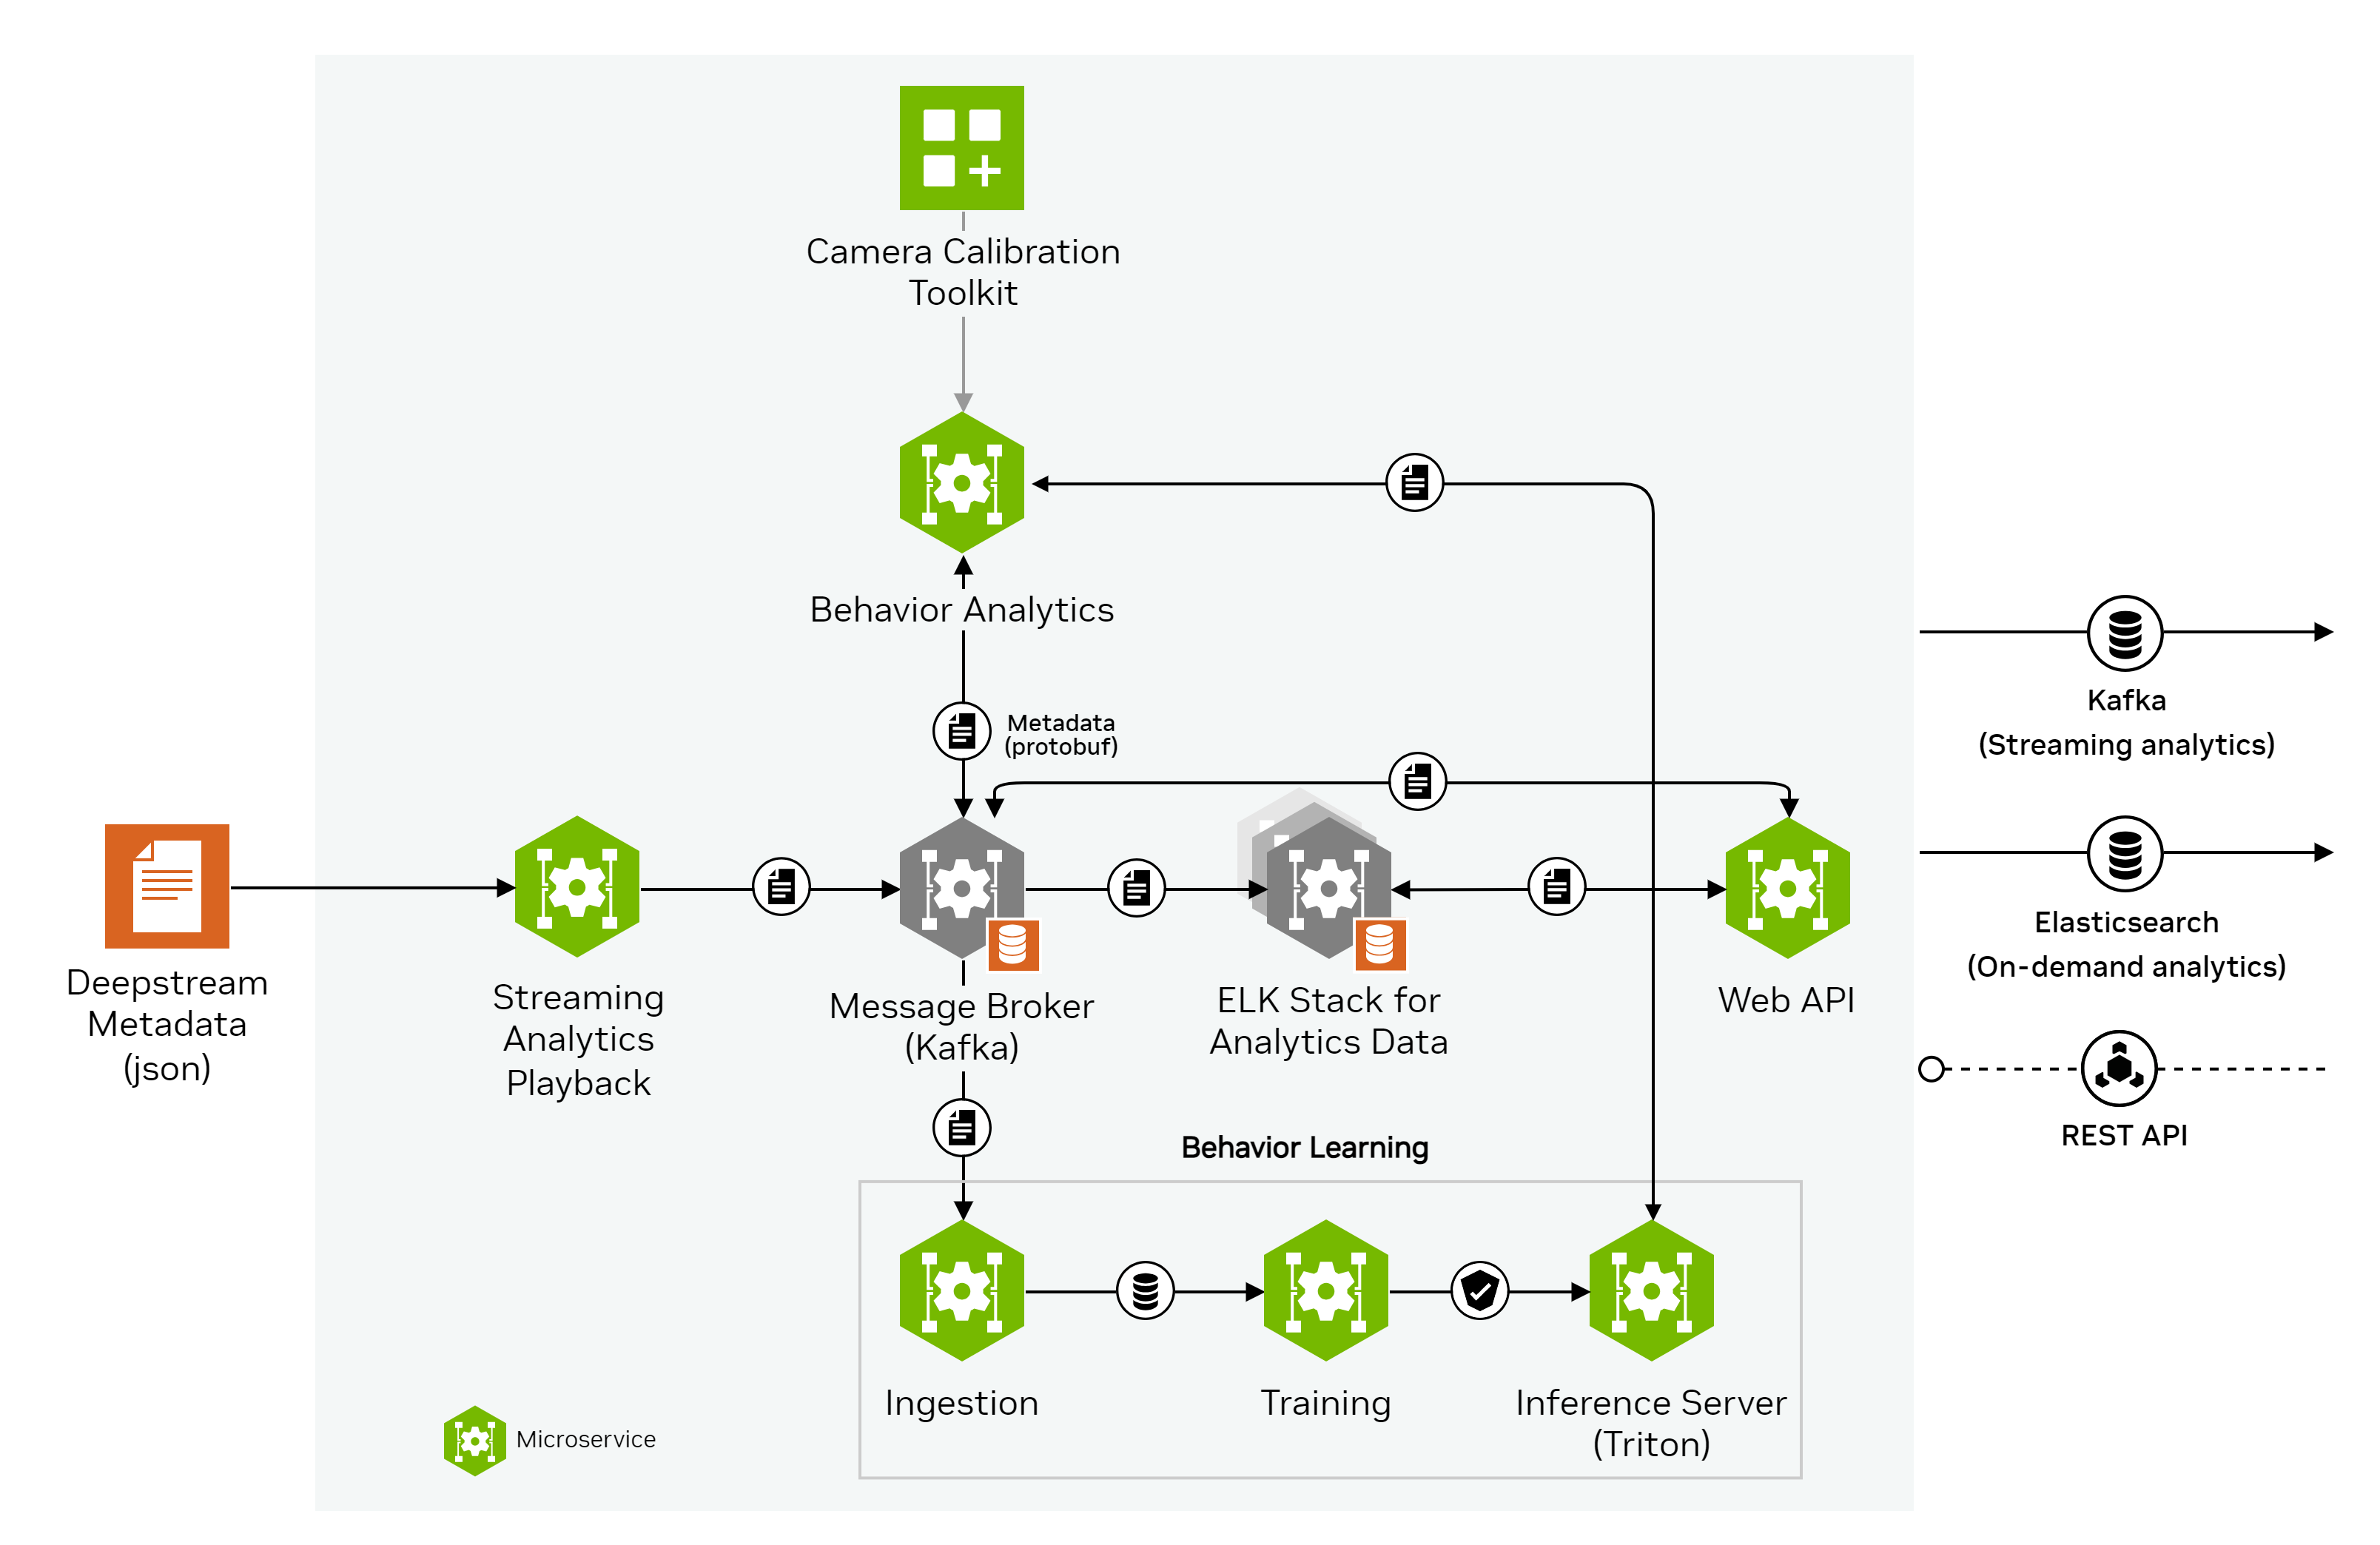
We also provide an optional to deploy the reference application without the heavy GPU dependent modules using pre-extracted metadata as input so that user have an light weight option to explore this reference application. Comparing to the above end-to-end mode, we all this option the playback mode. The image below shows a visual representation of the Occupancy Analytics app playback mode pipeline:

Quick Deployment
Deploy
To download and setup Metropolis apps, refer to the Quickstart Setup section.
The
--profileargument needs to be added to docker compose up command to select between two types of deployment: end-to-end and playback. To deploy the Occupancy Analytics app, navigate to themetropolis-apps-standalone-deployment/docker-composefolder.The end-to-end mode deploys every related module from NVStreamer/VST to UI. The end-to-end mode is for user to fully explore the entire pipeline. To deploy everything end-to-end, use
--profile e2e:$ docker compose -f foundational/mdx-foundational.yml -f people-analytics-app/mdx-people-analytics-app.yml --profile e2e up -d --pull always --build --force-recreate
The playback mode does not deploy NVStreamer, VST, Perception (DeepStream) and UI. Instead, a playback module using saved metadata will be used for streaming input data. The playback mode is for user to quickly investigate the data flow or replay saved data with the most light-weight pipeline. To deploy playback mode, use
--profile playback:$ docker compose -f foundational/mdx-foundational.yml -f people-analytics-app/mdx-people-analytics-app.yml --profile playback up -d --pull always --build --force-recreate
Initialization of some components of the reference application might take up to a minute. After the deployment, the following ports will be used to expose services from the reference application:
Calibration-Toolkit - 8003
Default Kafka port - 9092
Default ZooKeeper ports - 2181
Elasticsearch and Kibana (ELK) - 9200 and 5601, respectively
Jupyter Lab - 8888
NVStreamer - 31000 (for e2e mode only)
Triton - 8000 (HTTP), 8001 (GRPC)
VST - 30000 (for e2e mode only)
Web-API - 8081
Web-UI - 3002
Shutdown
To gracefully stop and shut down all services, run the command with the corresponding profile:
$ docker compose -f foundational/mdx-foundational.yml -f people-analytics-app/mdx-people-analytics-app.yml --profile e2e down
$ docker compose -f foundational/mdx-foundational.yml -f people-analytics-app/mdx-people-analytics-app.yml --profile playback down
Clean up (Optional)
Clean up data logs and images to ensure a clean re-deployment - highly recommended after any configuration or customization.
Clean up existing data and logs under
metropolis-apps-data/data_log/folder:$ sudo chmod +x cleanup_all_datalog.sh $ ./cleanup_all_datalog.sh
Note
The
cleanup_all_datalog.shscript is present insidemetropolis-apps-standalone-deployment/docker-compose/and includes an optional--delete-calibration-dataflag. This flag acceptstrueorfalseas values, withfalsebeing the default.Camera calibration is a time-consuming process. To preserve the calibration data, run the script without the flag or with the flag set to false, as in
./cleanup_all_datalog.sh --delete-calibration-data false.
Clean up existing Docker images and cached volumes (selective):
$ docker compose -f foundational/mdx-foundational.yml -f people-analytics-app/mdx-people-analytics-app.yml --profile e2e down --rmi all && docker volume rm `docker volume ls -q| grep -v 'deepstream\|calibration'`
$ docker compose -f foundational/mdx-foundational.yml -f people-analytics-app/mdx-people-analytics-app.yml --profile playback down --rmi all && docker volume rm `docker volume ls -q| grep -v 'deepstream\|calibration'`
Or, clean up existing Docker images and all cached volumes:
$ docker compose -f foundational/mdx-foundational.yml -f people-analytics-app/mdx-people-analytics-app.yml --profile e2e down --volumes --rmi all
$ docker compose -f foundational/mdx-foundational.yml -f people-analytics-app/mdx-people-analytics-app.yml --profile playback down --volumes --rmi all
$ docker volume prune
Note
The 1st set of commands preserves the calibration data volume.
It also retains the DeepStream volume to avoid the need to re-build engine files for the perception pipeline, which can be very time-consuming for heavy models (ViT-based, Swin-based, etc.).
Troubleshoot
To troubleshoot issues, developers can start with the FAQs.
Explore the Results
Explore the application features & output data via the following interfaces:
Kibana Dashboards
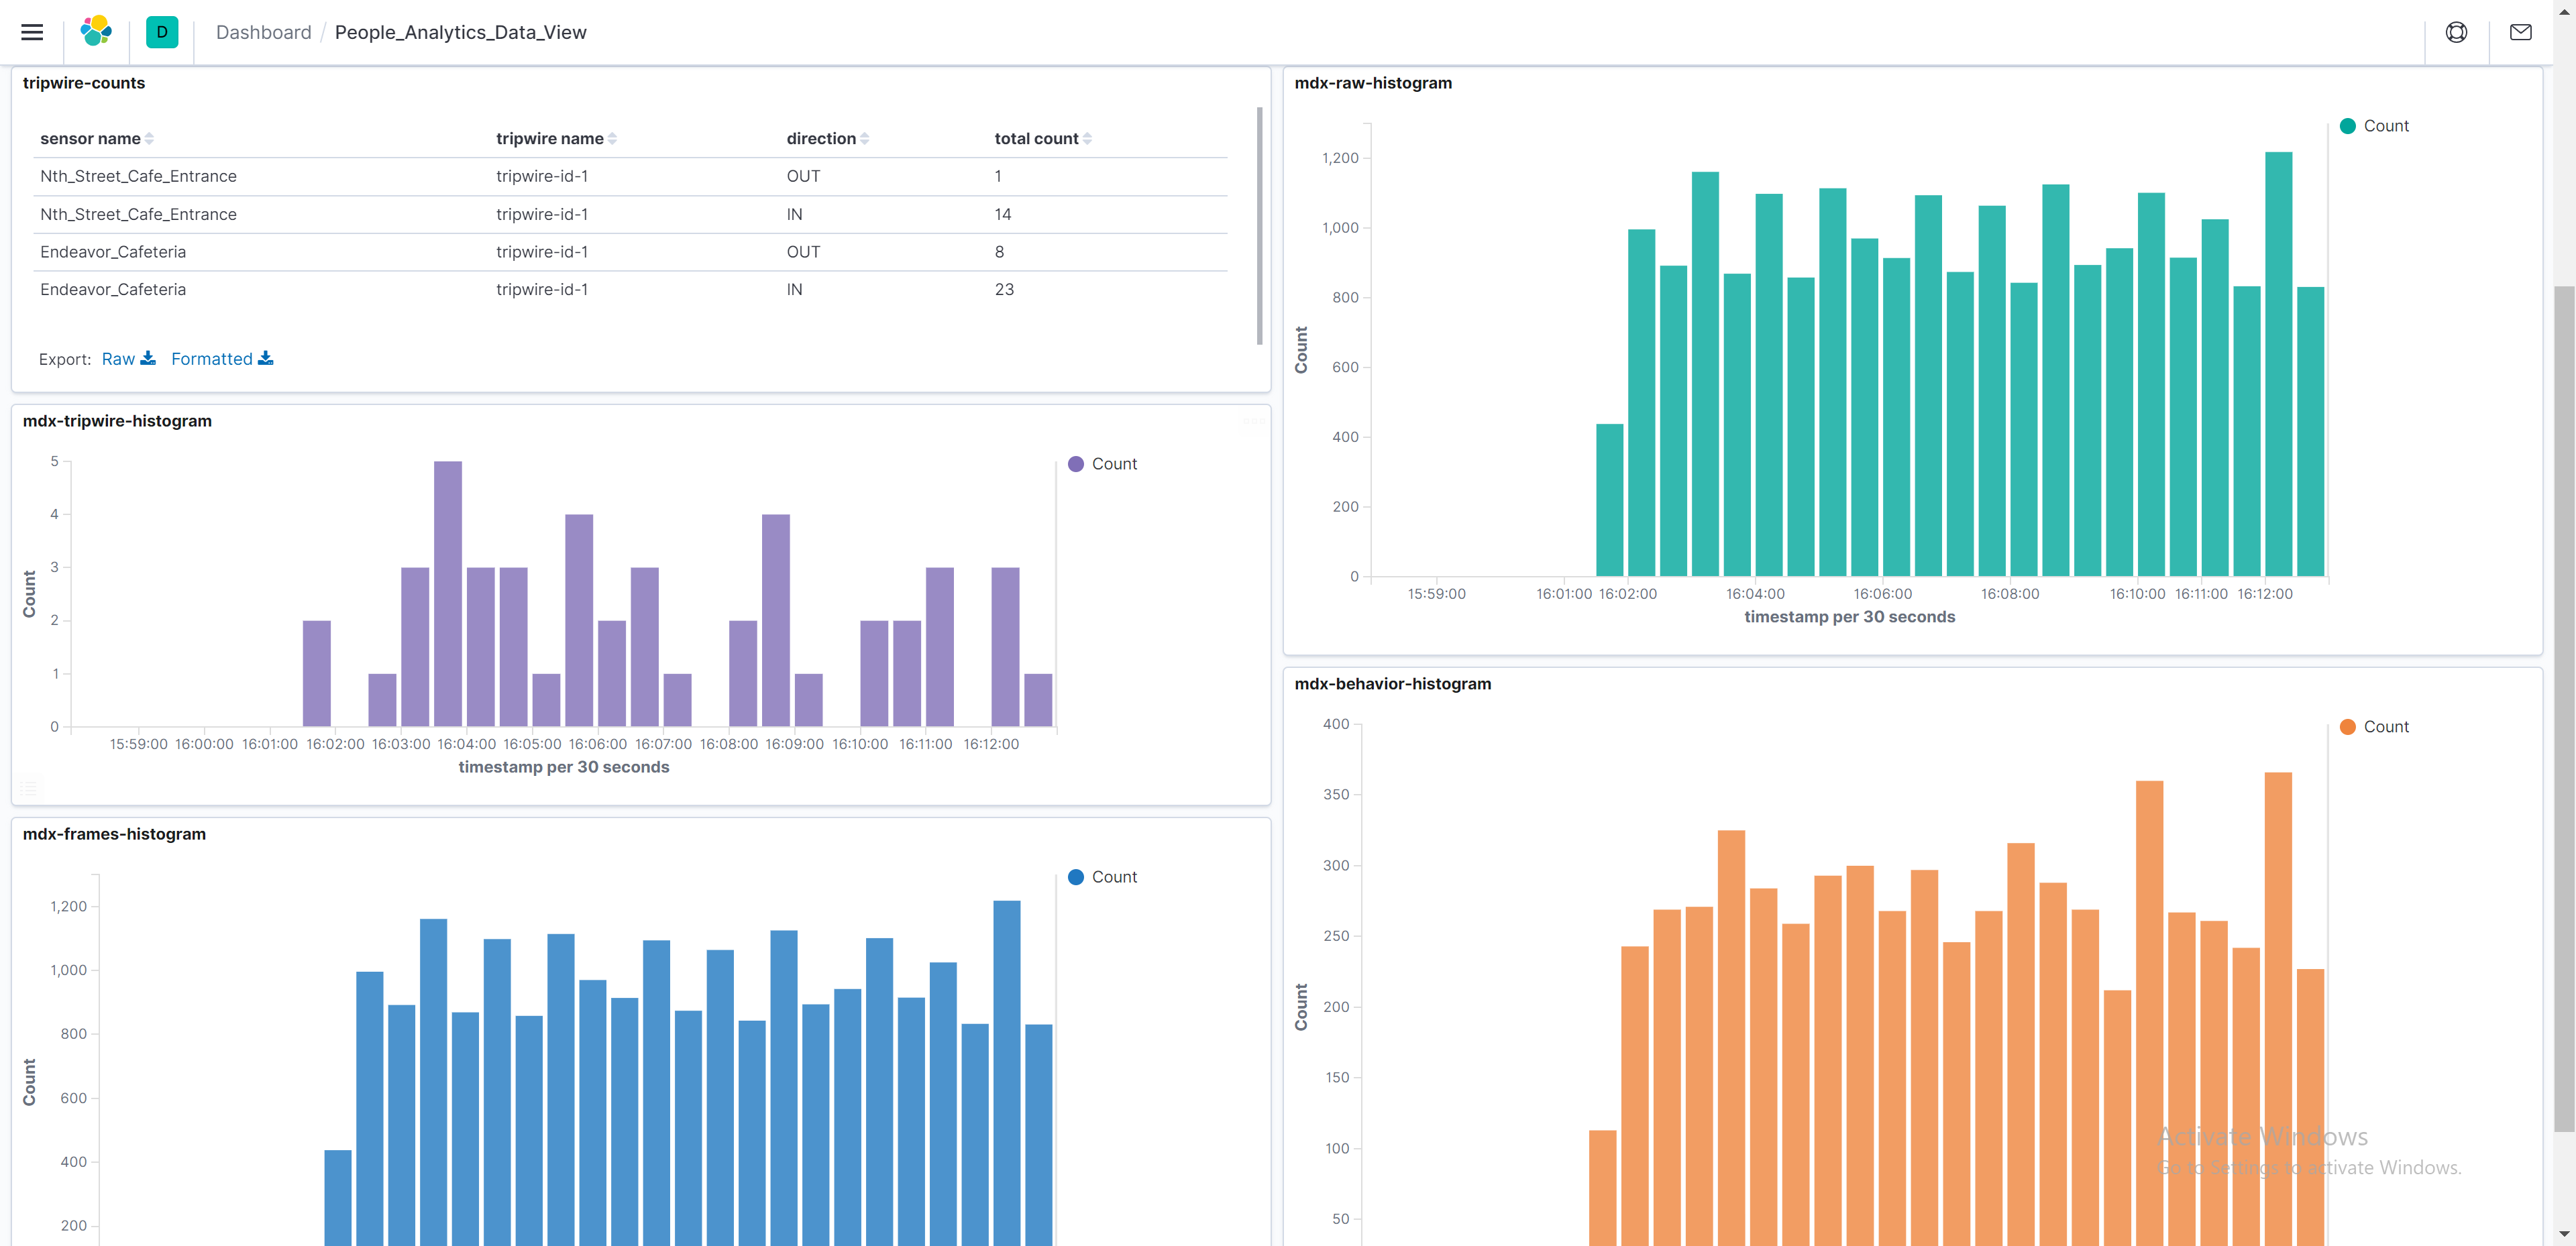
You can also explore data in Kibana at http://localhost:5601/ (replace with the deployment system IP if opening browser on a remote system). An init container imports a custom dashboard for the Occupancy Analytics app and creates all the required indexes. Access the dashboard by navigating to Menu/Dashboard and clicking on People_Analytics_Data_View dashboard.

The Kibana dashboard is a powerful tool to visualize data. You can interact with any of the visualization panels to filter the data according to a selection. You can read more about dashboards in the official Kibana dashboard documentation.
Reference UI
Once the Occupancy Analytics app deployment is complete, open a browser and access the UI at http://localhost:3002/ (replace with the deployment system IP if opening browser on a remote system).
Note
It will take some time for UI to start running. You can monitor UI deployment progress from docker logs by running:
$docker logs mdx-ui --follow
Multiple level of views are available in UI:
Campus/Building Level View
Room/Cameras Level View
Sensor Level View
For in-depth documentation of the component, refer to the Occupancy Analytics UI section.
API Tutorial Notebook
The reference UI calls the web API endpoints to create those functionalities. You can also explore the results via provided API endpoints and potentially use them in your own application.
Navigate to http://localhost:8888/ or http://<deployment-machine-ip>:8888/ on your browser, input metropolis as password/token and direct to .work folder.
occupancy-analytics.ipynb provides a walkthrough of all the key API endpoints in this Occupancy Analytics app, and you can try them out by just running through the cells.
Components
To further understand this reference application, here is a brief description of the key components.
Media Management
Both NVStreamer and VST are tailored media microservices with functionalities specialized for management & storage of live camera feeds and pre-recorded videos. NVIDIA media microservice group provides various video management services that are critical for end-to-end intelligent video analytics applications. For more details on NVIDIA Media Service refer to the following sections:
In this reference app, NVStreamer performs as a simulated live camera source where it streams contents from provided videos files as RTSPs. Those RTSPs are pipelined into VST just as live cameras and from there VST performs as the video managements system and interacts with downstream microservices such as Perception and UI.
The key functionalities of NVStreamer and VST in this reference app include:
NVStreamer provides RTSP streaming links to from given video files as the input source to VST and considered as simulated live streams.
VST provides RTSP streaming links to Perception (DeepStream) for image processing.
VST creates video clips overlaid with bounding boxes from extracted metadata.
VST provides WebRTC streaming links from given video files for visualization in UI.
VST provides a browser based UI which you can access from http://localhost:30000/.
There are videos directory provided in the metropolis-apps-data folder. Occupancy Analytics reference app uses the two videos: Endeavor_Cafeteria.mp4 and Nth_Street_Cafe_Entrance.mp4 that are present inside metropolis-apps-data/videos/people-analytics-app.
Perception (DeepStream)
The Perception (DeepStream) component generates streaming perception metadata which is consumed by Metropolis apps via the Kafka broker. These messages correspond to the sensors, and act as input data to the Occupancy Analytics reference app. The messages are compressed in protobuf format.
The Key contents of the message are:
sensor ID
frame ID and timestamp
detection bounding box
tracking ID
extracted feature vector
For more information on the schema and contents of the sensor metadata, refer to the Protobuf Schema section.
Note
The provided video files are around 16 minutes in length. In this reference application, Perception is configured to terminate when the video streaming reaches the end of file and stop sending metadata.
If you want to reprocess the video from the start, you can restart only the perception microservice (DeepStream app) by running
docker restart mdx-deepstream.
Behavior Analytics
Behavior Analytics is the core analytics component of Metropolis apps and is built using the Analytics Stream for Scala. The app can consume metadata form any source which adheres to a pre-defined mdx-schema (see JSON Schema and Protobuf Schema for details). Behavior Analytics generates the following key analytics for Occupancy Analytics reference app:
Room occupancy by calculating tripwire crossing.
Social distancing violations by using proximity detection.
ROI occupancy by calculating the people present in a given ROI.
Behavior data of people (includes speed, direction and distance travelled).
The results are published to the Kafka message broker for downstream components such as behavior learning to consume.
For the Occupancy Analytics application, the PeopleAnalytics.scala class in modules/behavior-analytics/src/main/scala/example folder is run. We encourage you to go through the sample code. For in-depth documentation of the component checkout Behavior Analytics documentation.
Note
Behavior Analytics relies on a sensor calibration file to process the sensor metadata. Sensor calibration allows us to map the output from the sensor-processing layer onto the Global Information System or Cartesian Coordinate map in Metropolis apps. For more information on calibration, refer to the Camera Calibration section.
Behavior learning
Behavior learning is a python based component that consumes behavior data generated by Behavior Analytics and periodically trains sensor specific models for clustering trajectories. These models are uploaded to a triton inference server and used by the Behavior Analytics component for clustering the streaming data. Trajectory clustering identifies useful footfall patterns for the Occupancy Analytics app.
Behavior learning runs the Ingestion and ModelTraining classes present in the modules/behavior-learning folder. We encourage you to go through the sample code. For in-depth documentation of the component, refer to the Behavior Learning section.
Web API
The Web API component provides REST APIs and Web Socket Interfaces for a wide set of functions on the data produced by Behavior Analytics. The Web API exposes various functions used by the Occupancy Analytics UI, such as:
Fetching KPIs / Metrics for different sensors:
Occupancy in a room.
Event count for a tripwire.
ProximityDetection: Fetches clusters of objects which are in proximity of each other.
Fetching trajectory/behavior clusters.
Utility functions such as saving camera calibration.
For example, the following request fetches the number of people crossing a defined tripwire:
curl "http://localhost:8081/kpi/tripwire/counts?fromTimestamp=T1&toTimestamp=T2&sensorId=Endeavor_Cafeteria"
where T1 and T2 are valid timestamps following ISO 8601 format (example: 2024-04-15T20:57:55.000Z) and T1<T2.
The web API component is started with the index.js present in modules/analytics-tracking-web-api. We encourage you to go through the code. For in-depth documentation of the component, refer to the Analytics and Tracking API section.
Web UI
The Occupancy Analytics reference web UI visualizes the valuable insights generated by the Occupancy Analytics app and helps in monitoring and management of both indoor and outdoor spaces such as rooms, hallways, entry/exit doors. For in-depth documentation of the component, refer to the Occupancy Analytics UI section.
Note
The entire source code for the Occupancy Analytics app UI is present in the modules/analytics-tracking-web-ui/apps/sd folder. Users can extend the given UI or even create a new one that fits their use case while leveraging the endpoints provided by the Web API component.
Conclusion
Congratulations! You have successfully deployed key microservices and built an Occupancy Analytics application.
We encourage you to explore the remaining reference applications provided as part of Metropolis Microservices. Below are additional resources:
Quickstart Setup - Guide to deploy all reference applications in the standalone mode via Docker Compose.
Production Deployment Setup - Guide to deploying Metropolis microservices in a Kubernetes environment.
FAQs- A list of commonly asked questions.