mlxtool
mlxtool is a general utility used for debugging the driver using a command line.
Usage
mlxtool.exe <tool-name> <tool-arguments>
Installation
The tool is installed as part of the WinOF package, starting from WinOF v5.10. The package can be found in the following path:
C:\Program Files\Mellanox\MLNX_VPI\Tools
Extracting the Tool from the Package
In case the previous WinOF version is used (v5.10), the tool can be extracted from WinOF Rev 5.50 package.
In order to extract the tool, please follow the steps in Extracting Files Without Running Installation. Make sure to copy the tool and the following files to the same location: mlxtool.exe, complib.dll, mlxapi.dll.
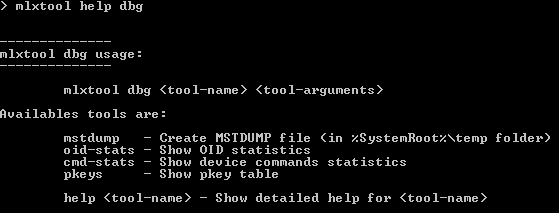
mlxtool help has all the data required to operate all sub-tools and their arguments, and it is highly recommended to use it.
mlxtool or mlxtool help
Lists the general usage and the available sub-tools supported in this version.
mlxtool help <sub-tool>
Lists all the available arguments that can be used in a certain tool and provides a short description per argument.
Example:
mlxtool <sub-tool> help <argument>
Shows details about the sub-tool and its arguments with a usage example.
Example:
This sub-tool is used to extract debug information.
Usage
mlxtool.exe dbg <sub-tool> <arguments>
nonrss-capture
This sub-tool is used to control the miniport driver's NonRss packet snip capturing. For more information, see Section 3.9.4.4.1, “Non-RSS Packet Capturing”, on page 159.
Usage
            mlxtool dbg nonrss-capture <Interface Name>
<"start"|"stop"|"query"|"collect"> [OTHER PARAMETERS]
Other Parameters
For “start”, provide <Circular buffer size> <Number of bytes to capture per packet>
For “collect”, provide <Output pcap file name> <VPortID in case of virtualization>
sw-reset
This sub-tool is used to trigger a software reset request.
Usage
mlxtool dbg sw-reset <pci-bus#> <pci-device#> <pci-function#>
mstdump
This tool is used to create 6 mstdump files upon user request. For further information on the files created, you may refer to Table 64, “Events Causing Automatic State Dumps,” on page 214.
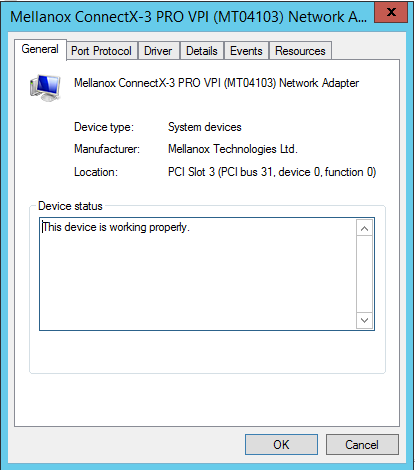
The parameters that should be used in following command are the PCI information found under “Location” as demonstrated in the image below:
<bus#> <device#> <function#>
The output will indicate the files location and the index in the file name for this execution:

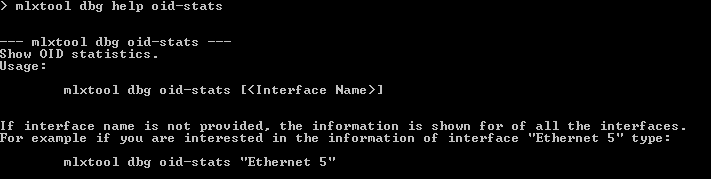
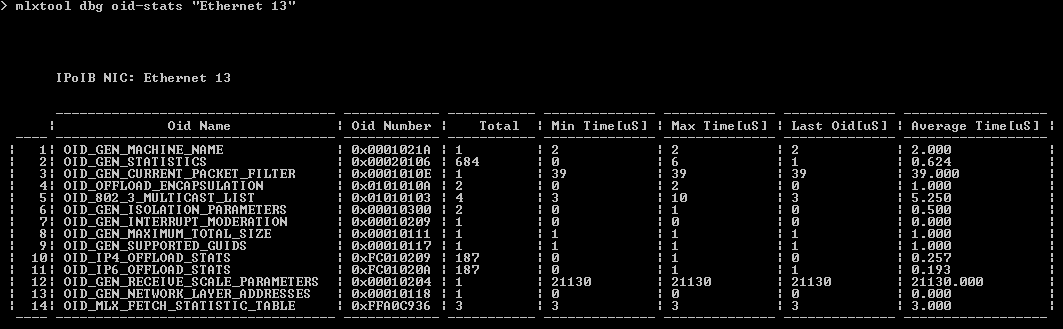
oid-stats
This tool displays the OIDs statistics from Ethernet and IPoIB drivers in microsecond:
In order to view the list of all valid ports, please refer to Section 4.6.3.4, “show port list”, on page 196.
cmd-stats
This tool displays the device commands statistics in millisecond:
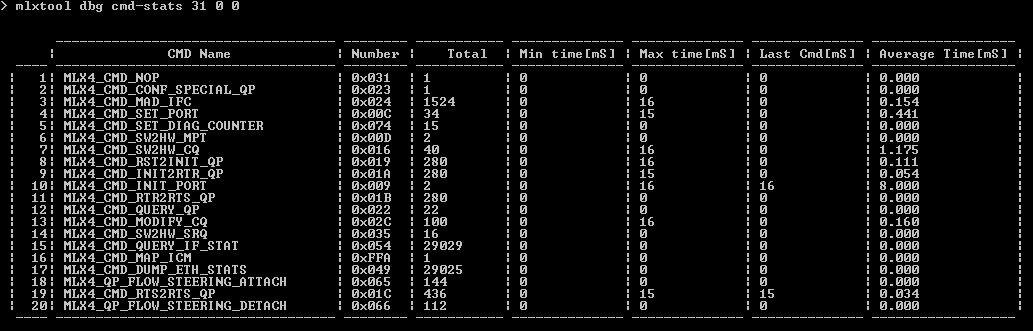
The parameters used in this command are:
<bus#> <device#> <function#>
For further details on these parameters, refer to Section 4.6.2.3, “mstdump”, on page 189.
In order to view the list of all devices, please refer to Section 4.6.3.5, “show device list”, on page 196.
pkeys
This tool displays the pkeys (indexes and values) available for each IPoIB interface.
Example:
If you wish to display the information of "Ethernet 5" interface, run the following command:
mlxtool dbg pkeys "Ethernet 5"
This command can be invoked on a specific IPoIB interface. If no interface name is provided, the information will be shown for all the interfaces.
            ConnectX IPoIB NIC: Ethernet 7
              ---------------- ------------
             |    PKEY index |   PKEY     |
              ---------------- ------------
             |     0         |   ffff     |
             |     1         |   f123     |
             |     2         |   9563     |
              ---------------- ------------
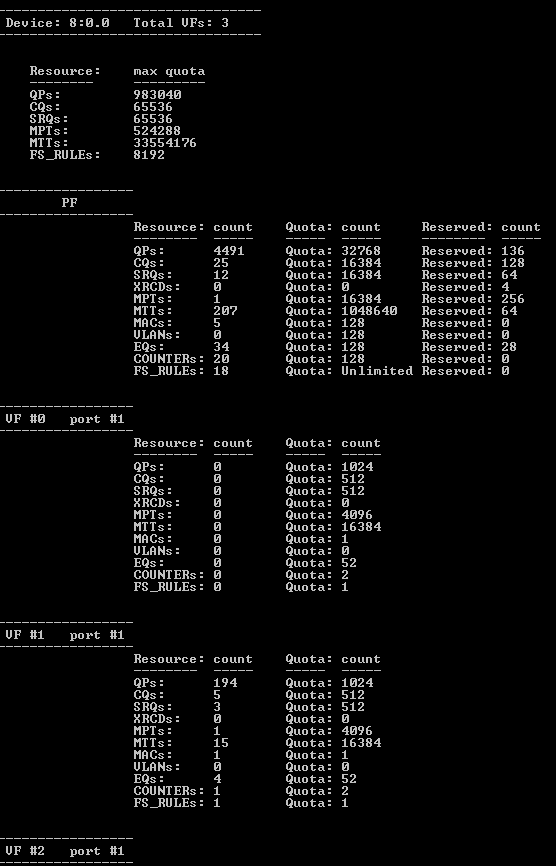
Resources
This tool is used for pulling resource tracker information for VFs. In addition, it displays the effective max (the max quotas supported by the machine for resource type minus the firmware quota reserved) for QPs, CQs, SRQs, MPTs, MTTs and FS_RULEs.
The parameters that should be used in the following command are detailed in the PCI information found under "Location”, as demonstrated in the image below:
<bus#> <device#> <function#>
For further details on these parameters, refer to Section 4.6.2.3, “mstdump”, on page 189.
In order to view the list of all devices, refer to Section 4.6.3.5, “show device list”, on page 196.
Usage:
mlxtool.exe dbg resources [<pci-bus#> <pci-device#> <pci-function#>]
Example:
If "Location" is "PCI Slot 3 (PCI bus 130, device 0, function 0)", type:
mlxtool.exe dbg resources 130 0 0
If PCI is not provided, the information is shown for of all the devices.
Ipoib-ep
This tool is used to show end points known to the ipoib driver.
Usage:
mlxtool.exe dbg ipoib-ep [<-l>][<-m>][<-r>][<Interface Name>]
Flags:
            -l local end points
-m multicast end points
-r remote end points
There is no meaning to the order of the flags.
Example:
To show multicast and remote EP for interface "Ethernet 5", type:
mlxtool dbg ipoib-ep -m -r "Ethernet 5"
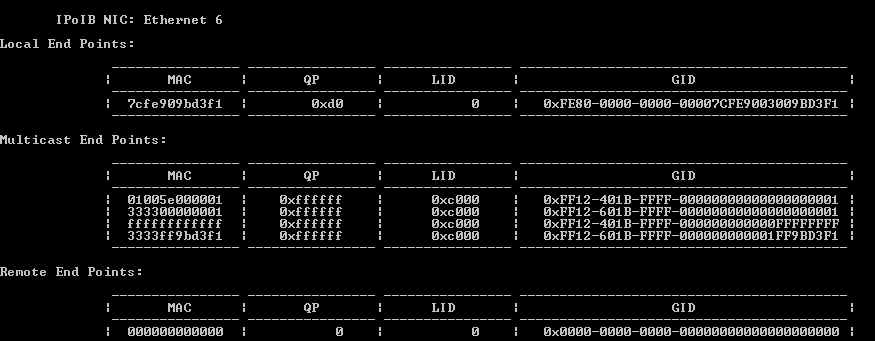
If no flags are provided, then local, multicast and remote EP tables should be displayed.
If interface name is not provided, the information is shown for of all the interfaces.
Get-state
This tool is used to show the device state.
The parameters that should be used in the following command are detailed in the PCI information found under "Location”, as demonstrated in the image below:
<bus#> <device#> <function#>
For further details on these parameters, please refer to Section 4.6.2.3, “mstdump”, on page 189.
In order to view the list of all devices, please refer to Section 4.6.3.5, “show device list”, on page 196.
Usage:
mlxtool.exe dbg get-state [<pci-bus#> <pci-device#> <pci-function#>]
Example:
If "Location" is "PCI Slot 3 (PCI bus 31, device 0, function 0)", type:
mlxtool dbg get-state 31 0 0

If PCI is not provided, the information is shown for of all the devices.
Restart
Restart interface network adapter.
Usage:
mlxtool dbg restart <Interface Name>
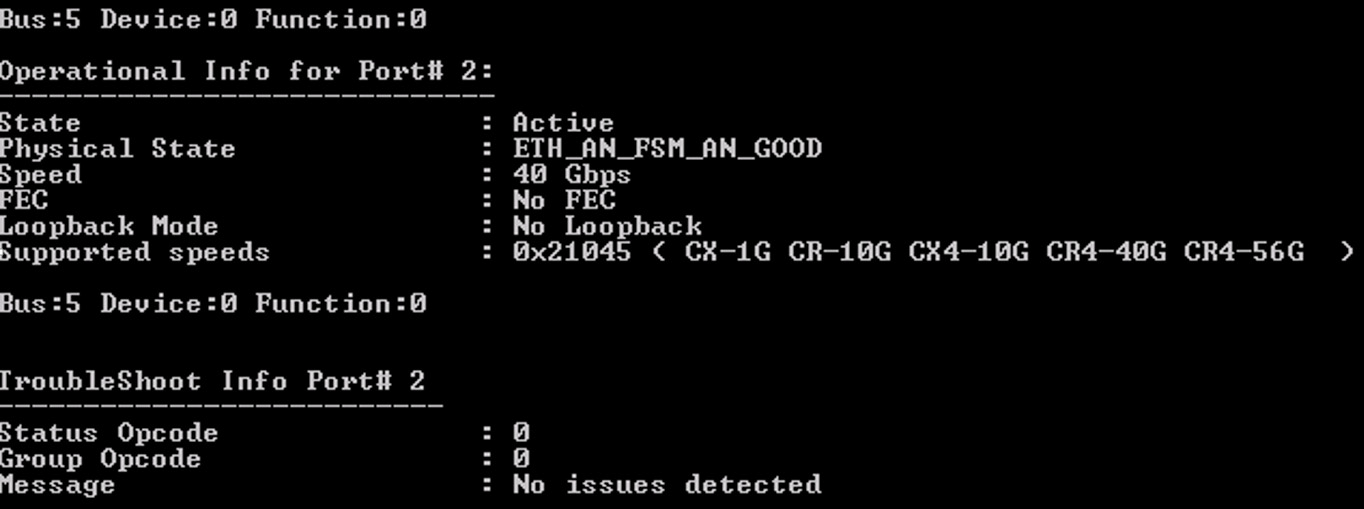
Port Diagnostic Database Register
The tool provides troubleshooting and operational information that can assist in debugging physical layer link related issues.
Usage:
Example:
mlxtool dbg pddrinfo 2 0 0 1
Please note, if the PCI is not specified, the PDDR information for each port will apply to all devices.
Example:
mlxtool dbg pddrinfo
Sample Output:
This tool is used to show specific information.
Usage:
mlxtool.exe show <tool-name> <tool-arguments>
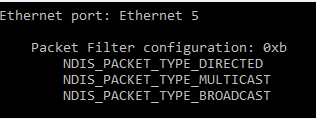
show packet-filter
This tool is used to show the packet filter configuration.
Usage:
mlxtool show packet-filter [<Interface Name>]
Example:
mlxtool show packet-filter "Ethernet 5"
show qos
This tool is used to show the QOS settings.
Usage:
mlxtool show qos [<pci-bus#> <pci-device#> <pci-function#>]
show nd
This tool is used to show the ND connections.
Usage:
mlxtool show nd connections [-a <IP address>] [-p <Process Id>] [-e <error>] [-n count][-t time]
where:
            -a|--address <IP address>] - enumerate ND connections of this ND adapter.(default:all)
-p|--pid Process Id        - enumerate ND connections for the process with this Process Id.(default:all)
-e|--error                 - Show QPs in error state
-n|--count                 - Number of QPs(in case of -e) or EPs to fetch at one go from NDFLTR(default:1000,max:10000)
-t|--time                  - Time interval between each info fetch in seconds(Can only be run with -e flag. Default: 2seconds)
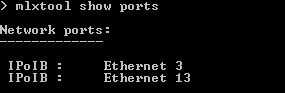
show port list
This tool is used to show the Ethernet and IPoIB port list:
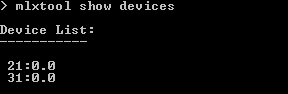
show device list
This tool is used to show the PCI list for devices:
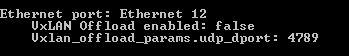
Show vxlan
This tool is used to show VXLAN offload configuration.
Usage:
mlxtool.exe show vxlan [<Interface Name>]
Example:
If you wish to display the information of a specific Ethernet interface, for example "Ethernet 12", run the following command:
mlxtool.exe show vxlan "Ethernet 12"
If the interface name is not provided, the information is shown for of all the Ethernet interfaces.
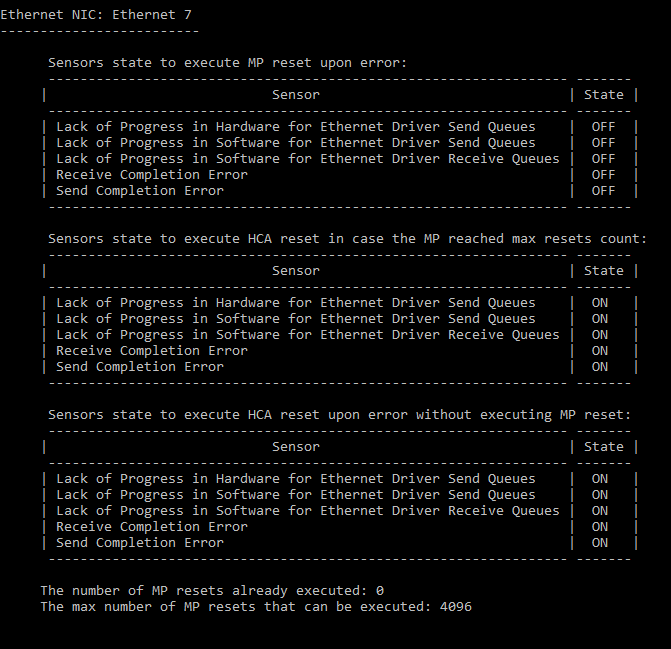
Show selfhealing
This tool is used to show sensors state and resets count.
Usage:
mlxtool show selfhealing <tool-name> <tool-arguments>
show selfhealing port
This tool is used to show sensors state and resets count for an interface.
Usage:
mlxtool show selfhealing port [Interface Name]
If an interface name is not provided, the information is shown for of all the interfaces.
Example:
mlxtool show selfhealing port "Ethernet 7"
regkeys
This tool is used to show registry keys information.
Usage:
mlxtool.exe show regkeys <tool-name> <tool-arguments>
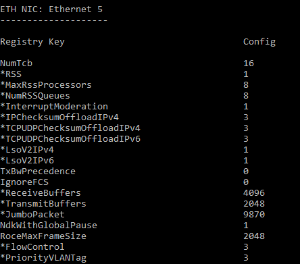
show regkeys config
This tool is used to show registry keys configurations from the driver.
Usage:
mlxtool.exe show regkeys config [<Eth Interface Name>]
For the information of interface "Ethernet 5”, type:
mlxtool.exe show regkeys config "Ethernet 5"
Sample Output:
If the interface name is not specified, the information is shown for of all the Ethernet interfaces.
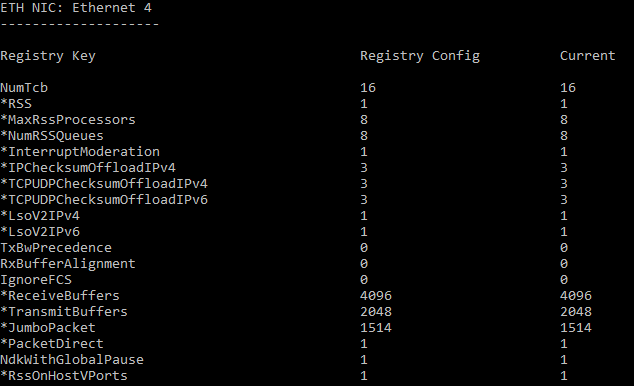
Show regkeys diff
This tool used to show registry keys settings from registry and driver.
Usage:
mlxtool.exe show regkeys config [<Eth Interface Name>]
For the information of interface "Ethernet 5”, type:
mlxtool.exe show regkey diff "Ethernet 5"
Sample Output:
If the interface name is not specified, the information is shown for of all the Ethernet interfaces.
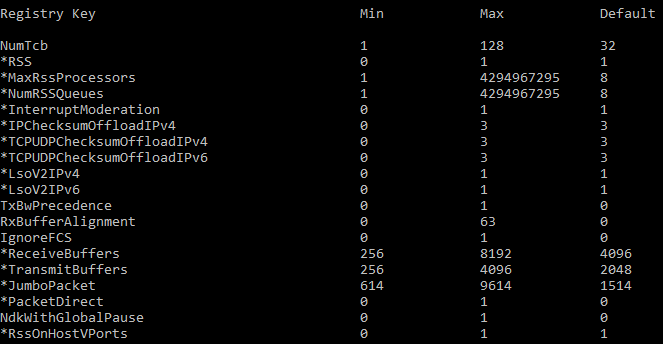
show regkeys info
This tool is used to show registry keys information: Default, Min and Max settings.
Usage:
mlxtool.exe show regkeys info [<Eth Interface Name>]
For the information of interface "Ethernet 5”, type:
mlxtool.exe show regkeys info "Ethernet 5"
Sample Output:
If the interface name is not specified, the information is shown for of all the Ethernet interfaces.
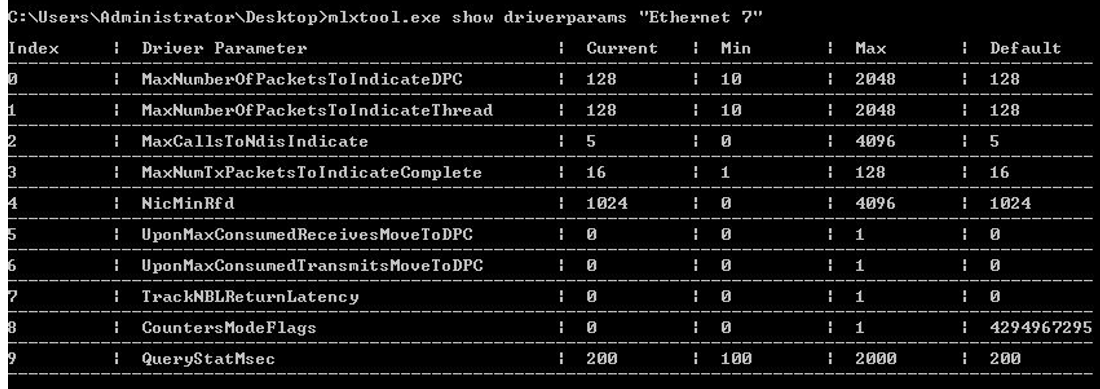
show driverParams
The tool displays the default, min, max and current values of certain internal driver parameters which can be updated using the "modify" command to take effect, without requiring driver restart.
Usage:
mlxtool.exe show driverparams <interface name>
Example:
mlxtool.exe show driverparams "Ethernet 5"
|
Output Fields |
Description |
|
MaxNumberOfPacketsToIndicateDPC |
Maximum number of RX packets to indicate to OS in Interrupt mode. |
|
MaxNumberOfPacketsToIndicateThread |
Maximum number of RX packets to indicate to thee OS in polling mode. |
|
MaxCallsToNdisIndicate |
Maximum number of times chained packets can be indicated before packets processing is stop processing is stopped. |
|
MaxNumTxPacketsToIndicateComplete |
Maximum number of TX packets to complete back to the OS in one call. |
|
NicMinRfd |
Minimum NIC receive frame descriptors to hold the incoming RX packets. |
|
UponMaxConsumedReceivesMoveToDPC |
Move to Interrupt mode once the maximum RX packet processing limit is reached. |
|
UponMaxConsumedTransmitsMoveToDPC |
Move to Interrupt mode once we the maximum TX packet processing limit is reached. |
|
TrackNBLReturnLatency |
Enables the driver to calculate the time from when it indicated to the OS to the time it received the RX buffer back. |
|
CountersModeFlags |
Disable or enable caching statistics. |
|
QueryStatsMsec |
Timer in milliseconds to query statistics periodically. |
Sample Output:
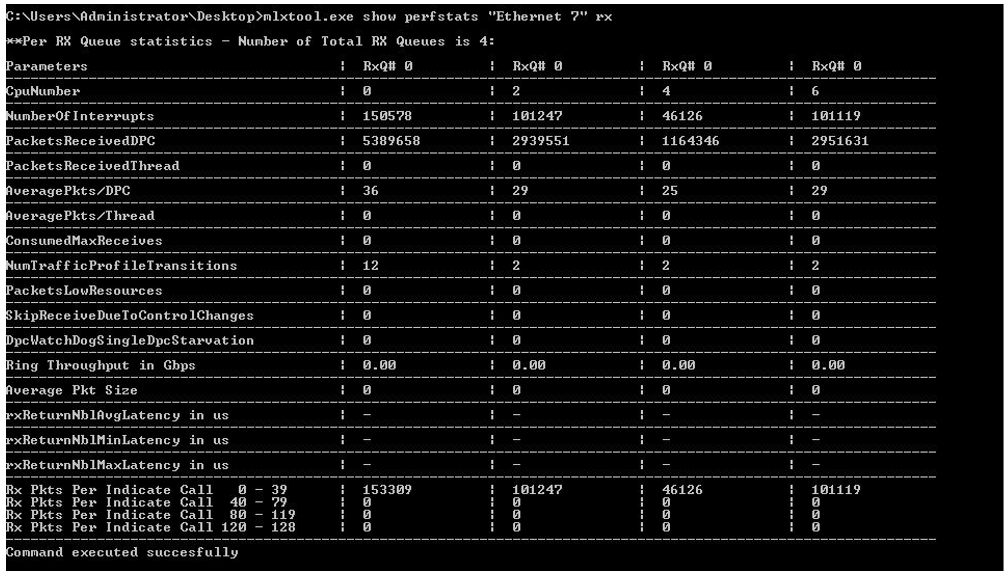
show perfstats
The tool displays runtime ring statistics (both RX and TX rings), and specific global statistics. The tool can be used to create snapshots, gather statistics for a certain time duration, or reset them.
Usage:
Example:
Additional Options:
RX | TX: provides a snapshot of ring statistics
RXD <time in seconds>|TXD <time in seconds>: provides ring statistics for a certain time duration
RxReset|TxReset|GlobalReset: internally resets statistics
ShowAll: dumps a snapshot of all TX, RX and global statistics
ResetAll: internally resets all TX, RX and global statistics
|
Output Fields |
Description |
|
PacketsReceivedDPC |
Number of packets processed in Interrupt mode. |
|
PacketsReceivedThread |
Number of packets processed in Polling mode. |
|
Average Packets Per DPC |
Average number of packets indicated to OS in interrupt mode. |
|
Average Packets Per Thread |
Average number of packets indicated to OS in polling mode. |
|
ConsumedMaxReceives |
Number of times the max packet limit was processed (128 packets default) |
|
NumTrafficProfileTransitions |
Number of transfers from interrupt mode to polling mode |
|
PacketsLowResources |
Number of times packets with low resources were indicated. In this mode, the driver has immediate packet ownership. |
|
SkipReceiveDueToControlChanges |
Bail out from RX processing after entering it due to external factors. |
|
DpcWatchDogSingleDpcStarvation |
This counter is incremented each time DPC timer limit is hit (or nearing). |
|
DpcWatchDogTotalDpcStarvation |
This counter is incremented each time DPC watchdog limit is hit (or nearing). |
|
Ring Throughput |
Runtime Ring throughput in G/bps. |
|
Histogram of Number Of Received Packets Per Indicate Call (non-low resources) |
Histogram displaying the number of times we indicated less than or equal to 'x' packets to the OS, in either DPC or polling mode. Example: Range Hits ------- ------ 0- 39 4 40 - 79 2 |
Sample Output:
This tool is used to modify driver parameters.
Usage:
mlxtool.exe modify <tool-name> <tool-arguments>
Modify Traffic Classes Bandwidth (BW) Limit Configuration Tool
This tool is used to modify the BW limitations’ configuration for the different traffic classes.
Usage:
mlxtool.exe modify tc-bw <Interface Name> <traffic class> <max BW in Mbps units> [<traffic class 2> <max BW in Mbps units 2>... <traffic class n> <max BW in Mbps units n>]
This tool requires an interface name and at least one traffic class to change. Any number of traffic class and BW limitation pairs may follow.
For example, to change for adapter "Ethernet 6" traffic class number 3 limitation to 100 Mbps, and traffic class number 5 limitation to 300 Mbps, run the following command:
mlxtool.exe modify tc-bw "Ethernet 6" 3 100 5 300
The tool supports rates in units of 100Mbps or 1GBps. The requested BW limitations values will be rounded down to the closest supported value. A rate below the minimal value supported by the device will be rounded up to the minimal value supported (100Mbps).