

The Dashboard
The Dashboard
The dashboard, shown in the following figure, is the central panel for Fleet Intelligence. The core features of the header include, from left to right:
- NVIDIA GPU Cloud tool (upper-left) — Fleet Intelligence.
- Fleet Intelligence tabs — Dashboard, Inventory, Debugging, Reports, Settings.
- Info icon — shows the current version of Fleet Intelligence.
- Help (?) — opens NVIDIA GPU Cloud help.
- NVIDIA GPU Cloud menu.
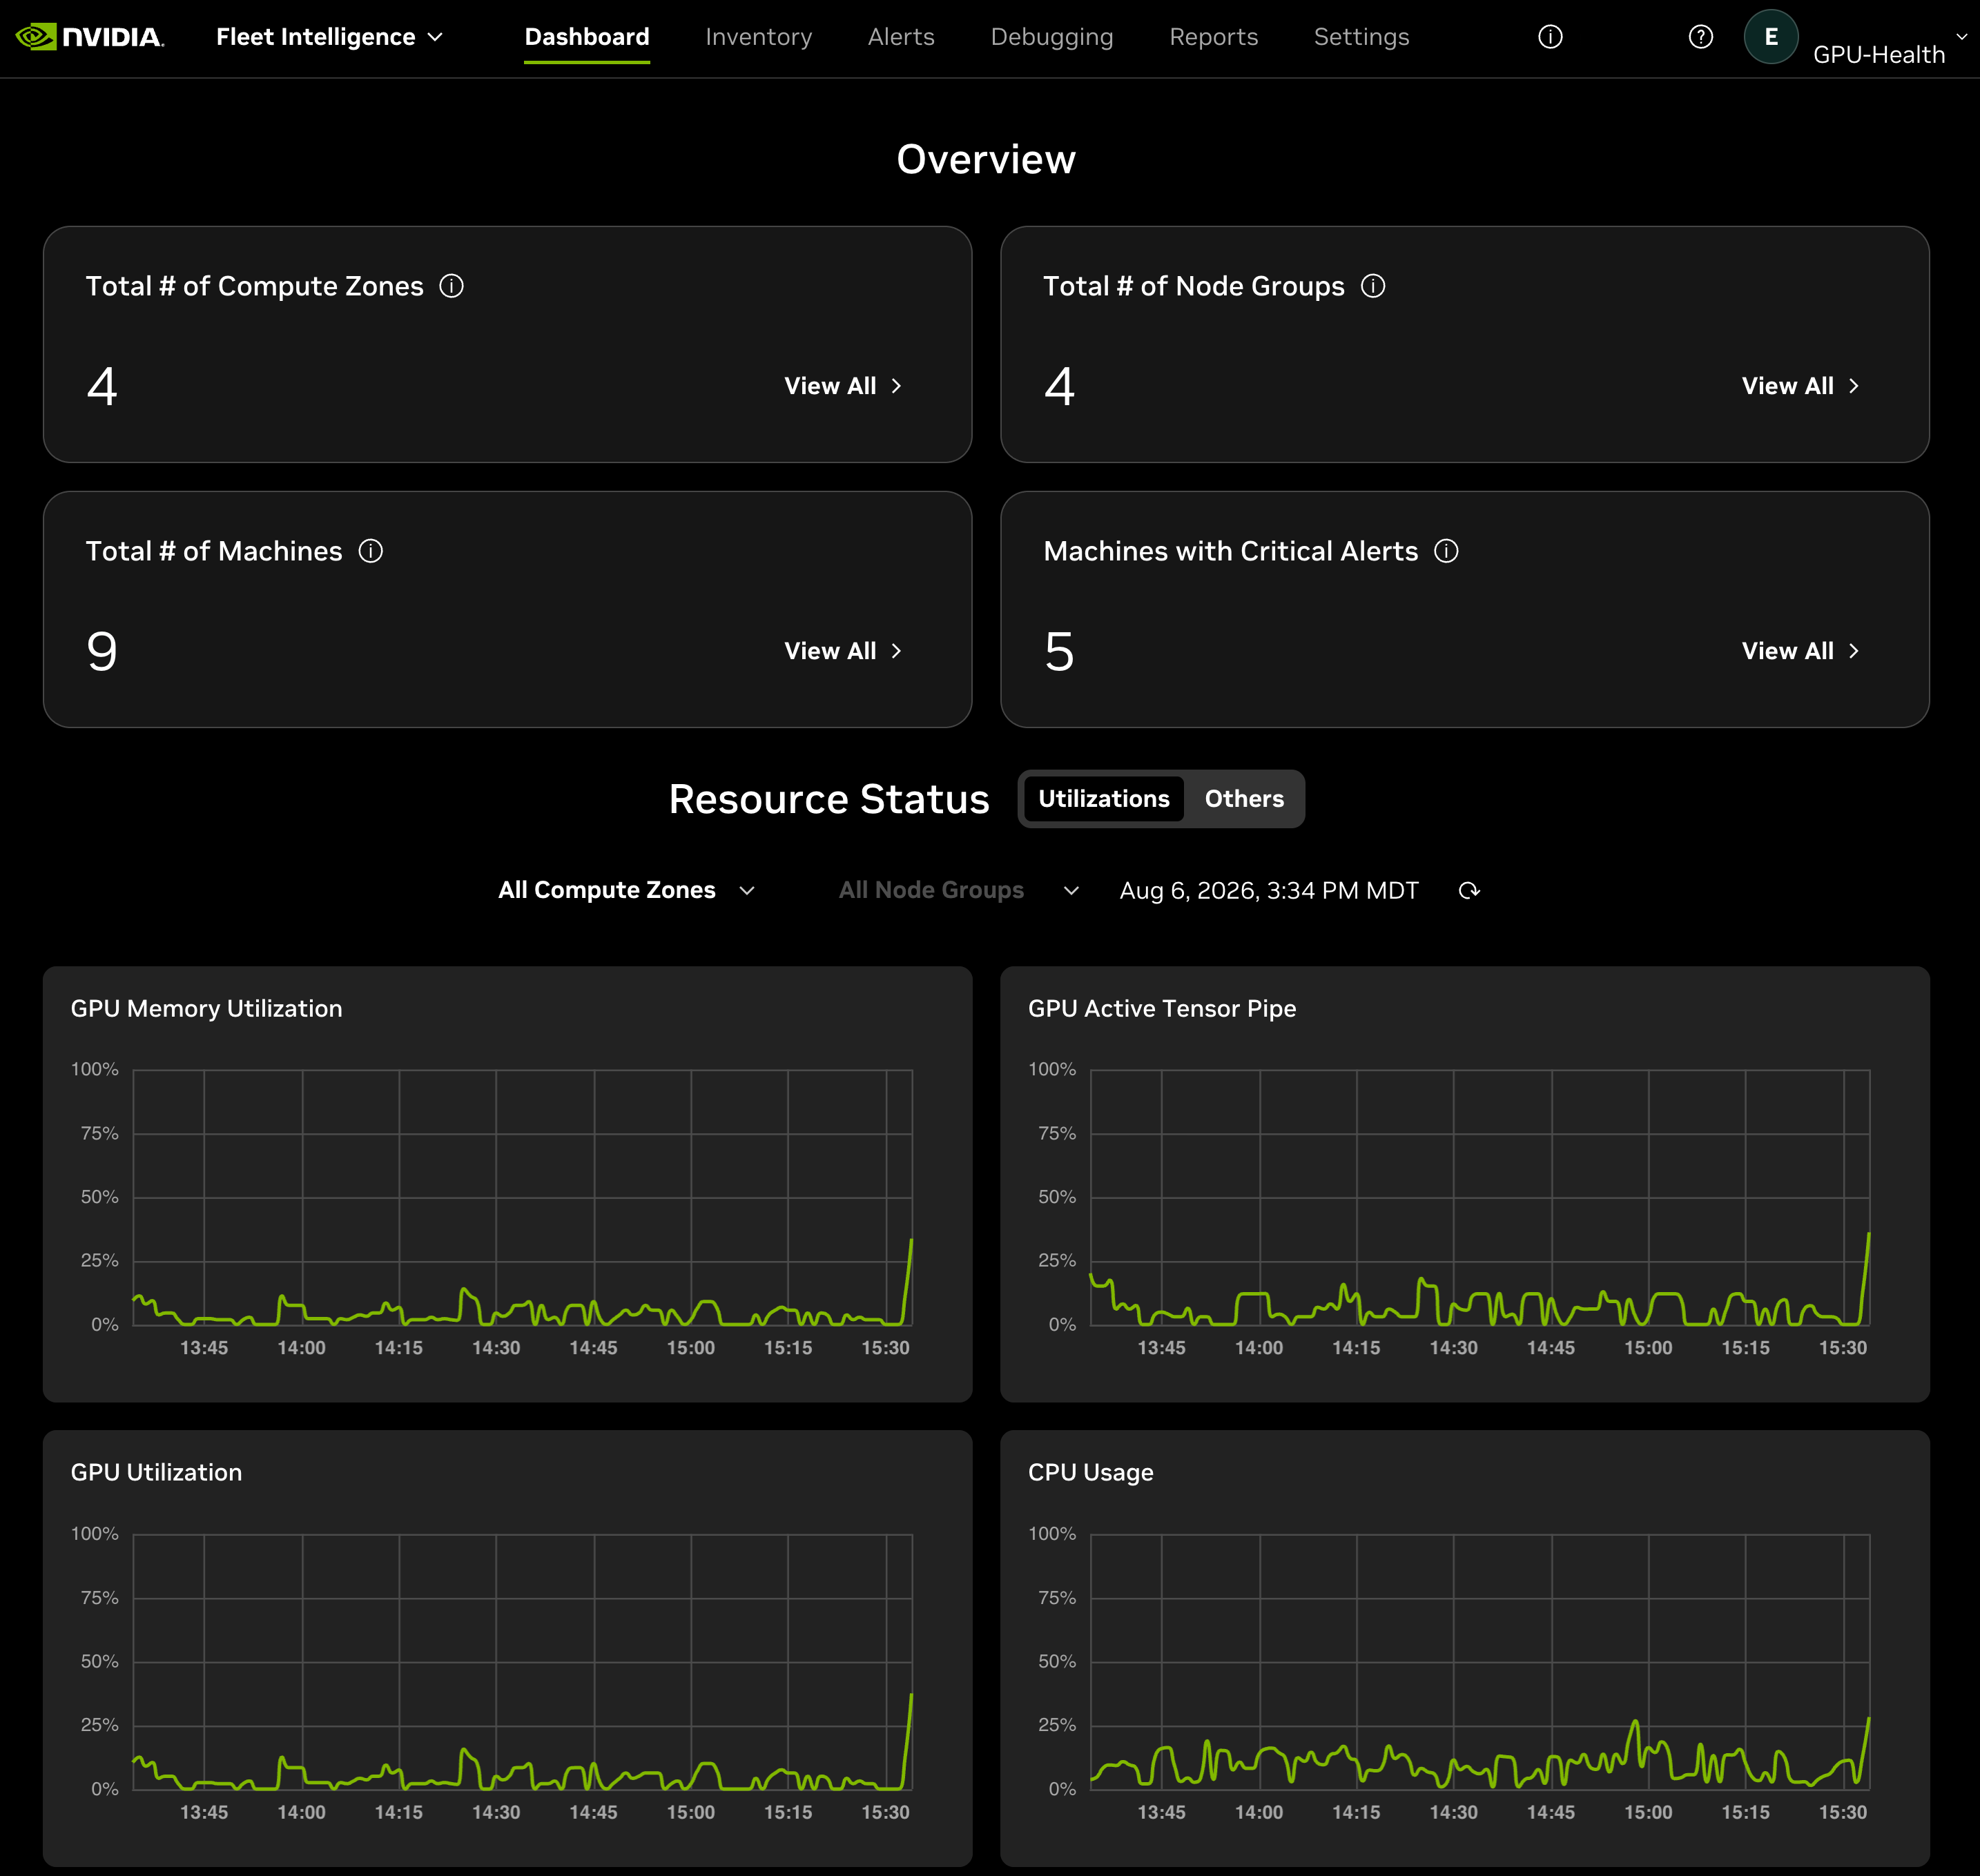
The main panel provides an inventory overview, alert summary, and a time-based overview of the usage and utilization of your entire GPU fleet. The main panel view can easily be switched to GPU power, speed, and memory usage by clicking the Others button in the Resource Status section.
Selecting the View All button in the All Compute Zones, All Node Groups, or All Total Machines panels opens the corresponding pages in the Inventory tab. See the Inventory section of this guide for details.
The Total # of Alerts panel View All button and the Alerts button in the header open a quick summary of all active alerts in your GPU fleet. Alerts are grouped by nodes and can be expanded to show the type of alert for each host.