Debugging - Detailed Analysis
Debugging - Detailed Analysis
Debugging - Detailed Analysis
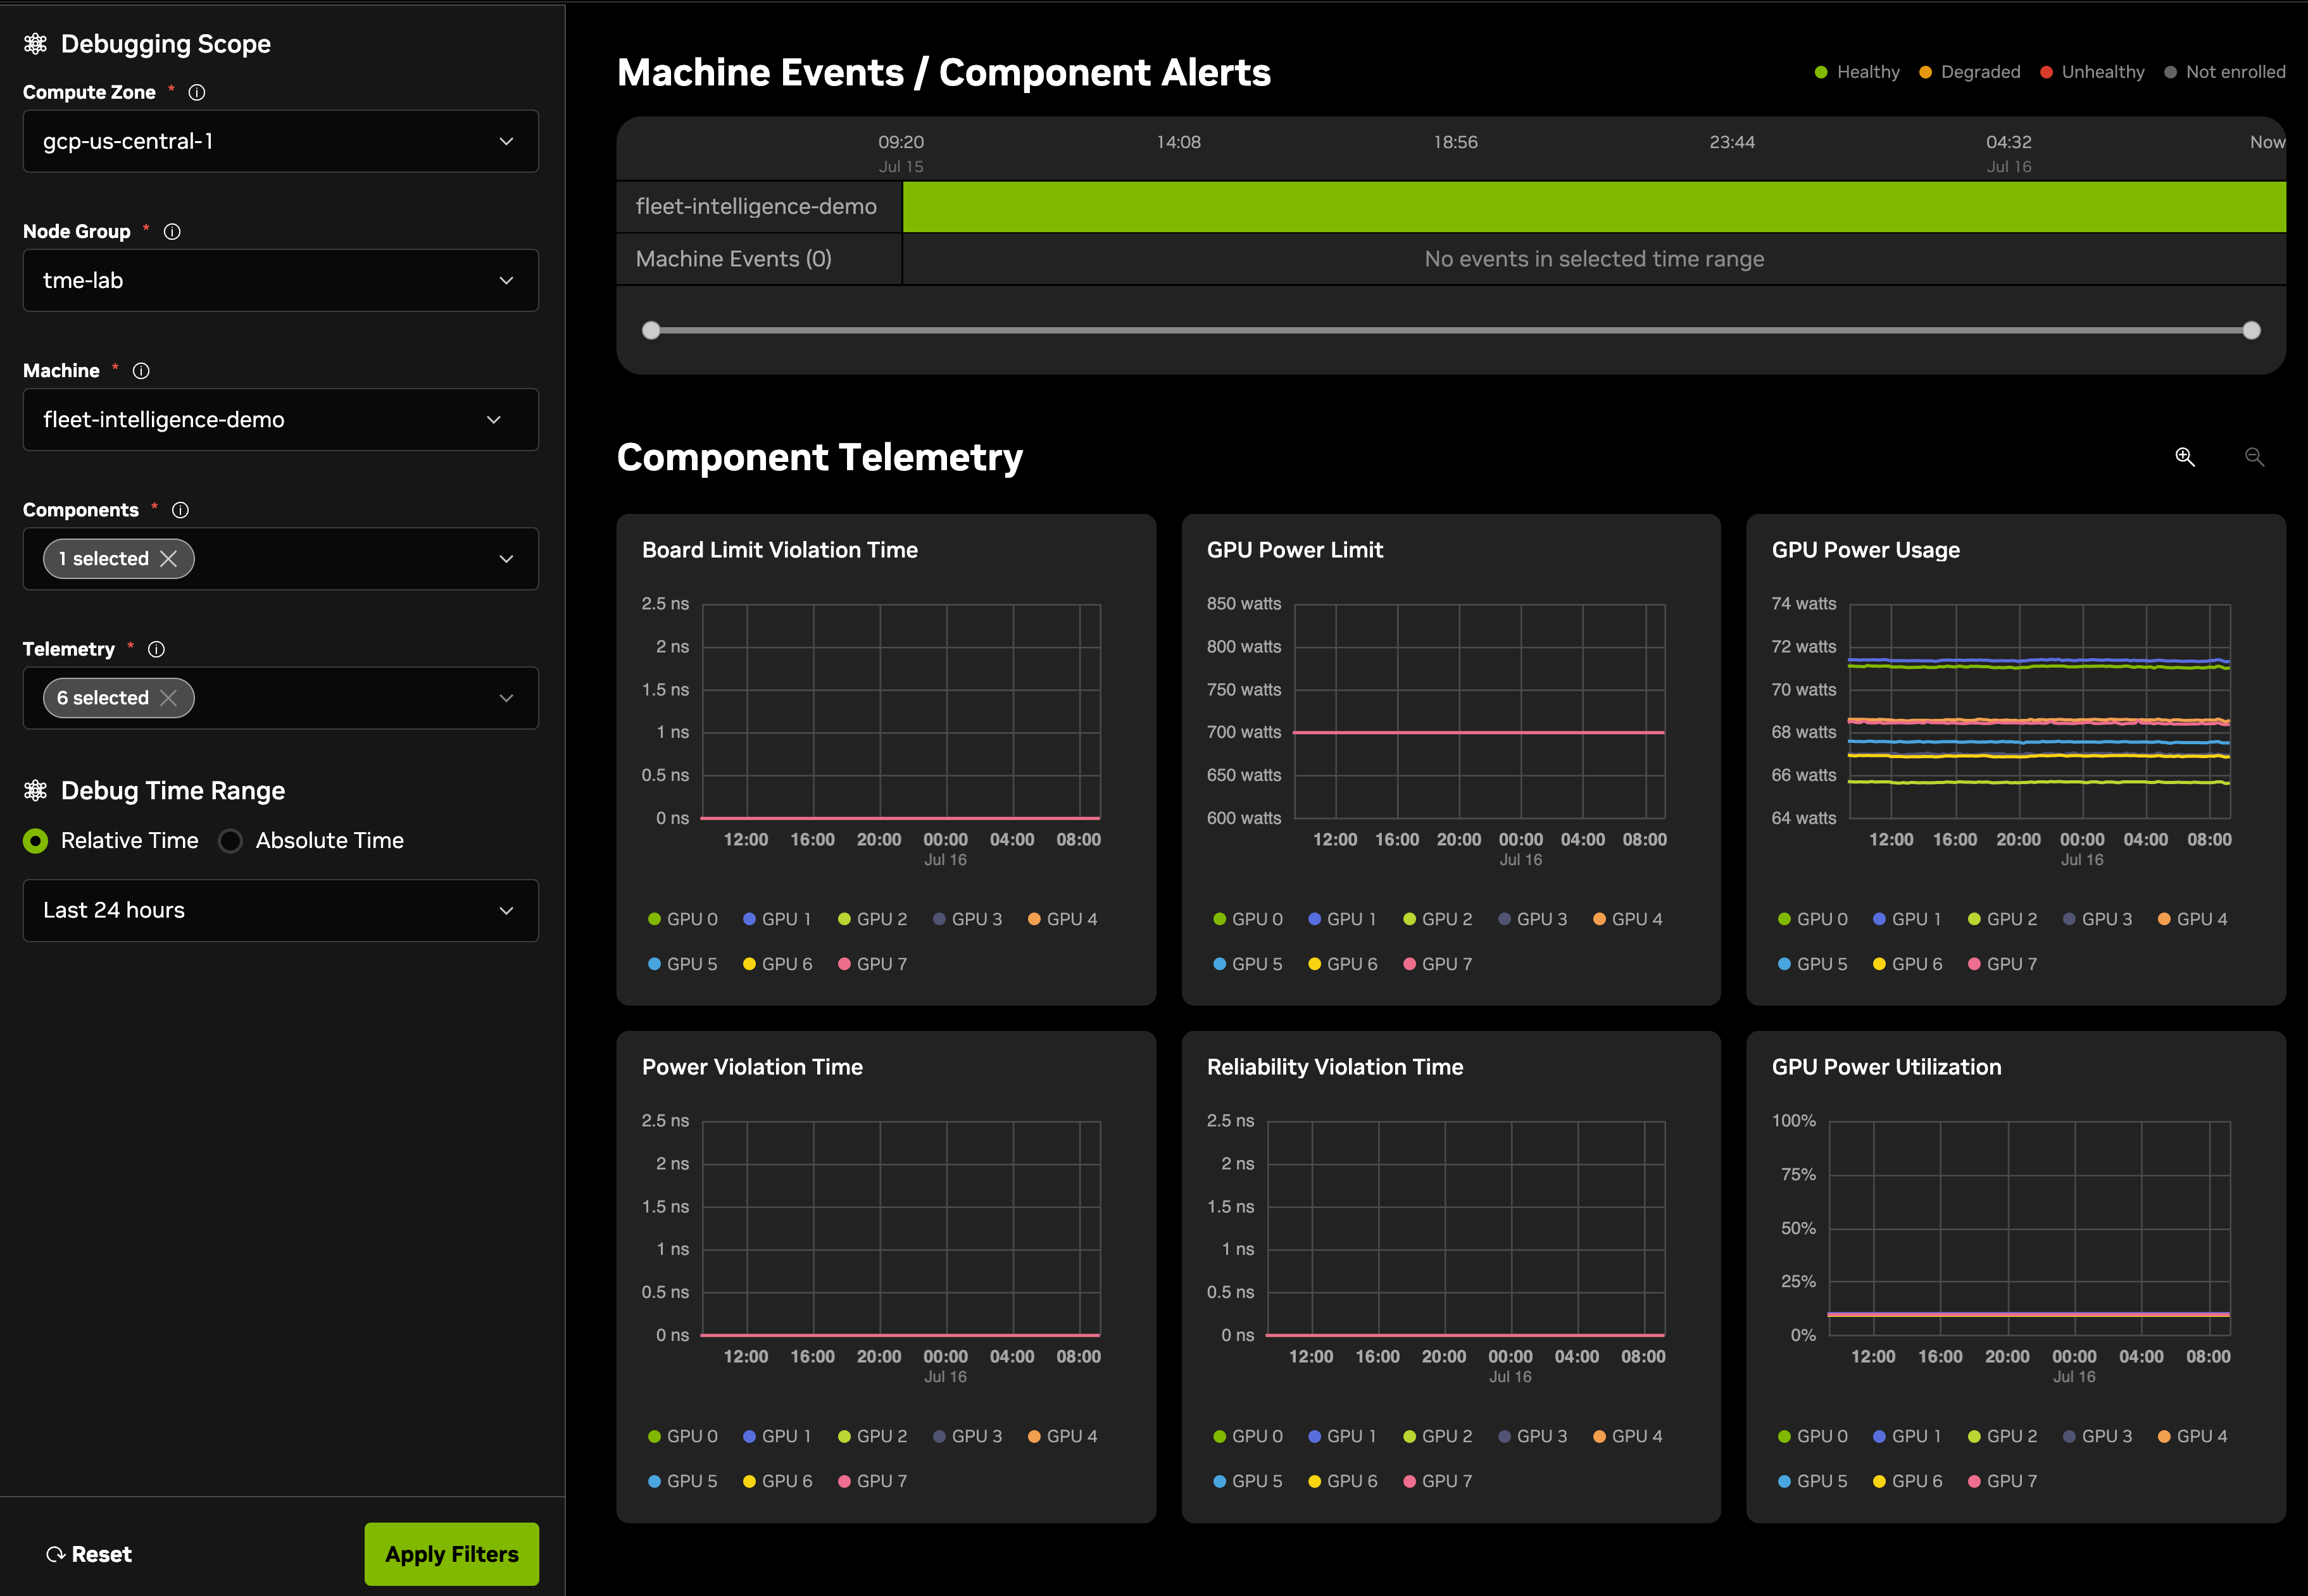
In the Debugging tab, use the Debugging Scope control (filter) on the left to choose a single node for detailed telemetry. You must also select a telemetry component group and a time range. Within that group you can select multiple metrics to show on one screen.