Inventory
Inventory
Under the Inventory tab, you see the three views and an Add New Node button. Start by adding a node; a new window opens with the installation wizard.
The wizard walks you through downloading the .deb or
.rpm package from the Fleet Intelligence Agent GitHub page, or
through instructions for a Helm chart installation on Kubernetes.
Select the installation method and the commands to install the agent for your selected method will be presented (for example, Ubuntu and Red Hat derivatives), including adding the CUDA repository to your system for the DCGM installation if needed. If the NVIDIA Data Center GPU Manager (DCGM) repository is added, the Fleet Intelligence agent installation will include it as a dependency.
In step 3, follow the link to the Fleet Intelligence enrollment token management page. Create a new token or reuse an existing, unexpired token. If you generate a new token, choose the validity period and click Next. The token is shown for you to copy.
Enrollment tokens are shown only once. Copy and store them securely before exiting the wizard.
Lastly, run the command shown under Enable Backend Communication to enroll the agent with the Fleet Intelligence service. Be sure to pass the compute-zone and node-group to the agent, as these will be used to group the node in the Fleet Intelligence service.
As of version 1.4.2 of the Fleet Intelligence service, compute-zone and node-group are passed from the agent and may no longer be assigned in the Fleet Intelligence service user interface.
Once the agent initializes, it should take about one to five minutes for the node information to appear in the Inventory -> Machine View list. The Compute Zones and Node Groups will appear as passed from the agent or Unassigned if not passed from the agent.
Machine Details
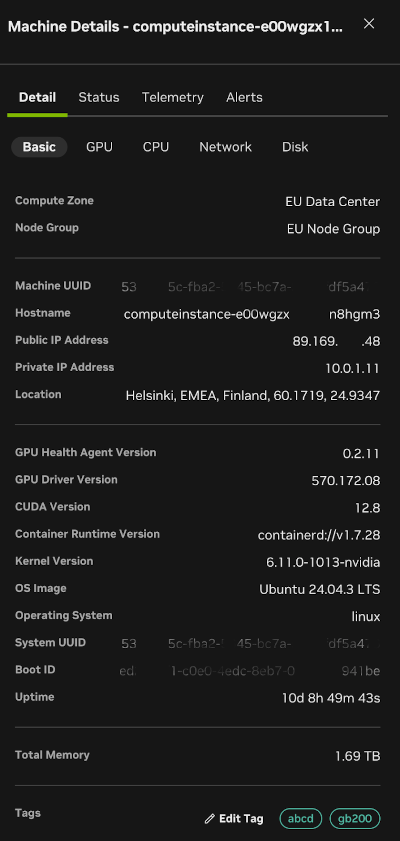
In any of the inventory panels, when you click a machine’s host name, a side panel opens on the right with details about the state of the machine. There are four tabs on this panel. The Detail tab presents metadata about the machine, including the Fleet Intelligence agent, GPU driver, CUDA, kernel, and OS versions. Sub-tabs of the Detail tab (not shown) provide collected metadata for GPU, CPU, network, and disk.
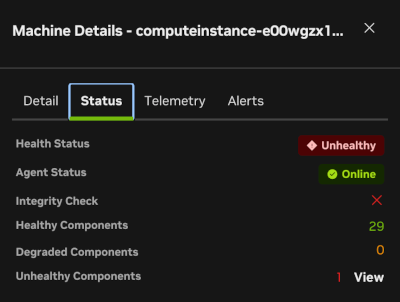
The Status tab summarizes major component status, includes the GPU integrity check, and shows overall node status.
The third tab, Telemetry, shows graphs of the collected telemetry for utilization, temperature, and power consumption for major components such as CPU, GPU, memory, and disk.
The last tab, Alerts, shows the current alerts that cause the node to be marked as “Unhealthy”. If the node is healthy, there are no critical alerts. There can still be active alerts for non-critical issues such as low disk space, low memory, and security alerts.
Alerts can have two or three levels of detail. Select the
 menu
next to an alert to mute events for the whole fleet or to create
a notification rule for email, a Slack channel, or a
webhook. See the Alert Configuration section for more details.
menu
next to an alert to mute events for the whole fleet or to create
a notification rule for email, a Slack channel, or a
webhook. See the Alert Configuration section for more details.
The machine Alerts panel can also use “Historical Alerts” mode, which shows alerts that occurred in the past but have since been resolved.
Events/Alerts
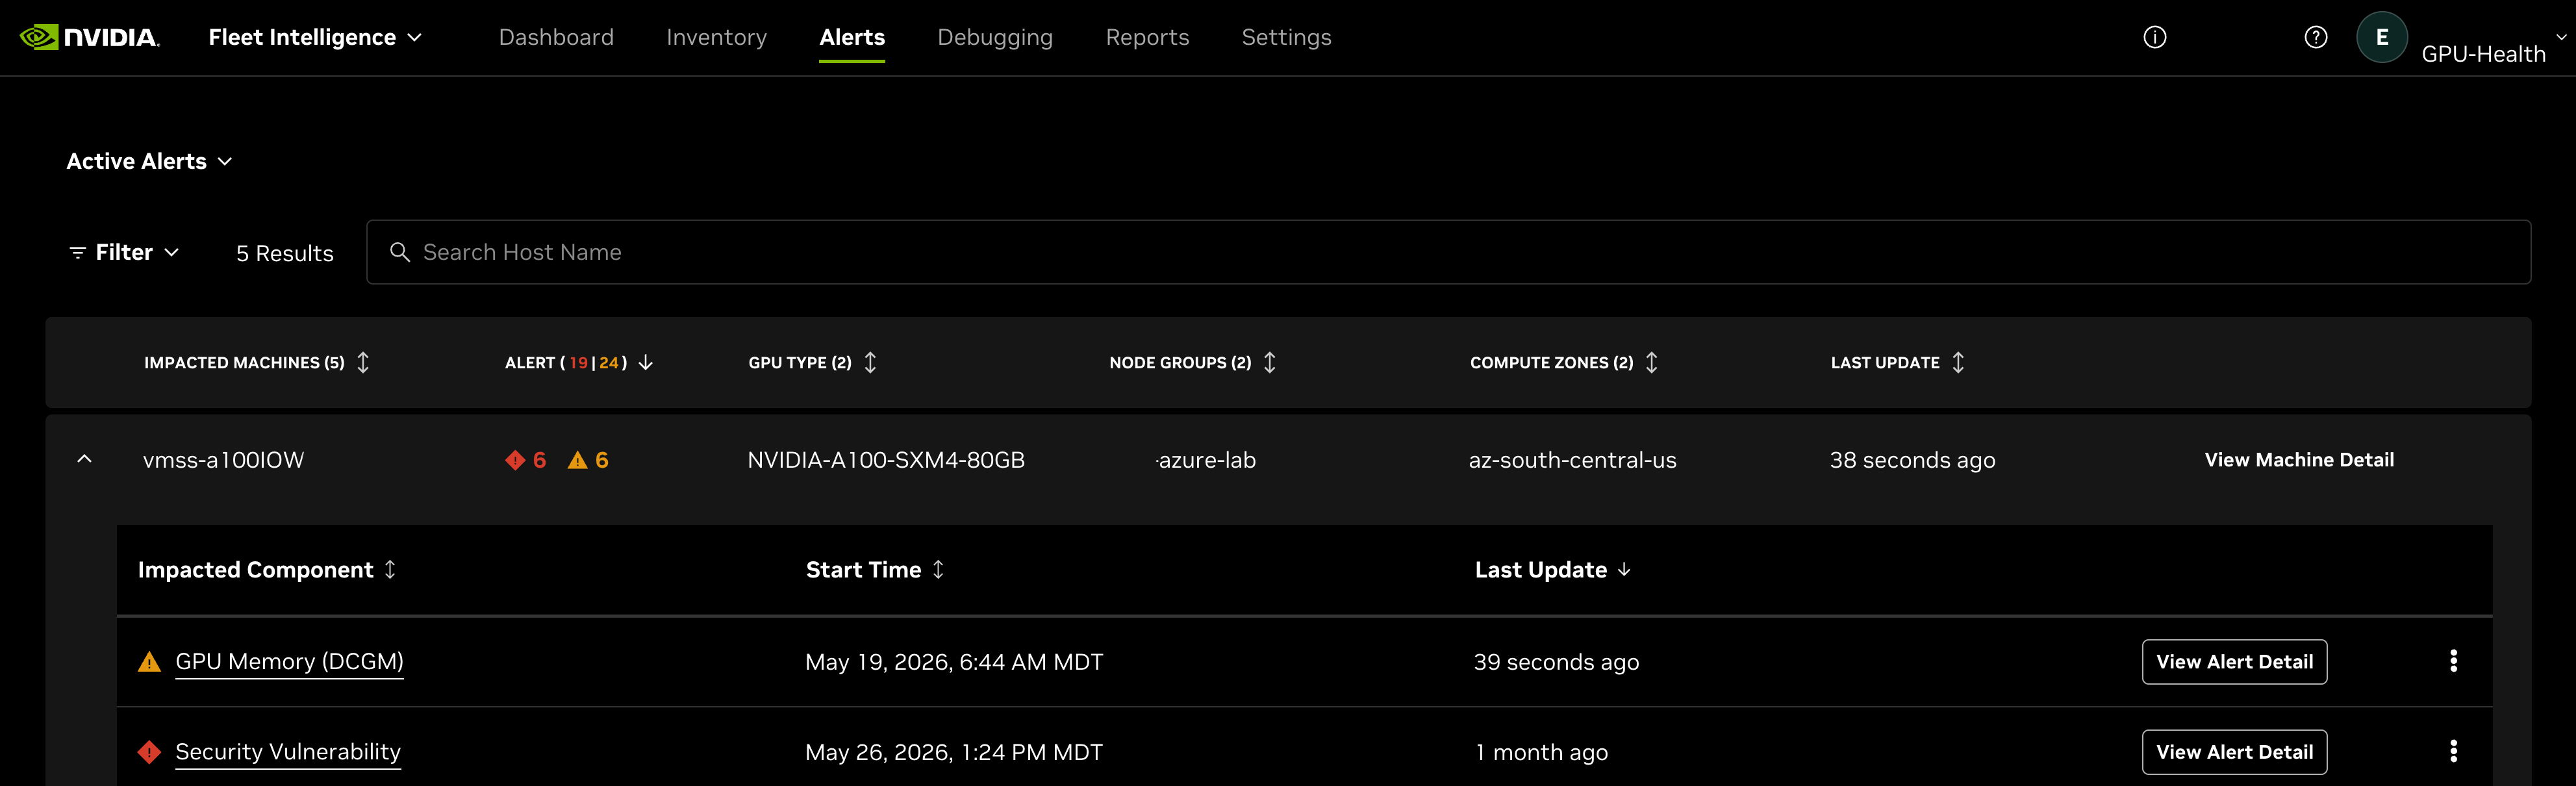
For a fleet-wide view of alert and event status, in the upper main menu bar, click Alerts. An Alerts screen is presented, unlike the machine-specific panel, it lists alerts for all machines in the fleet. Each alert has multiple levels you can drill into to see individual alerts and each reported instance.
 button.
On an individual alert select
the
button.
On an individual alert select
the  button
to drill into details on the alert itself. Select
the menu
next to an alert to mute that type of alert for the whole fleet or to create
a notification rule for email, a Slack channel, or a webhook.
See the Alert Configuration section for more details.
button
to drill into details on the alert itself. Select
the menu
next to an alert to mute that type of alert for the whole fleet or to create
a notification rule for email, a Slack channel, or a webhook.
See the Alert Configuration section for more details.The Alerts panel can also use “Historical Alerts” mode, which shows alerts that occurred in the past but have since been resolved.

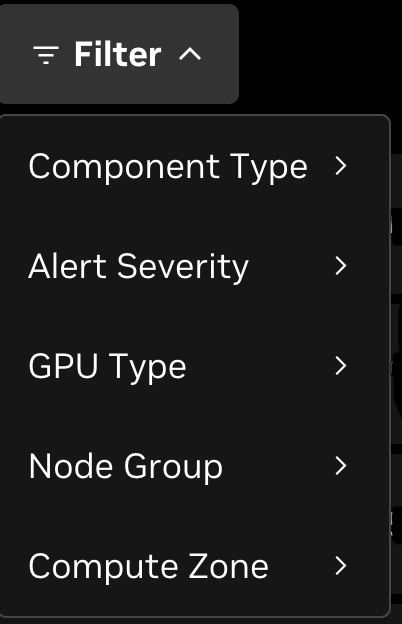
The Alerts page has the ability to search by hostname or filter by various properties in the filter menu.