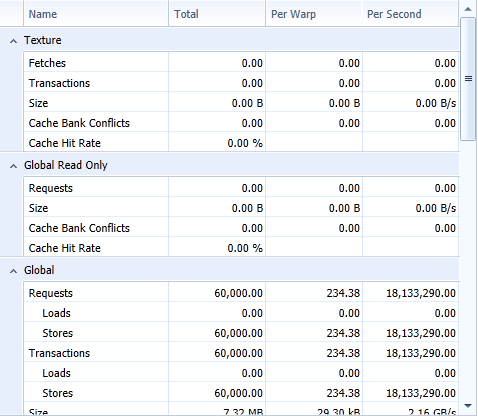
You are here: Developer Tools > Desktop Developer Tools > NVIDIA Nsight Visual Studio Edition > Memory Statistics

Overview

Nsight provides a series of experiments focused at the usage of the memory sub-system during kernel execution. Each individual experiment covers a particular area of the Memory Hierarchy defined by the CUDA programming model:

These memory experiments can be collected independently of each other; to avoid unnecessary profile overhead skip collecting memory experiments that cover an area of the memory hierarchy that is not used by the kernel. For each executed experiment a separate output tab is generated on the report page; in addition the results of a memory experiment are also used as input to the Overview tab. This overview provides a summary of the complete memory hierarchy with high-level performance metrics. The remainder of the document describes the Overview tab in more detail; for further information on an individual memory experiment follow the links above.

Overview Tab

Chart

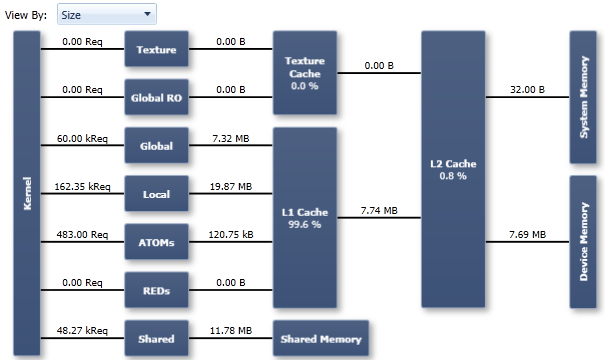
Shows a summary view of the memory hierarchy of the CUDA programming model. Key metrics are reported for the areas that were covered by memory experiments during the data collection; if an area was not covered or the target device does not support a memory data path, the corresponding areas in the chart are greyed out. Useful to get a quick overview of the utilization of the memory sub-system and guide further analysis using the other memory tabs.

The nodes in the diagram depict either a logical memory space (global, local, shared, ...) or an actual hardware unit on the chip (caches, shared memory, device memory). For the various caches the reported percentage number states the cache hit rate; that is the ratio of requests that could be served with data locally available to the cache over all requests made. Requests that hit data in the cache are served much faster than requests that miss the cache; missed data needs to be fetched from another layer of the memory hierarchy.

Links between the nodes in the diagram depict the data paths between the SMs to the memory spaces into the memory system. Depending on the configuration, different metrics are shown per data path; including the amount of memory transferred or the achieved memory throughput.

Options

View By Enables switching the reported metrics per data path. The available options include:

  • Size: Reported metrics cover both, read and write operations. The data paths from the SMs to the memory spaces report the total amount of memory requests made; this equals the number of executed memory instructions that triggered a transfer to the corresponding memory space. All other data paths report the total amount of transferred memory in bytes. Note that some caches may only cover read operations; therefore, dividing the combined read/write traffic from before and after a cache does not necessarily match the actual cache hit rate.
  • Bandwidth: Reported metrics cover both, read and write operations. Puts the metrics described in the previous section in relation to the kernel execution time. The reported throughput numbers are useful to compare to the architectural peak values.
  • Load Size: Reports the same metrics as the first option, but for load operations only. Data paths that by definition do not allow for load traffic do not report a value.
  • Store Size: Reports the same metrics as the first option, but for store operations only. Data paths that by definition do not allow for store traffic do not report a value.

Table

Lists the key performance metrics for each covered memory space. Repeats all information shown in the chart as raw values; and also offers some addition metrics, such as the replay overhead per memory space. The replay overhead is defined as:

(Transactions - Requests) / Instruction_Issued

The number of requests equals the number of executed memory instructions. Depending on the memory access pattern and accessed memory space, a single request may require multiple transactions to fulfill a request for all active threads of a warp. Each additional memory transaction forces the memory instruction to be issued again. The more transactions are needed, the more often the instruction needs to be replayed; ultimately hindering fast forward progress. See the Instruction Statistics experiment for more details.

Columns

Total Reports the values as total aggregates over the course of the kernel execution.

Per Warp Reports the applicable metrics per warp. Useful to quickly compare against estimates derived during the kernel development.

Per Second Reports the applicable metrics in relation to the kernel execution duration. For rows referring to the amount of transferred bytes the value of this column results in the achieved memory throughput. The architectural peak memory bandwidth to device memory for the target device is given on the GPU Devices report page.


of

NVIDIA GameWorks Documentation Rev. 1.0.150630 ©2015. NVIDIA Corporation. All Rights Reserved.