Important
You are viewing the NeMo 2.0 documentation. This release introduces significant changes to the API and a new library, NeMo Run. We are currently porting all features from NeMo 1.0 to 2.0. For documentation on previous versions or features not yet available in 2.0, please refer to the NeMo 24.07 documentation.
Performance#
This section presents training and inference performance benchmarks conducted on NVIDIA DGX SuperPODs. Image quality is evaluated using FID-CLIP curves, while training latency is quantified across varying node configurations. Inference performance is compared between framework and TensorRT implementations under different batch sizes.
Training Quality Results#
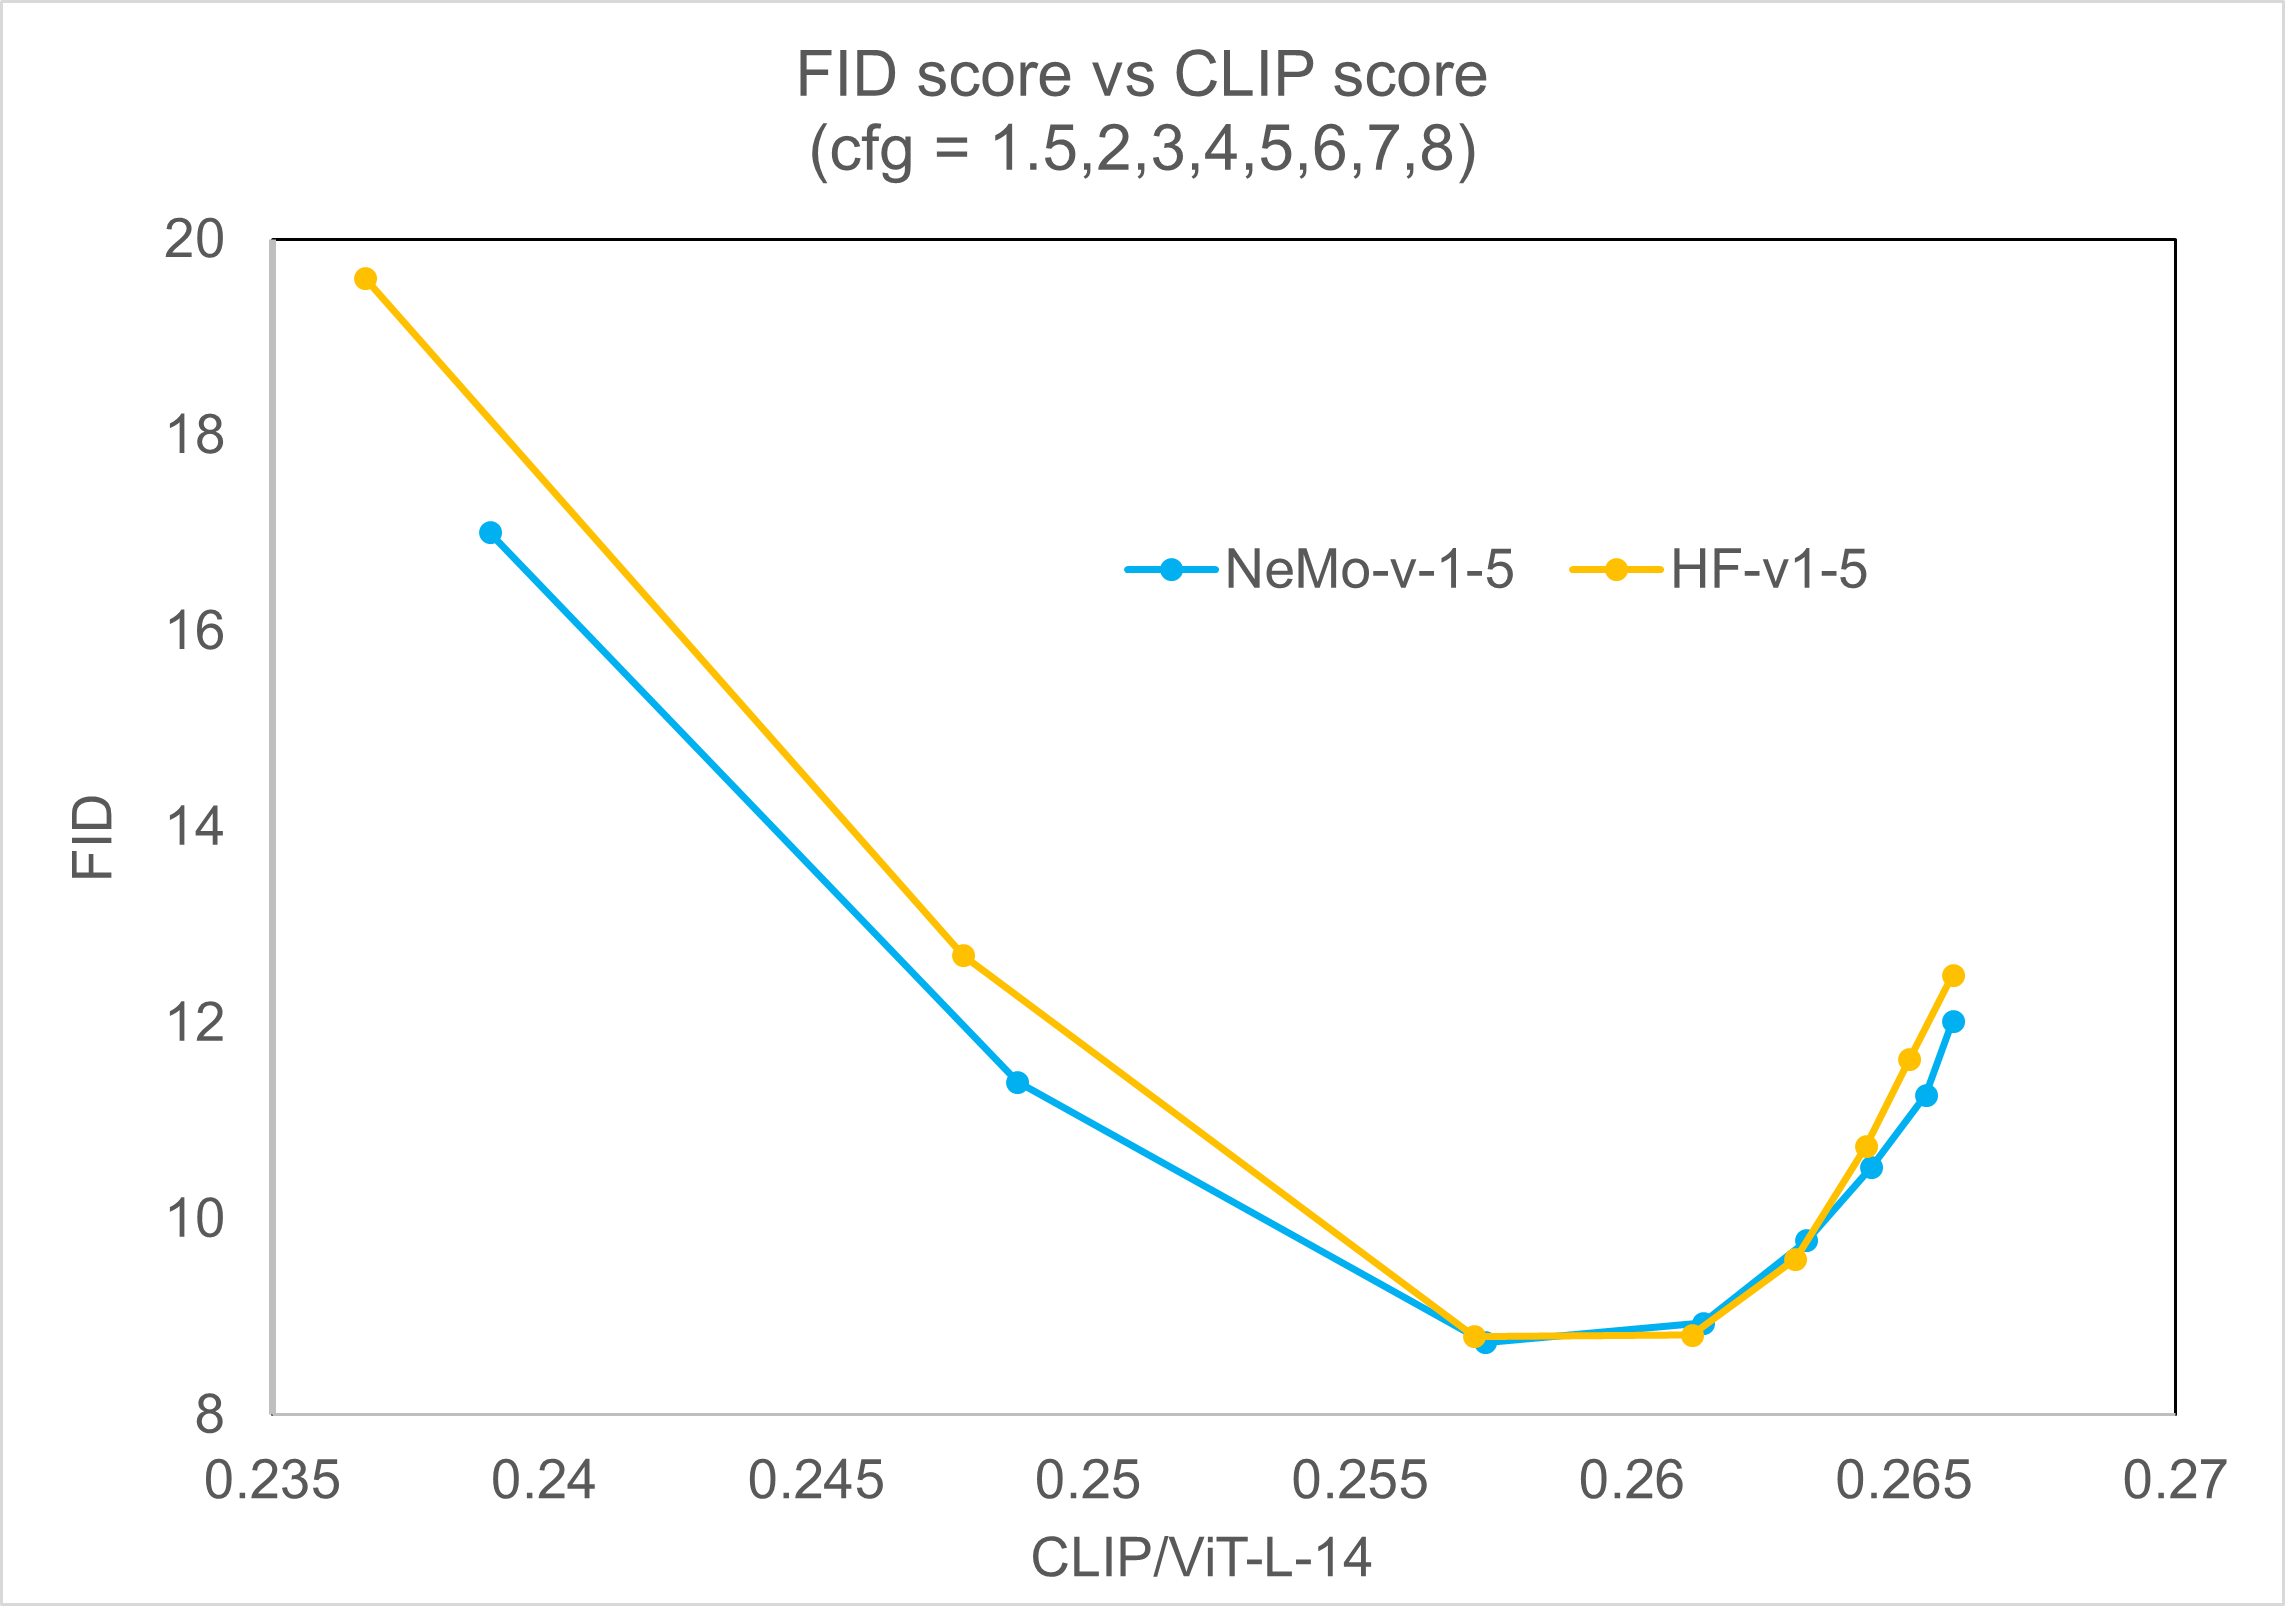
In this section, we evaluate the Stable Diffusion model using the FID-CLIP curve and compare it to other open-source checkpoints at the same scale for an equivalent sample.
Fréchet Inception Distance (FID) is a metric used to evaluate the quality of generated images in machine learning. It measures the distance between the real image distribution and the distribution of generated images using the features extracted by a pre-trained inception model.
The VIT-L/14 version of the CLIP model was utilized to assess the relevance between image prompts and generated images.
The evaluation was conducted using different classifier-free guidance scales, specifically 1.5, 2.0, 3.0, 4.0, 5.0, 6.0, 7.0, and 8.0. The evaluation process involved generating 30,000 images from randomly selected prompts from the COCO2014 validation dataset using 50 PLMS steps. The results were evaluated at a resolution of 256x256.
We have adapted the training recipe from the Stable Diffusion Model Cards posted on Hugging Face with some modifications.
Our multimodal dataset is derived from Common Crawl and uses custom filtering techniques.
Below, we present the outcomes obtained from our own checkpoint following Stable Diffusion Training, which can be compared to those of the open-source Stable Diffusion 1.5.
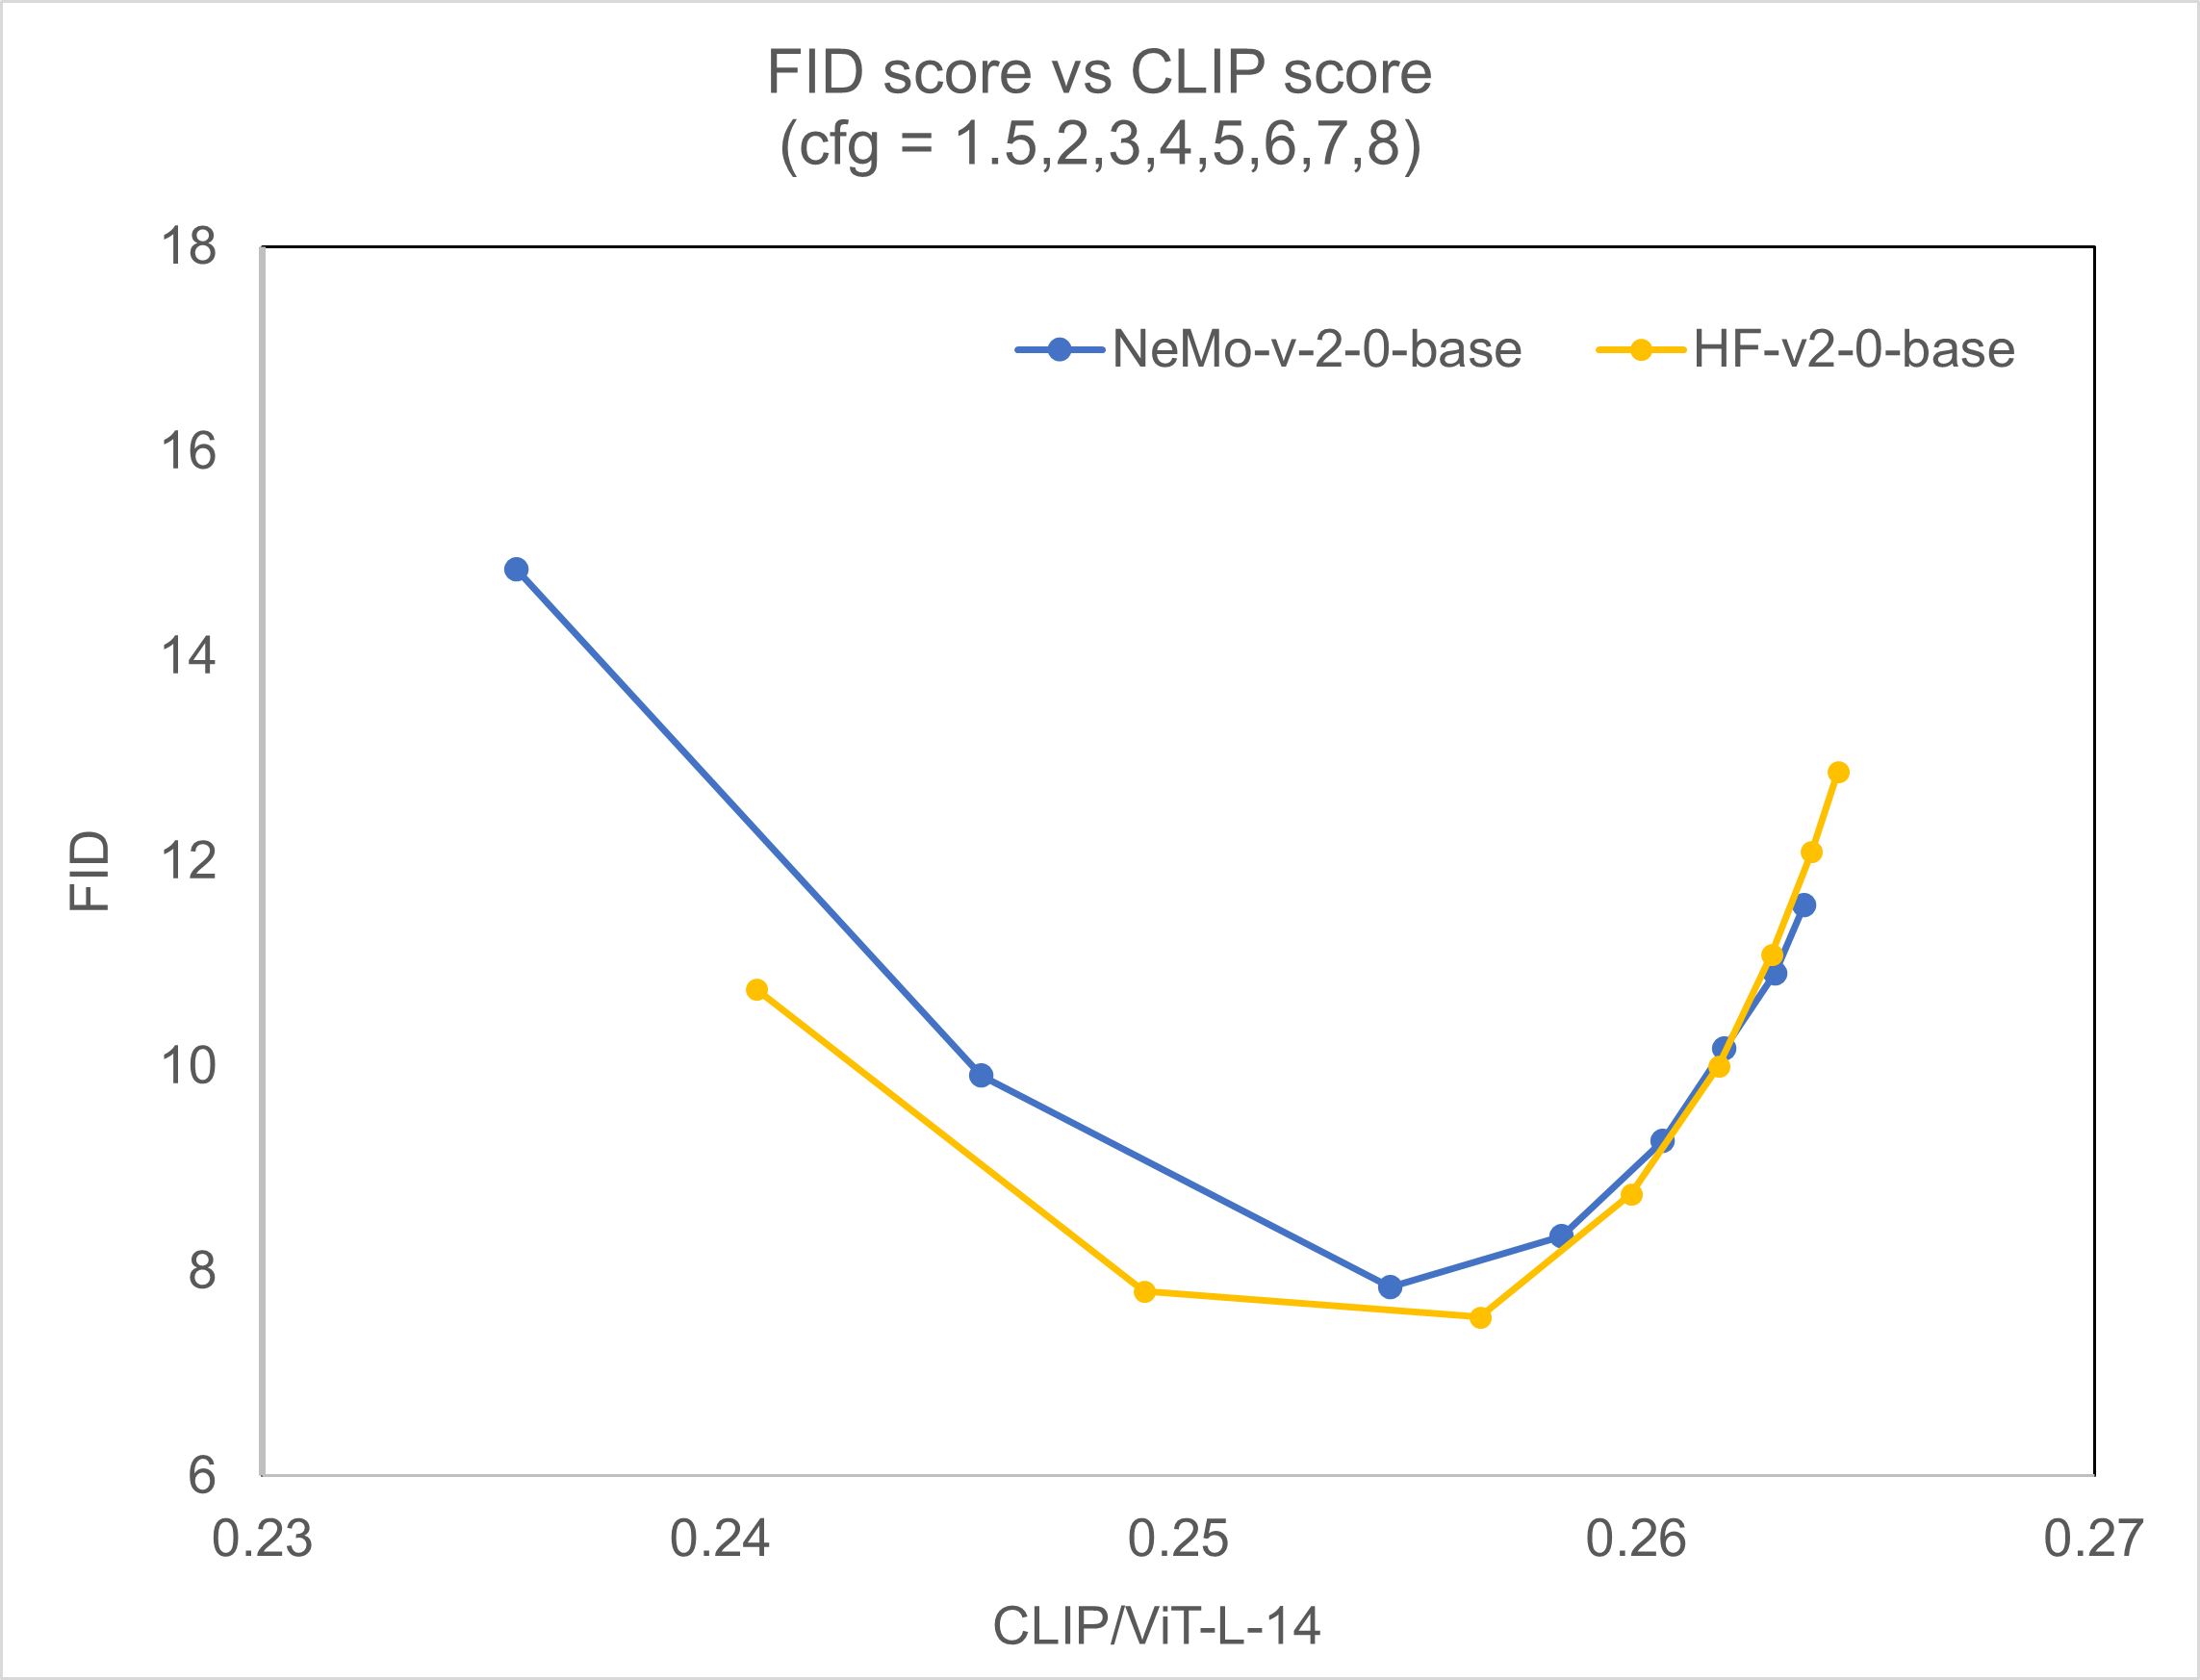
To evaluate the Stable Diffusion 2.0 base, we used the same configuration. The results presented below allow for a comparison between our own checkpoint and the open-source Stable Diffusion 2.0 base.
Training Performance Results#
We measured the throughput of training on the Stable Diffusion models using different numbers of DGX A100 nodes and DGX H100 nodes. We achieved near-linear scaling on both platforms.
We are comparing the out-of-box performance on DGX H100 machines with the same configuration from DGX A100 machines. This comparison is an apple-to-apple assessment, ensuring that we evaluate the relative performance of the two machine types under equivalent conditions and configurations.
The tables and charts below show the performance results for SD v2.
NVIDIA DGX SuperPODs (64 x 8 x A100 80GB for Stable Diffusion Res=512 model)
1 |
2 |
4 |
8 |
16 |
32 |
64 |
||
|---|---|---|---|---|---|---|---|---|
Samples per Second |
268.31 |
540.14 |
1081.31 |
2138.23 |
4208.80 |
8144.76 |
15917.61 |
|
Stable Diffusion Res=512 |
Perfect Linear Scaling (Samples) |
268.31 |
536.63 |
1073.26 |
2146.53 |
4293.05 |
8586.10 |
17172.20 |
Speedup |
1x |
2.01x |
4.03x |
7.97x |
15.69x |
30.36x |
59.32x |

NVIDIA DGX SuperPODs (64 x 8 x H100 80GB for Stable Diffusion Res=512 model)
1 |
2 |
4 |
8 |
16 |
32 |
64 |
||
|---|---|---|---|---|---|---|---|---|
Samples per Second |
511.90 |
997.86 |
2019.72 |
3856.87 |
7177.15 |
13326.83 |
25952.80 |
|
Stable Diffusion Res=512 |
Perfect Linear Scaling (Samples) |
511.90 |
1023.80 |
2047.59 |
4095.18 |
8190.36 |
16380.72 |
32761.45 |
Speedup |
1x |
1.95x |
3.95x |
7.53x |
14.02x |
26.03x |
50.7x |
NVIDIA DGX SuperPODs (64 x 8 x H100 80GB for SDXL Res=512 model)
1 |
2 |
4 |
8 |
16 |
32 |
64 |
||
|---|---|---|---|---|---|---|---|---|
Samples per Second |
327.37 |
638.40 |
1251.83 |
2392.52 |
3190.03 |
6460.57 |
9330.30 |
|
Stable Diffusion Res=512 |
Perfect Linear Scaling (Samples) |
327.37 |
654.74 |
1309.48 |
2618.96 |
5237.92 |
10475.84 |
20951.68 |
Speedup |
1x |
1.95x |
3.82x |
7.31x |
9.74x |
19.73x |
28.5x |

DGX A100 vs. DGX H100: A Comparative Analysis of Stable Diffusion Training
Model |
Nodes |
Global Batch |
Micro Batch |
Precision |
Global Batch/Sec (A100) |
Global Batch/Sec (H100) |
Speedup (x) |
|---|---|---|---|---|---|---|---|
Stable Diffusion (Res=512) |
4 |
1024 |
32 |
amp fp16 |
1.056 |
1.972 |
1.9 |

Inference Performance Results#
Latency times are started directly before the text encoding (CLIP) and stopped directly after the output image decoding (VAE). For NeMo Framework, we use Torch Automated Mixed Precision (AMP) for FP16 computation. For TensorRT (TRT), we export the various models with FP16 acceleration. We use the optimized TRT engine setup from the deployment directory to obtain the numbers in the same environment as NeMo Framework.
GPU: NVIDIA DGX A100 (1x A100 80 GB) Batch Size: Synonymous with ``num_images_per_prompt``
Model |
Batch Size |
Sampler |
Inference Steps |
TRT FP 16 Latency (s) |
FW FP 16 (AMP) Latency (s) |
TRT vs FW Speedup (x) |
Stable Diffusion (Res=512) |
1 |
PLMS |
50 |
0.9 |
3.3 |
3.7 |
Stable Diffusion (Res=512) |
2 |
PLMS |
50 |
1.7 |
5.2 |
3.1 |
Stable Diffusion (Res=512) |
4 |
PLMS |
50 |
2.9 |
9.2 |
3.2 |
The following table shows SD v2.0 performance. GPU: NVIDIA DGX A100 (1x A100 80 GB) Batch Size: Synonymous with ``num_images_per_prompt``
Model |
Batch Size |
Sampler |
Inference Steps |
TRT FP 16 Latency (s) |
FW FP 16 (AMP) Latency (s) |
TRT vs FW Speedup (x) |
Stable Diffusion (Res=512) |
1 |
PLMS |
50 |
0.9 |
3.2 |
3.5 |
Stable Diffusion (Res=512) |
2 |
PLMS |
50 |
1.6 |
5.0 |
3.2 |
Stable Diffusion (Res=512) |
4 |
PLMS |
50 |
2.7 |
8.5 |
3.1 |