

Infrastructure Scaling
We benchmarked Kumo Engine 1.0.0 on one AWS g6e.8xlarge with a single NVIDIA L40S GPU to understand how database structure and size affect a complete training and prediction workflow. We measured source staging, graph creation, training-table generation, fit, and prediction while varying table count, relationship layout, row volume, and feature width.
Adding tables increased runtime across the measured schema families, but the relationships between those tables changed how much work followed. At 64 tables, the chain took 335.2 seconds across stages, compared with 477.4 seconds for the star and 498.9 seconds for the mapping schema. Most of that difference was in fit. The examples below show how the same five tables can form each layout.
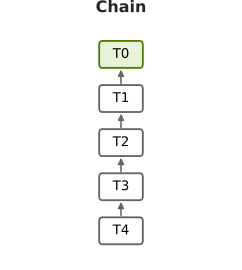
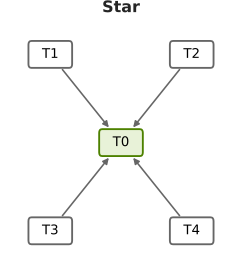
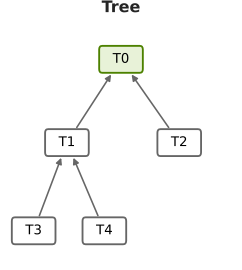
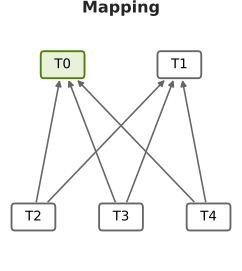
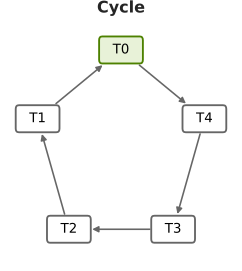
These five-table examples illustrate the relationship layouts. T0, shaded green, is the prediction entity. Each arrow points from a child’s foreign key to its parent’s primary key.
Row growth and feature growth affected different parts of the workflow. In the three-table row sweep, increasing the mapping table from 10 million to 100 million rows raised graph-build time from 29.7 to 83.0 seconds, while fit stayed near 116 to 118 seconds. At a fixed 10 million mapping rows, widening that table from 2 to 500 columns increased fit from 75.7 to 923.1 seconds.
For users planning work on a large database, these results suggest three priorities:
- Pilot the actual schema and prediction target. Preserve important relationships and mapping tables. Table count alone did not rank runtime.
- Plan preparation and model execution separately. More rows can add substantial staging and graph-build work even when the training budget stays fixed. Include case overhead in job-duration estimates.
- Review feature width and measure resource use. Wider tables increased both fit and prediction time. Evaluate which features the task needs, and measure system RAM and local scratch alongside compressed source bytes before sizing the full graph.
Timing measures and stages
All results on this page use g6e.8xlarge measurements. Main tables and plots show the first measured run of each workload. Case wall captures the elapsed workflow; stage sum adds its five timed operations.
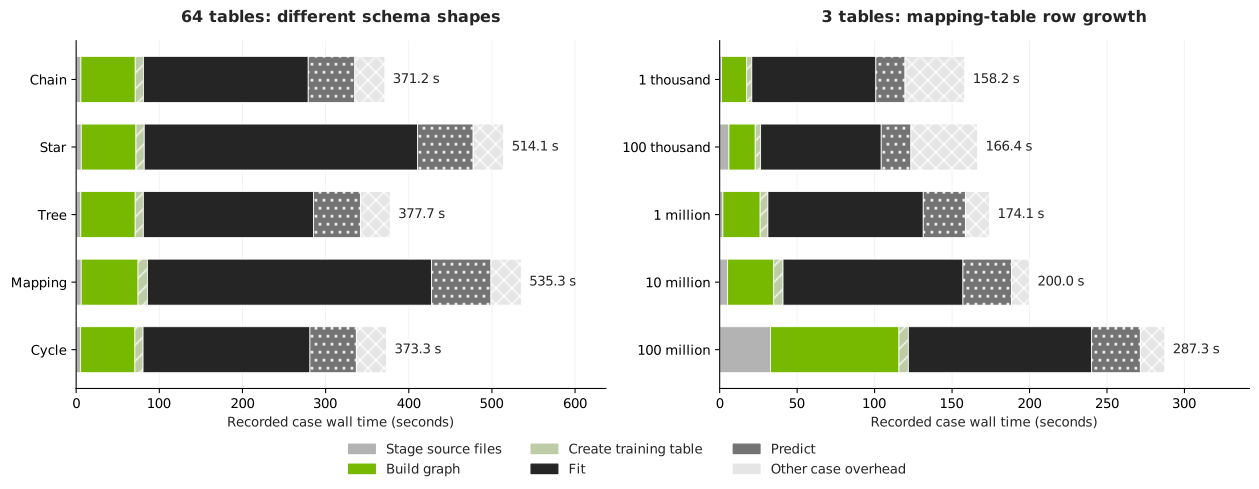
Each complete bar is case wall time. The pale hatched segment is case overhead outside the five stages.
The 64-table chain took 371.2 seconds of case wall time, including 335.2 seconds across stages and 36.1 seconds of other case overhead. The mapping schema took 535.3 seconds of case wall time and 498.9 seconds across stages.
Stage timings at 64 tables
Times are seconds, rounded independently to one decimal place. Displayed stages can therefore differ slightly from the displayed sum. Unrounded values are available in the raw run table and individual stage records.
Schema and table-count scaling
Each table in this experiment contains 100,000 rows and 32 columns. Adding tables therefore increases the source volume as well as changing the graph. The layouts shown above connect those tables in different ways.
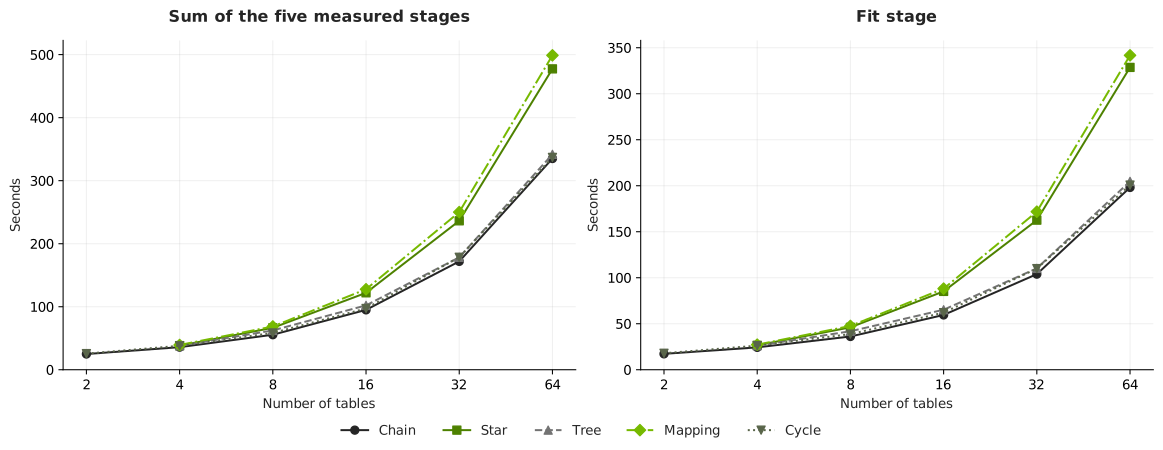
Lines connect measured workloads. The left panel shows stage sum; the right shows fit. Both use the same table-count axis.
The table reports stage sums for every measured schema and table count. The source column gives the chain’s total compressed Parquet size as a reference. Other schemas have similar source sizes; their exact values are in the downloads.
The two-table star and tree are equivalent to the two-table chain and were not run separately. The mapping experiment starts at four tables.
Chain
Each successive table links to the preceding table. Increasing from 2 to 64 tables raised stage sum from 25.0 to 335.2 seconds (13.4 times), while compressed source size grew 33.5 times. From 32 to 64 tables, stage sum grew from 172.0 to 335.2 seconds, or 1.95 times. Fit accounted for 198.1 seconds at 64 tables.
Star
Every child table links to the central prediction entity. At 64 tables, star and chain use the same source tables and 0.527 GB of Parquet, each with 63 declared relationships. Star’s stage sum was 42.4% longer than chain’s, while graph build was nearly unchanged at 65.8 versus 65.3 seconds.
Fit increased from 198.1 seconds for chain to 328.6 seconds for star, accounting for about 92% of the additional stage time. Within the star family, moving from 32 to 64 tables increased stage sum from 236.3 to 477.4 seconds, or 2.02 times.
Tree
Tables form a binary branching hierarchy. Stage sum grew from 37.9 seconds at four tables to 341.8 seconds at 64 tables. The 64-table tree uses the same source tables and relationship count as the chain and star. Its 204.7-second fit and 341.8-second stage sum stayed close to the chain’s 198.1 and 335.2 seconds.
Mapping
Each mapping table links to two entity/metadata parents. Stage sum grew from 39.3 seconds at four tables to 498.9 seconds at 64 tables. At 64 tables, the schema has 124 declared relationships, compared with 63 for the chain, and uses different table roles.
Its stage sum was 48.8% longer than the chain’s, with fit increasing from 198.1 to 341.7 seconds. From 32 to 64 tables, mapping stage sum grew from 250.1 to 498.9 seconds, or 1.99 times.
Cycle
A closing relationship connects the ends of a chain. Stage sum grew from 25.6 seconds at two tables to 336.9 seconds at 64 tables. At 64 tables, graph build took 65.2 seconds and fit took 200.7 seconds, close to the chain’s 65.3 and 198.1 seconds in this experiment.
Together, the matched chain, star, and tree results show why relationship layout belongs in a sizing pilot. Their source bytes and relationship counts match, yet their fit times differ. That is consistent with different sampling and model execution work around the prediction entity; the stage timings do not isolate the individual operations responsible inside fit.
Row-volume scaling
This experiment holds the schema at three tables. Two parent tables each contain 1 million rows and 32 columns. The mapping table also has 32 columns, and only its row count changes. Even the smallest case therefore contains more than 2 million total source rows.
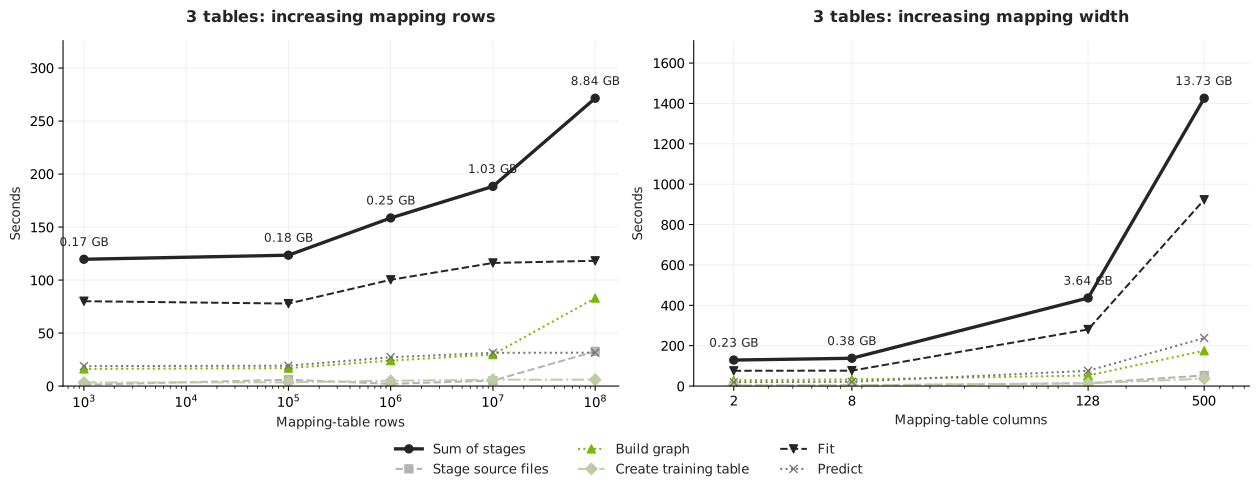
The left panel varies mapping rows with 32 columns. The right varies mapping columns with 10 million rows. Both contain three tables, and the y-axis scales differ.
From 1 million to 100 million mapping rows, total source size increased from 0.254 to 8.843 GB, about 34.9 times. Stage sum increased 1.71 times, from 158.6 to 271.5 seconds. Graph build rose from 24.0 to 83.0 seconds, while fit rose from 100.2 to 118.2 seconds.
The upper interval shows where the added work went. From 10 million to 100 million mapping rows, source bytes increased 8.55 times. Staging grew from 5.2 to 32.7 seconds and graph build from 29.7 to 83.0 seconds. Fit changed from 116.1 to 118.2 seconds, and prediction from 31.4 to 31.5 seconds, under the same training budget and prediction cohort.
Feature-width scaling
The mapping table stays at 10 million rows while its total column count grows. Both parent tables keep their rows and 32-column widths. Width 2 means a mapping table with only two foreign-key columns. Wider mapping tables add a primary key and feature columns, so the first transition includes a structural change.
From 2 to 500 mapping columns, stage sum increased 11.1 times, from 128.9 to 1,425.7 seconds. Fit increased 12.2 times, from 75.7 to 923.1 seconds, and prediction increased 12.5 times, from 19.0 to 238.1 seconds. The widest case took 1,452.6 seconds (24.2 minutes) of case wall time.
Feature growth increased model execution time substantially even with the same optimizer-step and prediction-count limits. Fit accounted for about 65% of the widest case’s stage sum. Reviewing relevant features can therefore matter alongside planning for more rows. Evaluate held-out quality before excluding columns or changing sampling settings.
Memory and storage planning
Two additional three-table workloads illustrate why source bytes alone do not rank resource demand. A compact billion-row mapping table used more sampled system memory than a substantially larger, wider source:
These are separate workloads. The compact mapping table has two columns and the wide mapping table has 500. System memory is the sampled physical memory in use; scratch growth is the increase in used space on the scratch filesystem.
Use the GPU sizing guide when provisioning: allow at least 4 times source size in free local SSD scratch, or 8 times for graphs with many edges. Recommended RAM meets both 4 GiB per vCPU and 1.5 times source size. Allow additional space for staged source files and retained snapshots or outputs on the same filesystem, then verify actual use with a representative pilot.
Methodology
The methodology focused solely on infrastructure benchmarking: elapsed time, system memory, and local scratch use. Predictive accuracy was outside the evaluation.
Hardware capacities are from AWS’s G6e specifications. Each run used a fresh graph scratch directory, and filesystem caches were dropped before graph creation. The loader settings below are benchmark controls rather than recommended defaults for every workload.
Source sizes sum all tables’ compressed Parquet bytes and use decimal GB (1 GB = 1 billion bytes). Memory and scratch use GiB (1 GiB = 1,073,741,824 bytes).
Repeatability
Two anchor workloads were run three times:
These ranges describe the anchors. Other workloads have one baseline run, so small differences should not be treated as established rankings. Main tables and plots consistently retain the first run rather than mixing it with repeat medians.
Next steps and limits
The table-count experiment grows total rows and source bytes as it adds tables. The controlled row-volume sweep exists only at three tables. There is no measured volume sweep within the 4-, 8-, 16-, 32-, or 64-table schemas. The 64-table graphs contain about 0.527 GB of source Parquet; these runs do not establish capacity or runtime for large 64-table databases.
The row-volume experiment fixes optimizer steps and prediction rows. Larger training budgets, model plans, or prediction cohorts need separate measurements. The memory sampler ran every two seconds, so shorter peaks may be missed. Observed resource peaks are not minimum safe provisioned capacities.
For your next evaluation, preserve the intended query, relationship structure, feature widths, and representative key distributions. Measure progressively larger row volumes within that schema. Record case wall time, individual stages, system RAM, GPU memory, and scratch use, then choose capacity and training settings from those measurements. The Model Plan Guide explains the settings to record and control.
Download measurements
The tables above cover 27 topology workloads, five row-volume workloads, and four width workloads. The downloads include all 48 measured g6e.8xlarge baseline runs across 44 distinct workloads, including encoding and stress experiments and four additional anchor repetitions.
Raw run table (CSV)
Individual stage records (CSV)
Both tables with a column guide (ZIP)