

Monitor Predictions
Monitor each batch of scores your model produces. When you finish this page, you can tell whether a prediction run’s scores have shifted from the model’s holdout scores and from the previous run, see which input columns changed since training, and measure the run’s accuracy once its outcomes are known. The results appear on the prediction run in your tracker, beside its scores (on Snowflake, in a run of their own).
This page continues from Register and Promote Models, and the examples use cfg, graph, and the loaded champion from that page. Monitoring reads prediction runs that trainer.predict() stored inside a kumo.mlops block.
Compare Scores With the Holdout and the Previous Run
Every prediction run that trainer.predict() records already compares its scores with the model’s holdout scores from training, and logs the result as the drift/psi, drift/ks, and drift/wasserstein metrics. To also compare it with the previous run, and its input columns with the training data, call score_drift.
The following example scores today’s snapshot and compares the run with earlier_run, the previous prediction run of the same model. Find a Model’s Earlier Runs shows how a job loads it; on the model’s first run, omit previous=:
To fill TARGET_PRED for binary classification, which Warehouse Monitors reads, pass binary_classification_threshold to predict(), as described in Export Evaluations.
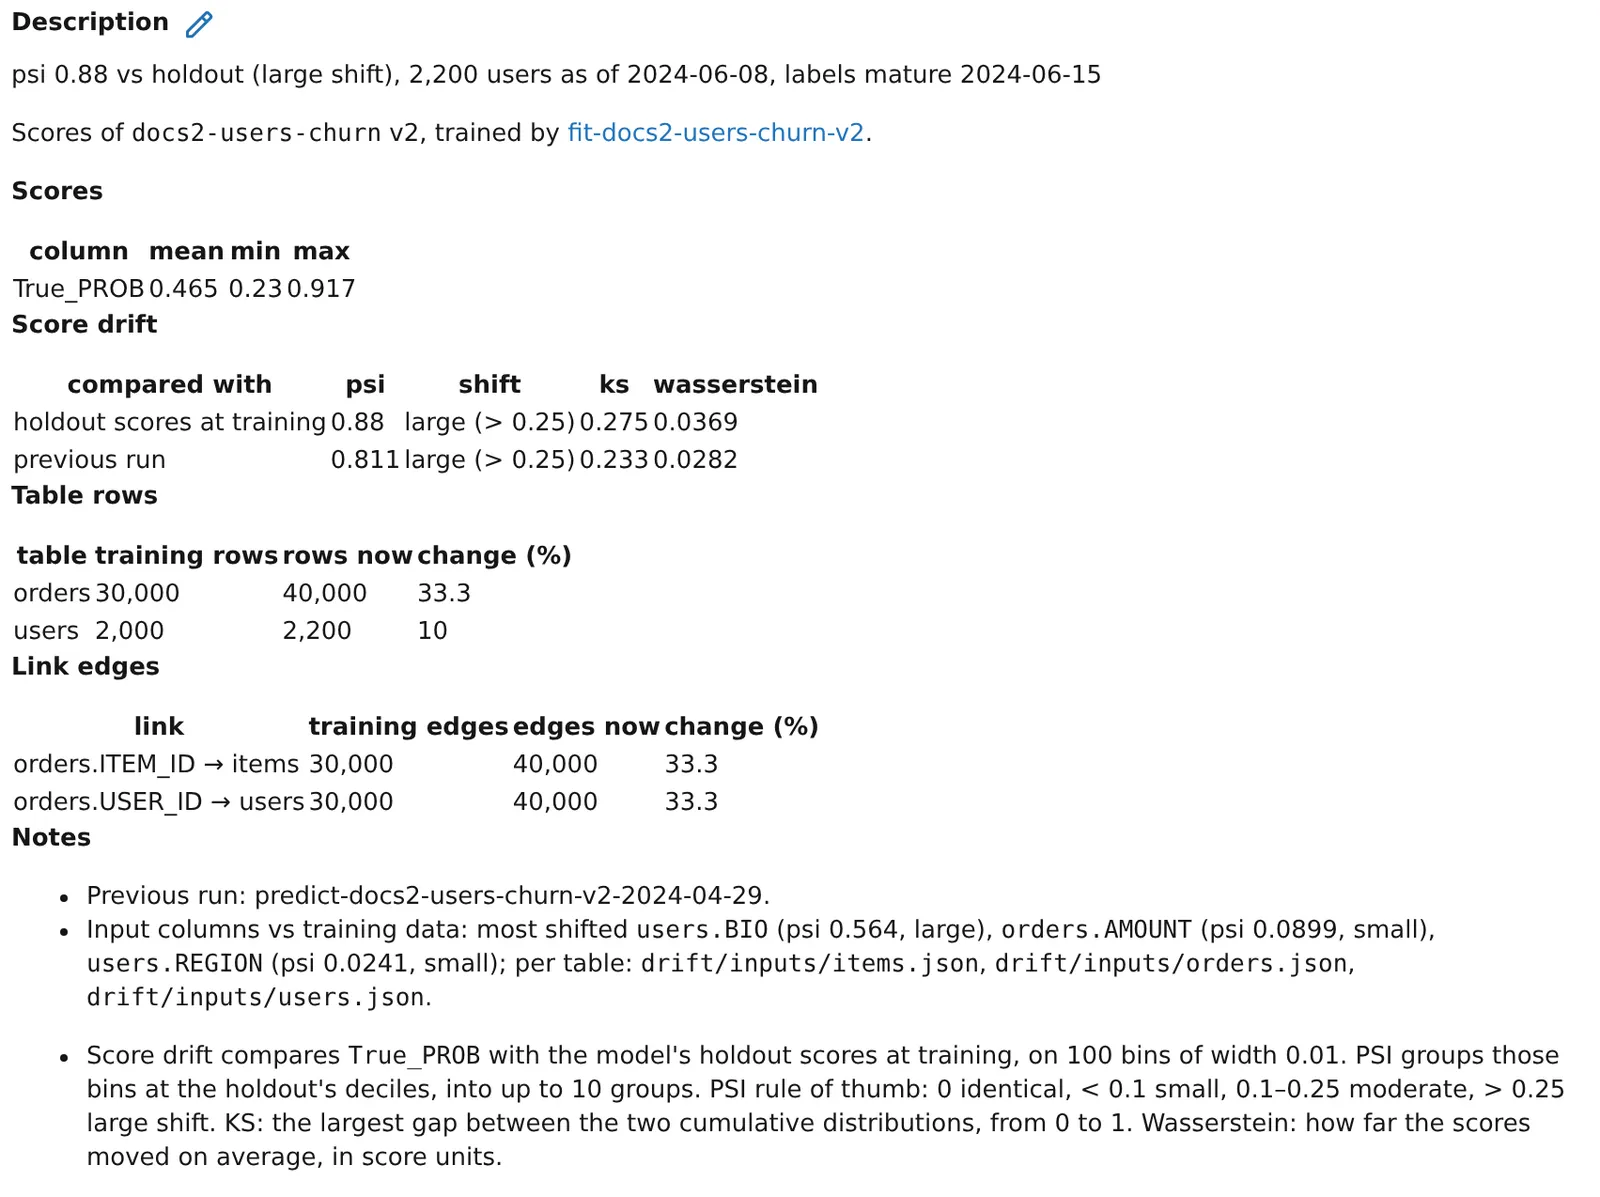
drift is a DriftReport. The first line prints the three statistics against the holdout, such as 0.88 0.27 0.037, and the second against the previous run. input_changes maps each table, and each link between tables, whose row or edge count changed since training to its count at training and now, such as {"orders": (30000, 40000)}. Without previous=, the previous run’s statistics are None. Any statistic that cannot be computed is None, and drift.reasons says why; for example, a regression or ranking model’s run cannot be compared with a run of another model version.
Inside the block, score_drift also writes into the prediction run: the drift/psi_vs_prev, drift/ks_vs_prev, and drift/wasserstein_vs_prev metrics, one table per source table under drift/inputs/ in the run’s artifacts, and a Score drift section in the run card. The card below belongs to a run scored on newer data than the model’s training data:
On Snowflake (preview), each score_drift and evaluate call inside the block records its own run in the experiment instead, named after the prediction run, such as DRIFT_CHURN_GNN_V1_2026_11_01 or EVAL_CHURN_GNN_V1_2026_11_01. These runs count toward the experiment’s limit of 500 runs described in Track Runs.
Read the Drift Statistics
Each statistic compares the run’s score distribution with the reference: the model’s holdout scores, or the previous run’s scores. The score compared is True_PROB for binary classification, the top class’s probability for multiclass, each entity’s top score for multilabel classification, ranking, and link prediction, and the predicted value for regression and forecasting.
A shift tells you the population or the data changed; it does not tell you the model got worse. Check the input tables first, then measure accuracy once outcomes arrive.
Read the Input Column Changes
drift.features maps each source table and column the model uses to its statistics at training and now, with the column’s PSI where one is defined, for example drift.features["users"]["AGE"]["psi"].
The tables under drift/inputs/ in the run’s artifacts list the same columns, most shifted first. Each row has the column’s PSI and shift verdict and the change in null rate and in distinct values; numerical columns also have the change in mean, in training standard deviations. The run card names the three most shifted columns. The drift/inputs_max_psi metric is the largest column PSI, so a run search such as metrics.`drift/inputs_max_psi` > 0.25 finds the runs whose inputs shifted most.
They describe whole tables, so a slow change in a large event table shows up only when it is large enough to move the whole column.
Measure Accuracy Once Outcomes Arrive
When enough time has passed for a run’s outcomes to be known, call evaluate with a newer snapshot that contains them. For a query that predicts churn over the next 7 days, a run scored as of November 1 can be evaluated with a snapshot whose orders run past November 8.
The following example loads run_to_check, a prediction run scored at least one outcome window ago, and evaluates it with today’s snapshot. Replace <prediction id> with the run’s id, or find the run as in Find a Model’s Earlier Runs:
The command prints the realized metrics, such as {'auroc': 0.778, 'ap': 0.775}, whether the outcome window has closed (True), and the share of scored rows that have an outcome, such as 1.0. Inside the block, the metrics are logged on the evaluated prediction run as realized/<metric>, such as realized/auroc, and the run card compares each with the model’s holdout value.
If the outcome window has not closed in newer, evaluate warns, returns matured=False, and reports metrics over the outcomes observed so far. When a metric cannot be computed, it is missing or None in evaluation.metrics, and evaluation.reasons says why.
evaluate reports the same metrics, with the same definitions, as the fit’s holdout:
Find a Model’s Earlier Runs
A scheduled monitoring job runs in a new process, so it first finds the runs to compare, then loads them from the artifact root as described in Read Artifacts Back.
MLflow, Databricks, and SageMaker
Snowflake (Preview)
The following example finds the two most recent finished prediction runs of the champion model in your tracker’s experiment, loads them, and compares the latest with the one before it:
latest is the run that started last, and earlier holds the run before it, if any. The search needs at least one run; a newly promoted model has none until its first scoring job. Loading a run reads only its record; its scores download when a monitoring call needs them. The drift is written into the latest run, as when you call score_drift right after scoring.
Both examples order runs by when they were scored. If a backfill scores older data after a daily run, order by prediction time instead, for queries with a time window: load more runs (with MLflow, raise max_results) and sort them as in the Snowflake example, but with key=lambda run: max(run.manifest.prediction_table.anchors).
Export Evaluations
To track realized accuracy over time in your warehouse, export each evaluation’s rows to a table. Each row is one scored entity that has an outcome, with its scores, its prediction time, its outcome as TARGET, and the time it was evaluated as EVALUATED_AT. dbx is a kumo.DatabricksConnector for the schema that holds the table; for Snowflake, pass a kumo.SnowflakeConnector instead:
With WriteMode.APPEND, each export adds its rows and the PREDICTION_ID and BUNDLE_ID columns, so one table keeps every evaluation of every model version. Exporting the same evaluation twice adds its rows twice, so a retried job should check for its PREDICTION_ID first. For binary classification, TARGET_PRED has a value only when the prediction run had a threshold: binary_classification_threshold passed to trainer.predict(), or a default threshold stored with the model. Warehouse Monitors turns this table into a monitor dashboard. To export to files instead, pass a file connector and a directory path; files do not support APPEND, so use a new directory for each evaluation.