Usage#
Grafana dashboard runs on node port 32300. Ports might not be directly accessible depending on your deployment choices. See deployment guide for more detail.
Default username:
adminDefault password:
admin
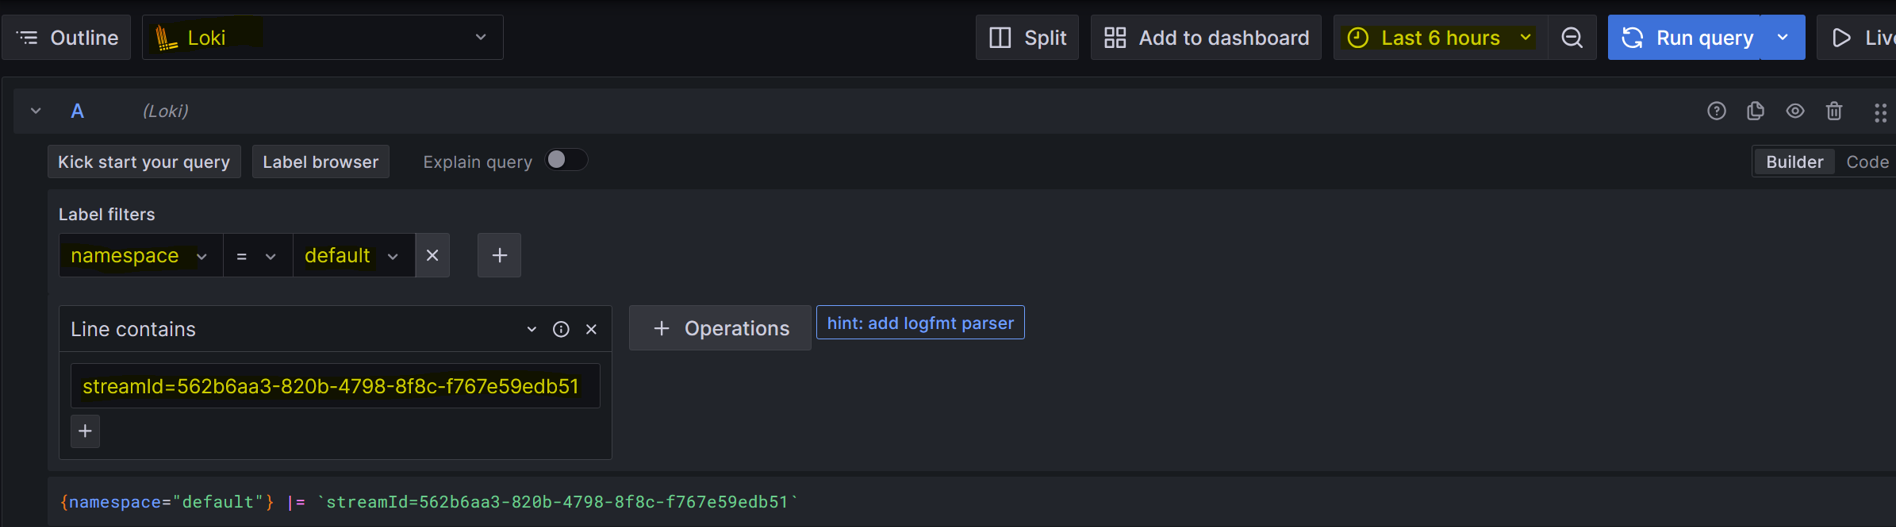
View Logs#
Navigate to
HOME > ExploreSelect
Lokias the datasourceSelect a valid time range (e.g.,
Last 6 hours)Select label filters (e.g.,
namespace = default)
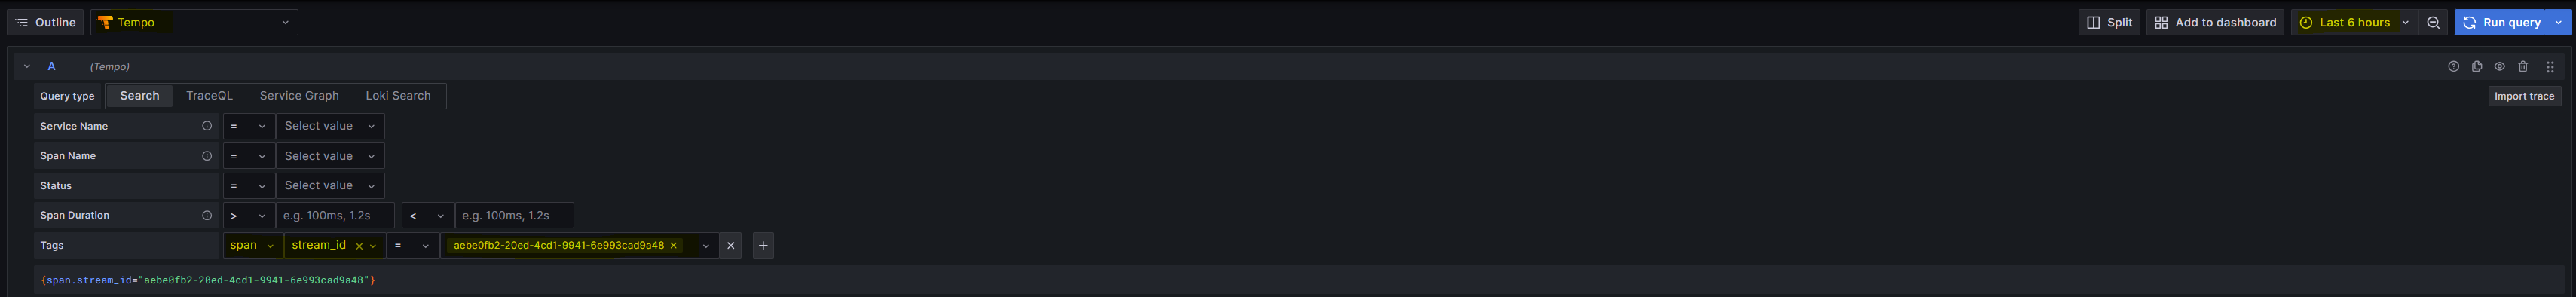
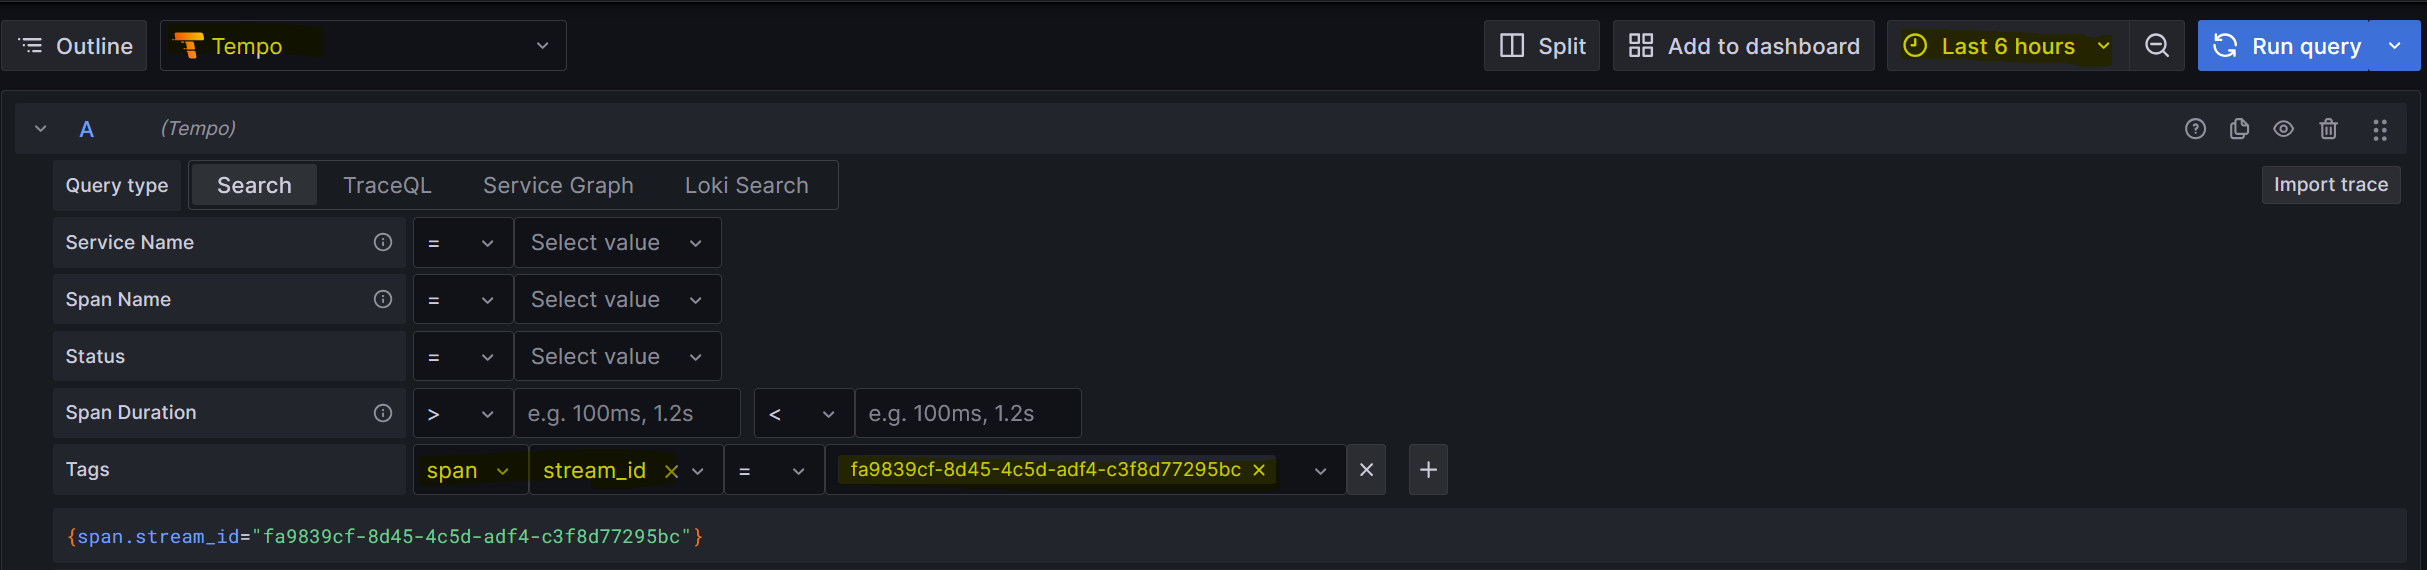
View Traces#
Navigate to
HOME > ExploreSelect
Tempoas the datasourceSelect a valid time range (e.g.,
Last 6 hours)Select tag filter (e.g.,
span.stream_id = 'xxxxxxxxxxx')
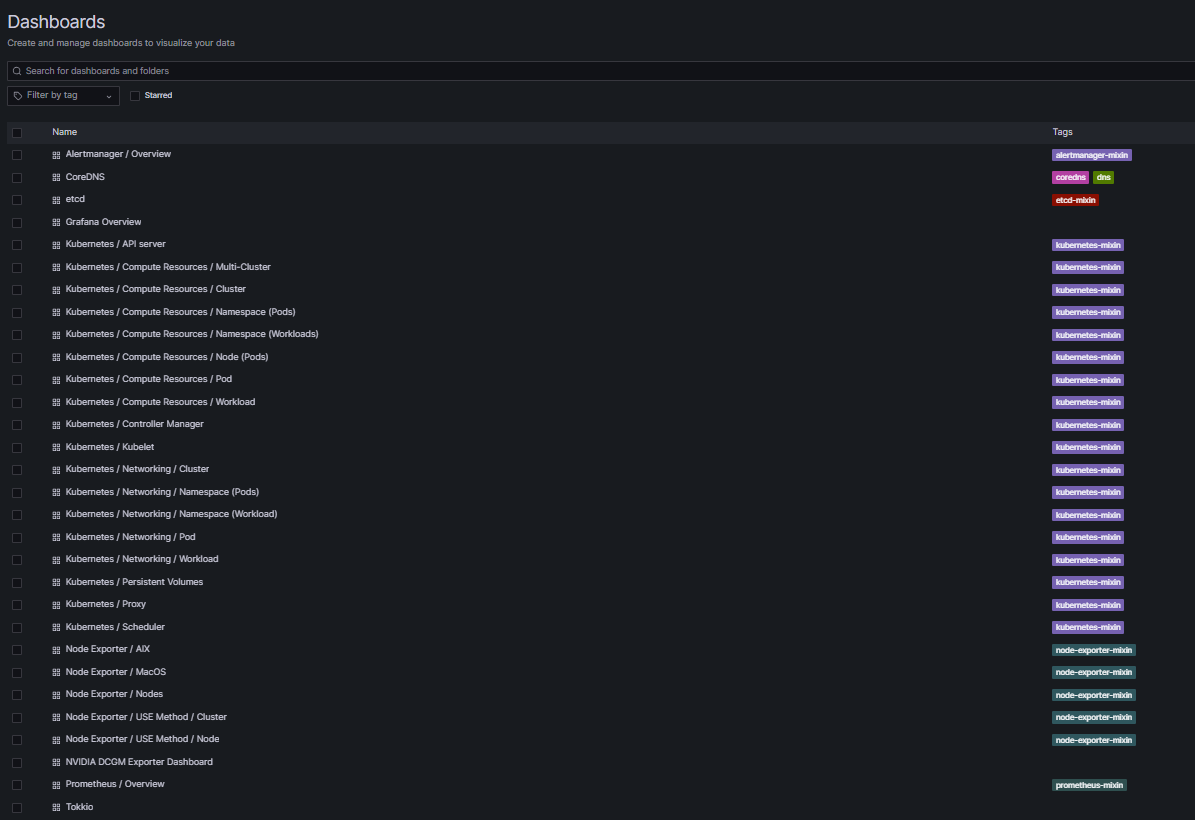
View Metrics#
Navigate to
HOME > DashboardsSelect one of the dashboards from the list of dashboards.
Many of the dashboards come from the kubernetes-mixin project with the exceptions of
NVIDIA DCGM Exporter DashboardandTokkio Dashboard.NVIDIA DCGM Exporter Dashboardtracks GPU-related metrics such as compute & frame buffer usage, temperature, and etc.Tokkio Dashboardtracks Tokkio related metrics such as average session duration, average transcript to speech latency, and etc.
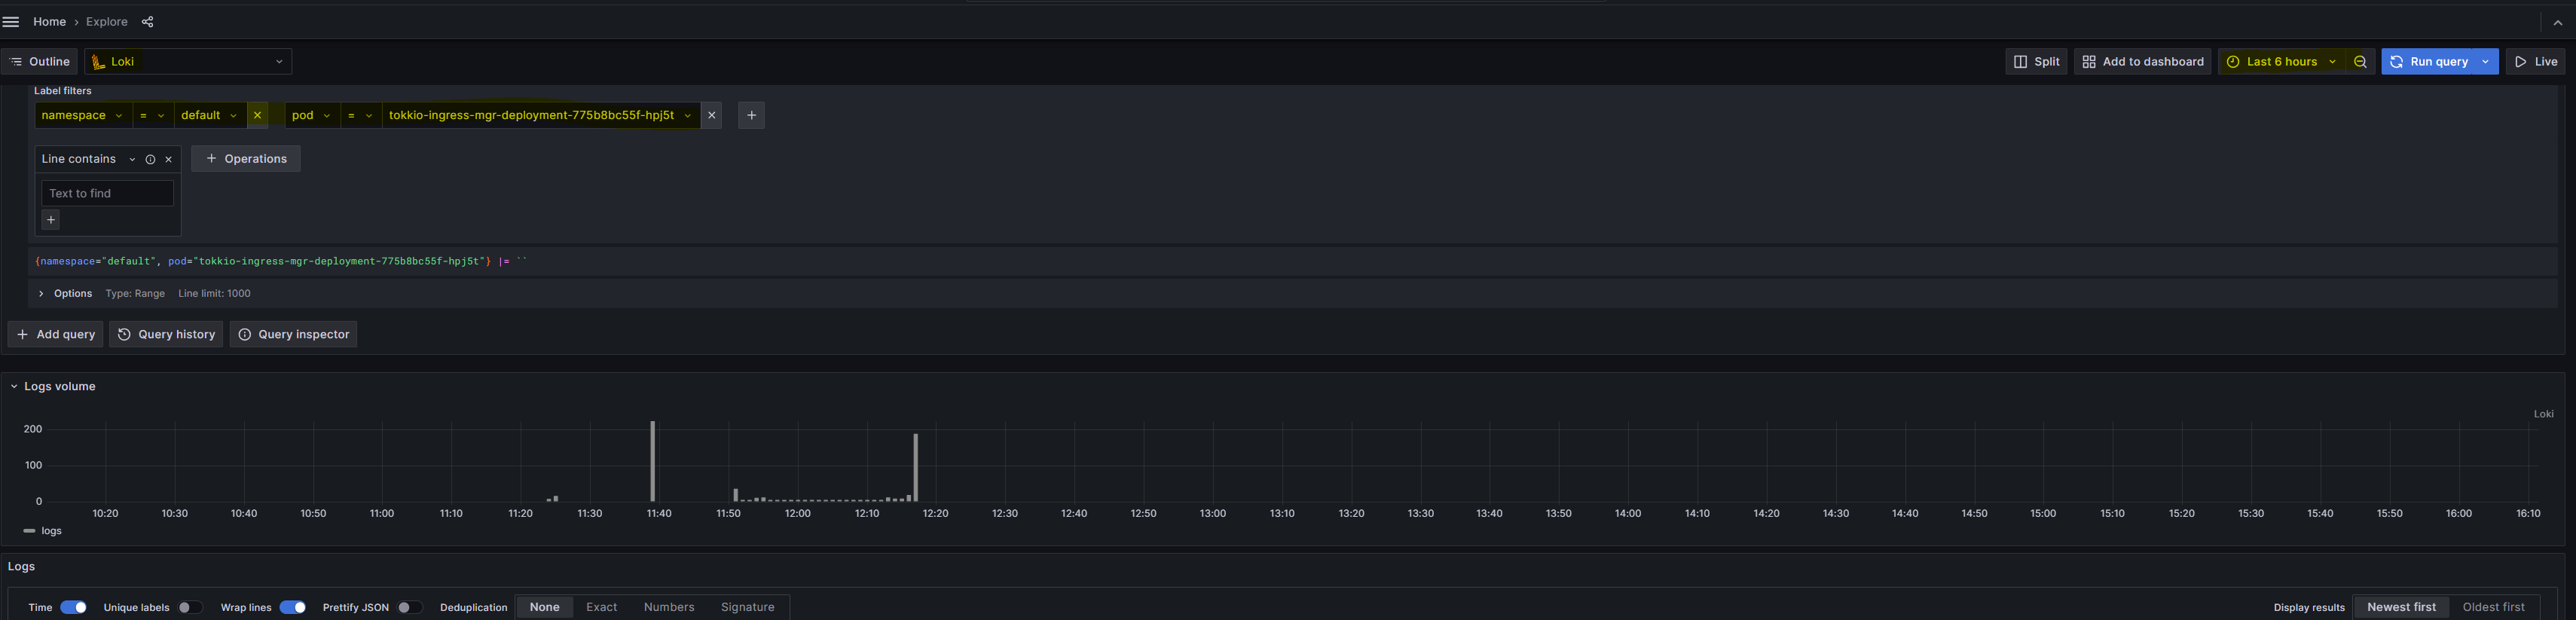
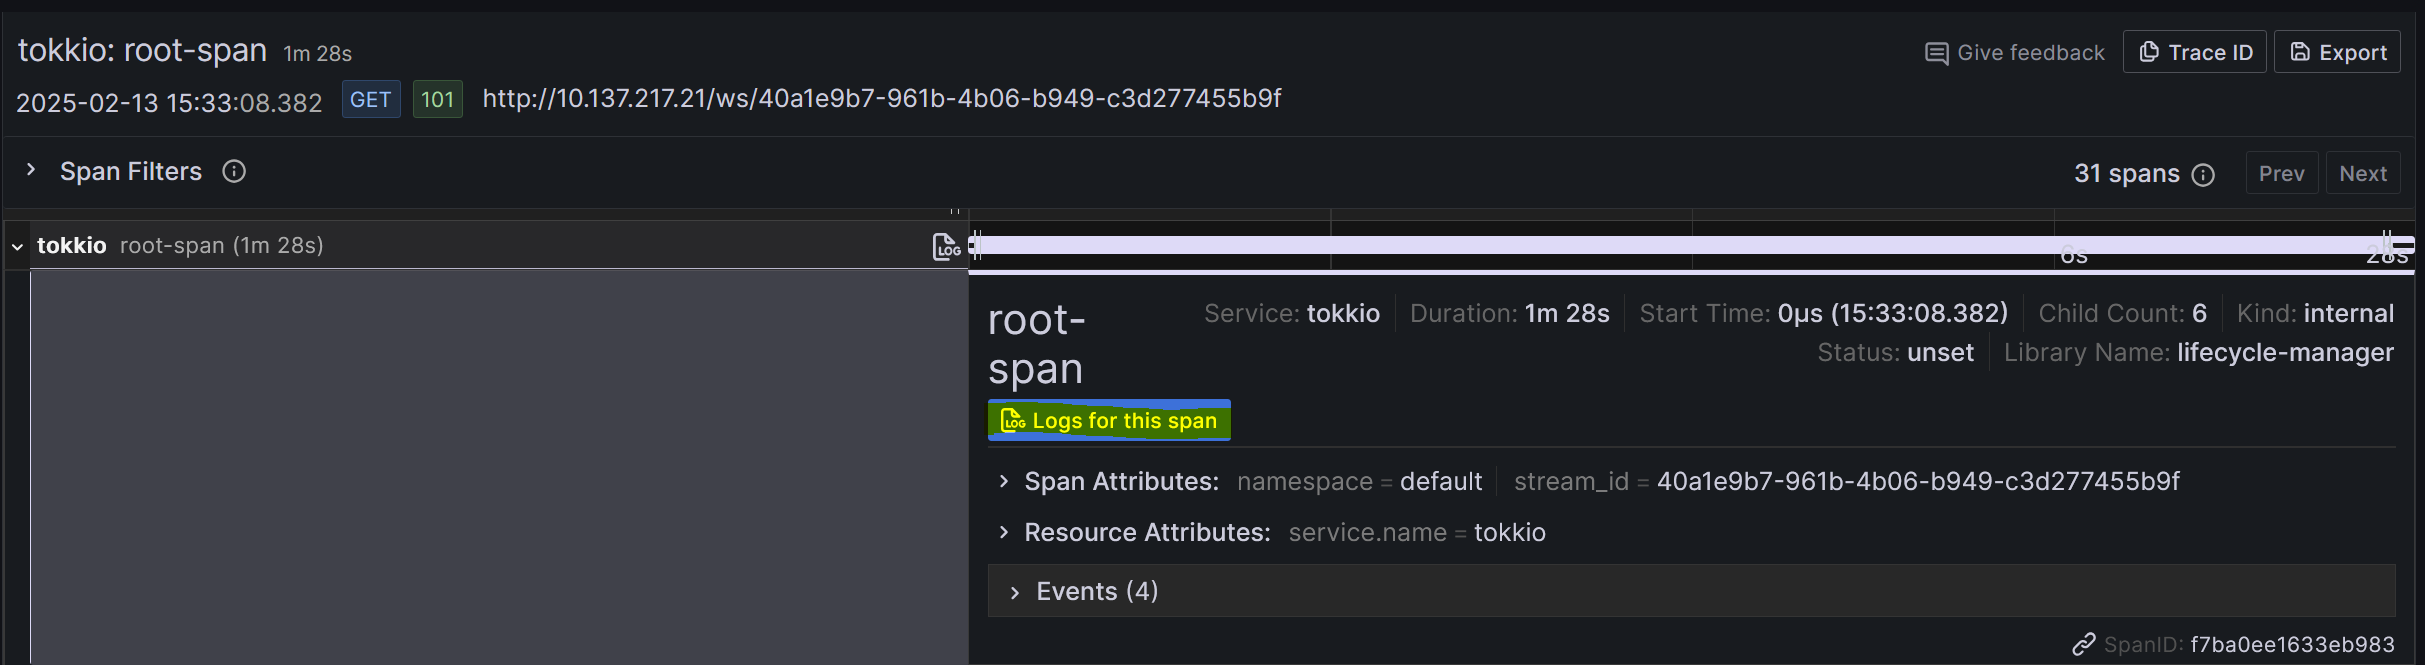
Correlate Logs with Traces#
Navigate to
HOME > ExploreSelect
Tempoas the datasourceSelect a valid time range (e.g.,
Last 6 hours)Select tag filter (e.g.,
span.stream_id = 'xxxxxxxxxxx')Expand the Tokkio root span
Click on the
Log for this spanbutton.All logs, including that stream ID, will show up, and you may further filter the logs based on labels (e.g.,
container = "ingress-mgr")
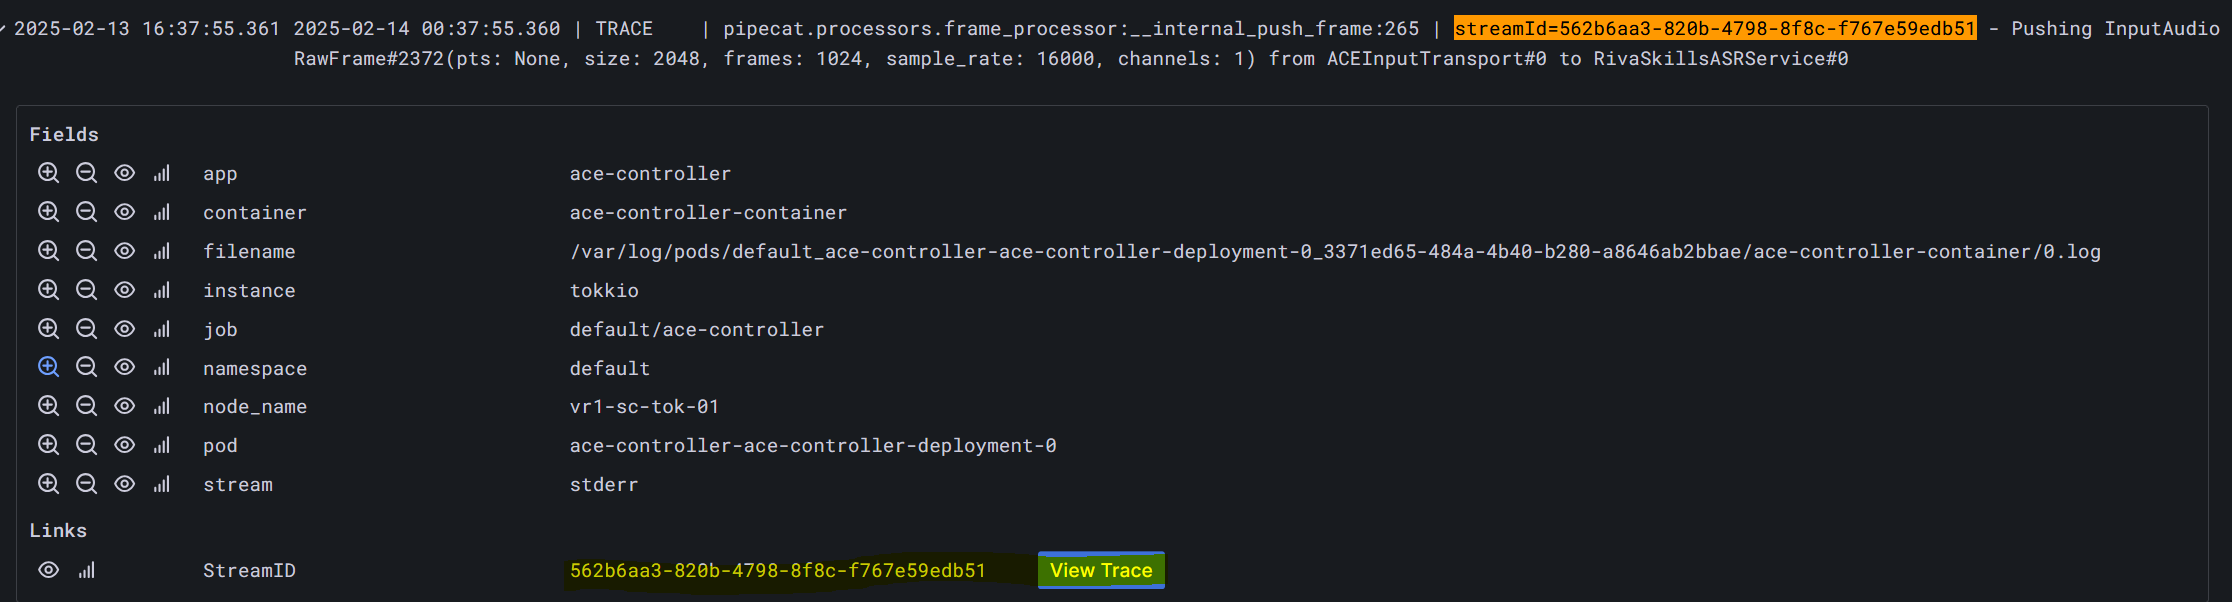
Correlate Traces with Logs#
Navigate to
HOME > ExploreSelect
Lokias the datasourceSelect a valid time range (e.g.,
Last 6 hours)Select label filters (e.g.,
namespace = default)Search logs for lines that contain
streamId="xxxxxxx"Expand on any of the log entries and click on
view trace