Troubleshooting#
Refer to the following sections for detailed troubleshooting information:
Please report to NVIDIA the following:
Log Collection#
Caution
IMPORTANT SECURITY WARNING Before sharing any log files, please ensure you:
Review and remove any sensitive information (credentials, API keys, passwords)
Remove any internal IP addresses or hostnames
Sanitize any personal or confidential data
Remove any authentication tokens or session information
Attach the application instance logs.
Follow the steps below to collect the logs from the application instance. These commands should be run from the instance where the application is deployed.
Download and run the log collection script:
# Download the script curl -L https://raw.githubusercontent.com/NVIDIA/ACE/main/workflows/tokkio/5.0.0-ga/scripts/debug/capture_debug_info.sh -o capture_debug_info.sh # Make it executable chmod u+x ./capture_debug_info.sh # Run the script ./capture_debug_info.shIMPORTANT: Before sharing the archive
Extract and review all files in the archive
Remove or redact any sensitive information
Verify no confidential data remains
Create the final archive:
tar -czf kubernetes_logs_and_events_<timestamp>.tar.gz kubernetes_logs_and_events_<timestamp>Share the sanitized archive with your Tokkio support contact for further assistance.
Attach Tokkio UI logs
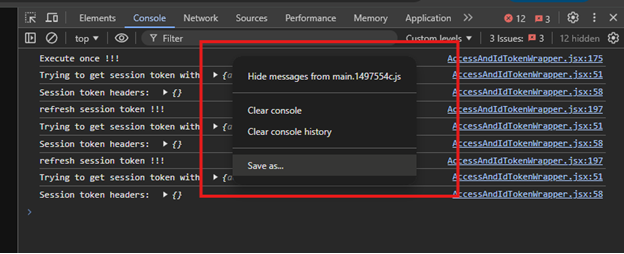
To collect Tokkio UI logs, open the developer tools of Chrome and go to the console. Right-click anywhere on the console and save the console logs. Make sure all log levels are enabled before saving the logs, as mentioned earlier.
Attach WebRTC stats dump file
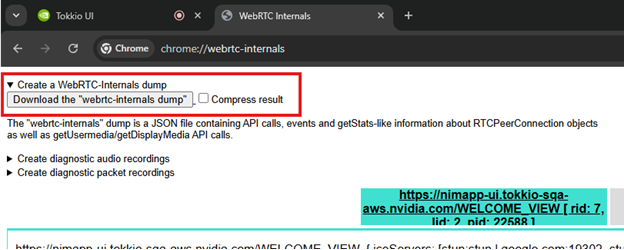
To collect WebRTC stats for logging and reporting an issue, you can download a dump of all WebRTC stats using the create a WebRTC internal dump option. This will download a JSON file that can be used for debugging purposes. Make sure to let the stats run for a few minutes so that they can collect enough data points.
Where applicable, send a snapshot of the system running status if possible
See View Metrics for steps on how to access the Grafana dashboard
Only include the snapshots of the following dashboards
Kubernetes / Compute Resources / Node (Pods)
NVIDIA DCGM Exporter Dashboard
Node Exporter / Nodes
Choose the Publish to snapshots.raintank.io option and share only the public link to the snapshots.
Where applicable, please share a video of the interaction.
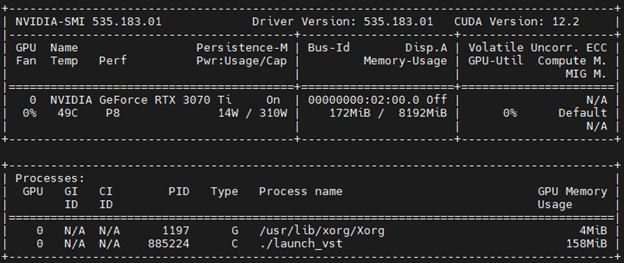
Attach nvidia-smi output
Run nvidia-smi command in terminal and copy its output. This has information about GPU drivers and utilization. The typical output of nvidia-smi will look like the sample log.
General Troubleshooting Checklist#
All containers are up and running
Poor network conditions over VPN. See recommended bandwidth table.
STUN/TURN server is correctly deployed, configured & accessible in VST. Refer to the Trickle ICE section.
The microphone is connected to the system.
LLM keys are correctly set & not expired (in case of separate RAG deployment)
GPU drivers are correctly configured. The GPU should be one of the recommended ones. Refer to Tokkio Documentation.
Make sure the web browser is supported. The supported web browsers are Chrome & Safari.
Trickle ICE#
Use a WebRTC Trickle ICE testing tool to check if your ICE Servers work properly. Trickle ICE gathers and shares ICE candidates (potential connection paths) gradually to speed up connections. Note that Trickle ICE does not work with reverse proxy configurations.
STUN Server Testing: Your STUN server works when the tool gathers a candidate with type “srflx”
TURN Server Testing: Your TURN server works when the tool gathers a candidate with type “relay”
Credential Testing: The tool detects authentication failures when testing a single TURN/UDP server
Detailed Information: The tool shows a table containing details for each gathered candidate, including: - Time - Type - Foundation - Protocol - Address - Port - Priority - Additional applicable details
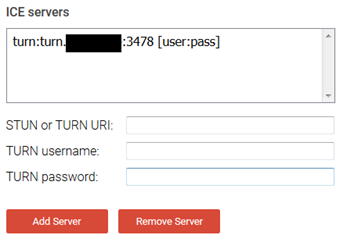
Add stun or turn URI information, then click on add server. For example,
STUN or TURN URI: turn:15.266.16.245:3478

TURN username: coturn-admin

TURN password: "Uq3CFRYKr6rFVFcc
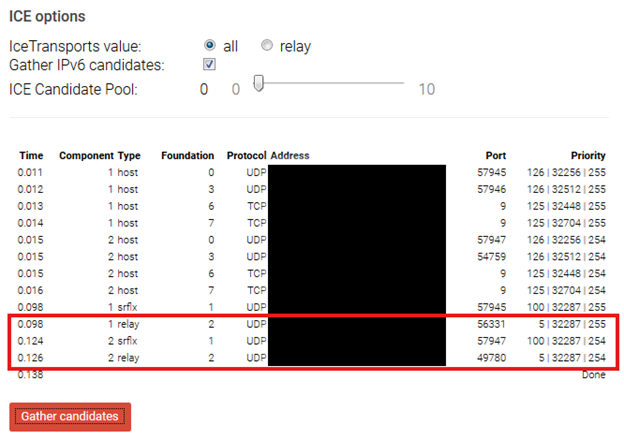
Click on Gather candidates to generate ICE candidates. If you see a relay candidate being generated that means the ICE servers are working as intended.
Ingress is not configured for WebSocket#
WebSocket connection will fail if the ingress is not configured to handle WebSocket connections.
Resolution#
The WebSocket connection involves a HTTP upgrade request. Ingress needs to be configured to handle this upgrade request.
Session ends abruptly within a few seconds.#
A session may begin but end abruptly within a few seconds. This is the result of the WebSocket connection getting disconnected within a few seconds. A consistent WebSocket connection is required for Tokkio UI.
The WebSocket connection is closed because no data is flowing in it.#
By default, most ingress will drop the WebSocket connection if they observe that no data is flowing through it.
Resolution#
The solution is to enable WebSocket ping messages via Tokkio UI config. This will ensure that dummy data is sent every few seconds.
WebSocket connection is closed because of the frequency of ping-pong.#
If the frequency of ping messages is lower than the WebSocket timeout set at ingress, then the WebSocket connection might drop. Even if the WebSocket ping is enabled in the Tokkio UI config, it may happen that the frequency of ping messages being sent is less than the configured setting for dropping the connection in ingress.
Resolution#
Increasing the frequency via Tokkio UI config will fix the issue.
Avatar video stutters or freezes, followed by occasional session closures.#
If everything else works fine but there are video stuttering issues, video freezing issues, and occasional connection drops, then check for the cases below.
The network connection is slow#
If the network speed is slow then this issue may occur.
Resolution#
Check the network speed using any online speed measurement tools. Ensure that if you are using a VPN, the connection speed is not being throttled by the VPN. Ensure the location you are connected to via VPN is not far away. Refer to the resolution vs. bitrate table.
VST is not configured for Avatar resolution#
VST has a config called webrtc_video_quality_tunning to set bitrate ranges for different resolutions.
Resolution#
Ensure that the bitrate settings are realistic. For example, a high bitrate requirement for a 720p stream is not practical. Ensure that the network can provide the bandwidth required for that bitrate.
High CPU usage at client side#
If the CPU usage is high on the client side where Tokkio UI is open, the UI may not get sufficient resources to stream the avatar. In that case, the video can stutter.
Resolution#
Check the CPU usage using Task Manager in Windows.
The network is congested#
If the network is congested, then it will result in frequent packet drops and poor-quality streaming.
Resolution#
Ensure that the network is not congested by looking at the WebRTC stats. Refer to the WebRTC Stats section.
No response received for queries sent to the Tokkio reference workflow#
Ensure that the microphone used for the speech input is functional
Check the logs from the ace controller pod for input speech detection and any errors in retrieving a response.
Collect the system logs as detailed in Log Collection and reach out to Tokkio support point of contact for more information, if needed.
Avatar is stuttering or stopping unexpectedly while speaking with multiple concurrent sessions.#
The avatar speech may become less smooth when the load on compute resources becomes too high. When this happens, Audio2Face-3D inference and blendshape solve can slow down, causing the animation to stutter. Evidence of this can be found in the Audio2Face-3D microservice logs with entries like this:
Streaming <stream ID> at X FPS
Where X is below 30.
If this happens, try reducing the number of concurrent sessions for a smoother experience.
Triton pod crashes on T4 GPU with Parakeet model#
There are a couple of options that the users can try here.
1. Change the model used for Tokkio to asr_conformer_en_us_streaming_throughput_flashlight_vad:2.15.0-tokkio. We can achieve same by passing below user_override_value while deployment.
riva-api:
  modelRepoGenerator:
    ngcModelConfigs:
      triton0:
        models:
        - nvidia/ace/asr_conformer_en_us_streaming_throughput_flashlight_vad:2.15.0-tokkio
        - nvidia/riva/rmir_tts_fastpitch_hifigan_en_us_ipa:2.17.0
You can refer to how to pass user_override_value to the OneClick script using Integrating Persistent Customization Changes without Rebuild.
The pod will restart a few times for a fresh deployment and then eventually come up. A manual restart of the pod might be required if the pod does not automatically come up after several restarts when doing a 1-click deployment.
UE App does not work on three streams in a fresh deployment.#
Delete the renderer-sdr, ue-renderer, and the VMS pod before retrying.
Chart deployment errors out with symlink issues#
If the chart deployment errors out with symlink issues, it is likely due to an omitted step for copying the configuration files to the helm chart. The step is described in Integrating Persistent Customization Changes with Rebuild as step 5. Please see the snippet below as a sample of this this error:
$ helm install tokkio apps/base-1stream-with-ui/
Error: INSTALLATION FAILED: error evaluating symlink /home/user/tokkioucfapp/apps/tokkio-1stream-with-ui/tokkio-app/charts/ace-controller/files/config.yaml: lstat /home/user/tokkioucfapp/apps/tokkio-1stream-with-ui/tokkio-app/config: no such file or directory
The solution for this issue is to ensure that the configuration files are copied over to the helm chart. You can use the short script provided in the Integrating Persistent Customization Changes with Rebuild section to copy over the configuration files.
Advance diagnostic tools and techniques#
WebRTC Stats#
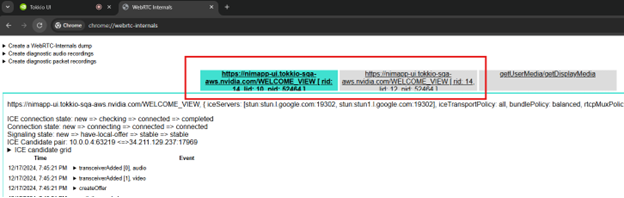
Chrome provides a mechanism to get WebRTC stats in a user-friendly way. The WebRTC stats can give good information about the network conditions, framerate, resolution, audio information, codecs, and many other useful things. To check WebRTC stats, open chrome://webrtc-internals in a separate Chrome tab. In WebRTC internal tabs, we can see information for each Peer Connection. In the image below, we can see there are two Peer Connections, one for Inbound Stream (Avatar) and one for Outbound Stream (Microphone).
To check for inbound stream (Avatar) stats, look for the section Stats graphs for inbound-rtp. Check the image below for reference.
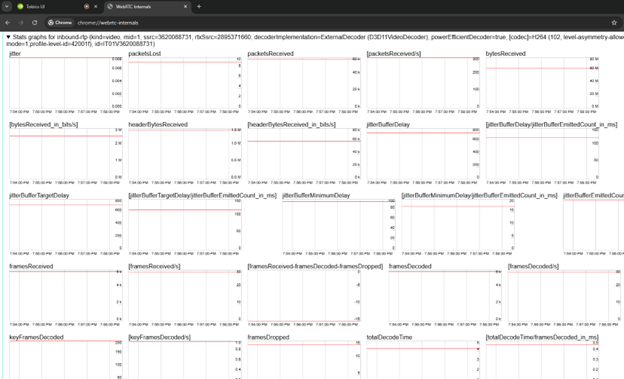
Using these stats, we can observe various useful metrics like frames dropped, nack-count, pli-count, framerate, bitrate, packets lost, jitter, etc. These metrics are useful for debugging any network-related issues.
Using these stats, we can observe various useful metrics like frames dropped, nack-count, pli-count, framerate, bitrate, packets lost, jitter, etc. These metrics are useful for debugging any network-related issues.