Clara Deploy Logging Architecture
This document describes the Clara Deploy logging architecture.
- Deploy Clara
- Generate logs
- Setup Elasticsearch
- View logs
Deploy Clara
To setup the logging architecture, deploy Clara.
            # Deploy Clara
clara start
Generate logs
To generate logs, create a container that writes logs to stdout/stderr. Once deployed, the container’s logs are automaticaly tagged with Kubernetes metadata. Logs from operators are automatically tagged with the operator’s name and the job id. For example:
            import logging

# Log
logging.info("Hello world")
Turns into…
            // Tagged log
{
    "kubernetes": {
        ...
        "labels": {
            "job-id": "12345678910",
            "operator-name": "hello-world-operator",
        },
        "pod-image": "clara/hello-world:0.3.0",
        "pod-name": "hello-world-irho234234",
        ...
    },
    "message": "Hello world",
}
In addition to strings, containers can log json to control how their logs are tagged. Each property-value pair turns into a tag-value pair in the stored log. For example:
            import json
import logging
import time

start_time = int(round(time.time()*1000))

inference()

end_time = int(round(time.time()*1000))
elapsed_time = round(end_time - start_time, 3)

# Json log
timestamp = datetime.strftime(datetime.utcnow(), "%Y%m%dT%H%M%S.%f")[:-3] + 'Z'
print(json.dumps({
    "event": {
        "name": "processing_ended",
        "category": "operator",
        "level": "info",
        "elapsed_time": elapsed_time,
        "timestamp": timestamp,
    },
    "message": "Hello world operator processing ended",
}))
Turns into…
            // Tagged log
{
    "event": {
        "name": "processing_ended",
        "category": "operator",
        "level": "info",
        "elapsed_time": 120342,
        "timestamp": "20190903T222329.123Z",
    },
    "kubernetes": {
        ...
        "labels": {
            "job-id": "12345678910",
            "operator-name": "hello-world-operator",
        },
        ...
    },
    "message": "Hello world operator processing ended"
}
View logs
To view logs in Grafana:
- Navigate to
localhost:32000 - Enter username
adminpasswordclara123 - Click the
Explorebutton on the left - Make sure
Elasticsearchis the selected data source - Click the
Logstoggle button
Example queries:
- Query logs by container name:
kubernetes.container_image:"clara/dicomadapter:0.3.0" - Query logs by operator name:
kubernetes.labels.operator-name:"dicom-writer" - Query logs by job id:
kubernetes.labels.job-id:"44d428881b1e439a89502fc35b0a00ef" - Query logs by log event:
event.name:"processing_ended"
View this link for more info on how to write Lucene Queries to filter the logs
Logs help us understand and improve our service. However, by default, logs are removed when a container crashes, a pod is evicted, or a node dies, which make it challenging to use logs for debugging and identifying performance bottlenecks. As a result, as described in this Kuberentes article, Kubernetes recommends that services “have a separate storage and lifecycle independent of nodes, pods, or containers” for their logs.
The Clara Logging Architecture provides storage and lifecycle management for logs. It uses the node logging agent approach depicted below:
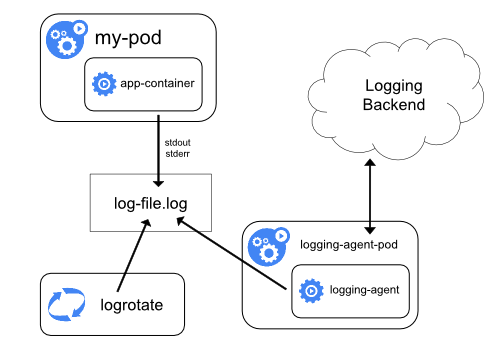
</p>
Clara’s implementation of this approach uses the EFG stack:
- Elasticsearch - log storage
- Fluentd - logging agent
- Grafana - query engine
When deployed, the Clara logging stack looks like this:

Each step above is explained in detail below.
1. Containers
Containers produce logs by sending messages to stdout/stderr. For example:
            import logging

# Simple string long
logging.info("Hello world")

# Json log
elapsed_time = ...
timestamp = datetime.strftime(datetime.utcnow(), "%Y%m%dT%H%M%S.%f")[:-3] + 'Z'
print(json.dumps({
    "event": {
        "name": "processing_ended",
        "category": "operator",
        "level": "info",
        "elapsed_time": elapsed_time,
        "timestamp": timestamp,
    },
    "message": "Hello world operator processing ended",
}))
2. Volume
By default, docker saves stdout and stderr messages to /var/logs/containers/*.log on the node. Run ls /var/logs/containers/ on the node to view the logs that are produced.
3. Fluentd
Fluentd reads logs in /var/logs, tags them with metadata and stores the results in Elasticsearch. We deploy Fluentd using the Fluentd-Elasticsearch helm chart. When Clara starts, Fluentd runs in a pod with default configurations.
The default configurations use the kubernetes metadata filter, which tags new log entries with kubernetes metadata. The operator name and job id were added to each operator’s kubernetes specification in this commit, so each log from an operator is tagged with the operator’s name and job id. For example:
            // Log
"Hello world"

// Tagged log
{
    "kubernetes": {
        ...
        "labels": {
            "job-id": "12345678910",
            "operator-name": "hello-world-operator",
        },
        "pod-image": "clara/hello-world:0.3.0",
        "pod-name": "hello-world-irho234234",
        ...
    },
    "message": "Hello world",
}
In addition, the default configuration detects and parses json log entries. Each property-value pair is turned into a tag-value pair in Elasticsearch. For example:
            // Log
{
    "event": {
        "name": "processing_ended",
        "category": "operator",
        "level": "info",
        "elapsed_time": elapsed_time,
        "timestamp": "20190903T222329.123Z",
    },
    "message": "Hello world operator processing ended",
}

// Tagged log
{
    "event": {
        "name": "processing_ended",
        "category": "operator",
        "level": "info",
        "elapsed_time": 120342,
        "timestamp": "20190903T222329.123Z",
    },
    "kubernetes": {
        ...
        "labels": {
            "job-id": "12345678910",
            "operator-name": "hello-world-operator",
        },
        ...
    },
    "message": "Hello world operator processing ended"
}
4. Elasticsearch
Elasticsearch is the database we use to store logs. We deploy Elasticsearch using the Elasticsearch helm chart. When Clara starts, Elasticsearch runs in a pod. A ClusterIP service exposes Elasticsearch to applications, such as Fluentd and Grafana, running in the same namespace.
5. Grafana
Grafana is the user interface we use to view logs and charts. We deploy Grafana using the Grafana helm chart. When Clara starts, Grafana runs in a pod. A NodePort service exposes Grafana on port 32000. As a result, navigating to localhost:32000 will bring up the Grafana UI where you can view logs and charts based on realtime data.
Original author: Rahul Choudhury
When looking at logs, we often want to understand specific types of events, such as when a process starts, when a process ends, and how long a process takes to run. To view and aggregate events across multiple containers we created a standard way to log them.
Event Dictionary
Each event consists of a name, category and properties. All Clara events are listed below. If you create a new event, please add it to the list
- Processing Started
- Processing Ended
- Stage Started
- Stage Ended
Processing Started
Use this event when you want to identify when a process starts.
| Property Name | Required | Value | Description |
|---|---|---|---|
| name | Yes | processing_started | The name of the event |
| category | Yes | _ | The event’s category |
| level | Yes | info | The level of the log |
| timestamp | Yes | The time of the event in ISO_8601 format with millisecond precision. (e.g., 20190903T222329.123Z) |
            # Example: Operator Processing Started

import json

timestamp = datetime.strftime(datetime.utcnow(), "%Y%m%dT%H%M%S.%f")[:-3] + 'Z'
print(json.dumps({
    "event": {
        "name": "processing_started",
        "category": "operator",
        "level": "info",
        "timestamp": timestamp,
    },
    "message": "Hello world operator processing started",
}))
Processing Ended
Use this event when you want to capture the processing time of an operator in a pipeline.
| Property Name | Required | Value | Description |
|---|---|---|---|
| name | Yes | processing_ended | The name of the event |
| category | Yes | _ | The event’s category |
| level | Yes | info | The level of the log |
| elapsed_time | Yes | Processing time in milliseconds | |
| timestamp | Yes | The time of the event in ISO_8601 format with millisecond precision. (e.g., 20190903T222329.123Z) |
            # Example: Operator Processing Ended

import json
import logging
import time

start_time = int(round(time.time()*1000))

inference()

end_time = int(round(time.time()*1000))
elapsed_time = round(end_time - start_time, 3)

timestamp = datetime.strftime(datetime.utcnow(), "%Y%m%dT%H%M%S.%f")[:-3] + 'Z'
print(json.dumps({
    "event": {
        "name": "processing_ended",
        "category": "operator",
        "level": "info",
        "elapsed_time": elapsed_time,
        "timestamp": timestamp,
    },
    "message": "Hello world operator processing ended",
}))
Stage Started
Use this event when you want to identify when a stage in an operator started.
| Property Name | Required | Value | Description |
|---|---|---|---|
| name | Yes | stage_started | The name of the event |
| stage | Yes | The name of the stage | |
| category | Yes | _ | The event’s category |
| level | Yes | info | The level of the log |
| timestamp | Yes | The time of the event in ISO_8601 format with millisecond precision. (e.g., 20190903T222329.123Z) |
            # Example: Operator Stage Started

import json

# ...

def write():
    timestamp = datetime.strftime(datetime.utcnow(), "%Y%m%dT%H%M%S.%f")[:-3] + 'Z'
    print(json.dumps({
        "event": {
            "name": "stage_started",
            "stage": "write"
            "category": "operator",
            "level": "info",
            "timestamp": timestamp,
        },
        "message": "Started writing files",
    }))

    # write files

read()
process()
write()
Stage Ended
Use this event when you want to capture the processing time of a stage in an operator.
| Property Name | Required | Value | Description |
|---|---|---|---|
| name | Yes | stage_ended | The name of the event |
| stage | Yes | The name of the stage | |
| category | Yes | _ | The event’s category |
| level | Yes | info | The level of the log |
| elapsed_time | Yes | Processing time in milliseconds | |
| timestamp | Yes | The time of the event in ISO_8601 format with millisecond precision. (e.g., 20190903T222329.123Z) |
            # Example: Operator Stage Started

import json

# ...

def write():
    start_time = int(round(time.time()*1000))

    # write files

    end_time = int(round(time.time()*1000))
    elapsed_time = round(end_time - start_time, 3)

    timestamp = datetime.strftime(datetime.utcnow(), "%Y%m%dT%H%M%S.%f")[:-3] + 'Z'
    print(json.dumps({
        "event": {
            "name": "stage_ended",
            "stage": "write"
            "category": "operator",
            "level": "info",
            "elapsed_time": elapsed_time,
            "timestamp": timestamp,
        },
        "message": "Finished writing files",
    }))

read()
process()
write()