Autoscaling and Load Balancing Generative AI w/ Triton Server and TensorRT-LLM#
Setting up autoscaling and load balancing for large language models served by Triton Inference Server is not difficult, but does require preparation.
This guide outlines the steps to download models from Hugging Face, optimize them for TensorRT, and configure automatic scaling and load balancing in Kubernetes. TensorRT, and configuring automatic scaling and load balancing for your models. This guide does not cover Kubernetes’ basics, secure ingress/egress from your cluster to external clients, nor cloud provider interfaces or implementations of Kubernetes.
When configured properly autoscaling enables LLM based services to allocate and deallocate resources automatically based on the current load. adapt to the current workload intensity. In this tutorial, as the number of clients grow for a given Triton Server deployment, the inference load on the server increases and the queue-to-compute ratio will eventually cause the horizontal pod autoscaler to increase the number of Triton Server instancing handle requests until the desired ratio is achieved. Inversely, decreasing the number of clients will reduce the number of Triton Server instances deployed.
We’ll cover the following topics:
Prior to beginning this guide/tutorial you will need a couple of things.
Kubernetes Control CLI (
kubectl) [ documentation | download ]Helm CLI (
helm) [ documentation | download ]Docker CLI (
docker) [ documentation | download ]Decent text editing software for editing YAML files.
Kubernetes cluster.
Fully configured
kubectlwith administrator permissions to the cluster.
Cluster Setup#
The following instructions detail how to set up Horizontal Pod Autoscaling (HPA) for Triton Inference Server in a Kubernetes cluster.
Prerequisites#
This guide assumes that all nodes with NVIDIA GPUs have the following:
A node label of
nvidia.com/gpu=presentto more easily identify nodes with NVIDIA GPUs.A node taint of
nvidia.com/gpu=present:NoScheduleto prevent non-GPU pods from being deployed to GPU nodes.
[!Tip] When using a Kubernetes provider like AKS, EKA, or GKE, it is usually best to use their interface when configuring nodes instead of using
kubectlto do it directly.
Core Cluster Services#
Once all nodes are correctly labeled and tainted, use the following steps to prepare the cluster to collect and serve the necessary metrics to enable automated horizontal pod autoscaling for Triton Server.
The following series of steps are intended to prepare a fresh cluster. For clusters in varying states, it is best to coordinate with your cluster administrator before installing new services and capabilities.
Kubernetes Node Feature Discovery service#
Add the Kubernetes Node Feature Discovery chart repository to the local cache.
helm repo add kube-nfd https://kubernetes-sigs.github.io/node-feature-discovery/charts \
  && helm repo update
Run the command below to install the service.
helm install -n kube-system node-feature-discovery kube-nfd/node-feature-discovery \
  --set nameOverride=node-feature-discovery \
  --set worker.tolerations[0].key=nvidia.com/gpu \
  --set worker.tolerations[0].operator=Exists \
  --set worker.tolerations[0].effect=NoSchedule
[!Note] The above command sets toleration values which allow for the deployment of a pod onto a node with a matching taint. See this document’s prerequisites for the taints this document expected to have been applied to GPU nodes in the cluster.
NVIDIA Device Plugin for Kubernetes#
This step is not needed if the Device Plugin has already been installed in your cluster. Cloud providers with turnkey Kubernetes clusters, such as those from AKS, EKS, and GKE, often install the Device Plugin automatically when a GPU node is added to the cluster. automatically once a GPU node as been added to the cluster.
To check if your cluster requires the NVIDIA Device Plugin for Kubernetes, run the following command and inspect the output for
nvidia-device-plugin-daemonset.kubectl get daemonsets --all-namespaces
Example output:
NAME                                          DESIRED  CURRENT  READY  UP-TO-DATE  AVAILABLE
kube-proxy                                    6        6        6      6           6
kube-system   node-feature-discovery-worker   1        1        1      1           1
nvidia-device-plugin-daemonset                6        6        6      6           6
If
nvidia-device-plugin-daemonsetis not listed, run the command below to install the plugin. Once installed it will provide containers access to GPUs in your clusters.For additional information, see Github/NVIDIA/k8s-device-plugin.
kubectl create -f https://raw.githubusercontent.com/NVIDIA/k8s-device-plugin/v0.15.0/deployments/static/nvidia-device-plugin.yml
NVIDIA GPU Feature Discovery Service#
This step is not needed if the service has already been installed in your cluster.
To check if your cluster requires the NVIDIA GPU Feature Discovery Service, run the following command and inspect the output for
nvidia-device-plugin-daemonset.kubectl get daemonsets --all-namespaces
Example output:
kubectl get daemonsets --all-namespaces
NAMESPACE     NAME                                  DESIRED   CURRENT   READY   UP-TO-DATE   AVAILABLE
kube-system   gpu-feature-discovery                 2         2         2       2            2
kube-system   kube-proxy                            6         6         6       6            6
kube-system   node-feature-discovery-worker         6         6         6       6            6
kube-system   nvidia-device-plugin-daemonset        6         6         6       6            6
If
gpu-feature-discoveris listed, skip this step and the next.Otherwise, use the YAML file below to install the GPU Feature Discovery service.
The file above was created by downloading its contents from GitHub/NVIDIA and modified specifically for Triton Server autoscaling.
curl https://raw.githubusercontent.com/NVIDIA/gpu-feature-discovery/v0.8.2/deployments/static/gpu-feature-discovery-daemonset.yaml \
  >  nvidia_gpu-feature-discovery_daemonset.yaml
Then run the command below to install the
kubectl apply -f ./nvidia_gpu-feature-discovery_daemonset.yaml
Metrics Collection Services#
Your cluster is now up, running, and can assign GPU resources to containers. Next, we have to setup metrics collection for DCGM and Triton Server. Metrics services provide utilization and availability data to the Kubernetes Horizontal Pod Autoscaler. The data can then be used to make autoscaling decisions. on the utilization and availability of deployed models.
Create a Monitoring Namespace#
Create the monitoring namespace in your cluster for all of the metrics and monitoring services.
Run the command below to create the namespace.
kubectl create namespace monitoring
Prometheus Services#
We need a service to collect, store, aggregate, and provide metrics collected from your cluster and the services deployed in it. One of the easiest ways to do this is to leverage the functionality of the Prometheus Metrics Server. Using the following steps, we’ll install the Prometheus Stack for Kubernetes Helm chart so that we can leverage Prometheus.
Add the Prometheus Community chart repository to the local cache.
helm repo add prometheus-community https://prometheus-community.github.io/helm-charts \
  && helm repo update
Run the command below to install the Prometheus Kubernetes Stack Helm chart.
helm install -n monitoring prometheus prometheus-community/kube-prometheus-stack \
  --set tolerations[0].key=nvidia.com/gpu \
  --set tolerations[0].operator=Exists \
  --set tolerations[0].effect=NoSchedule
[!Note] The above command sets toleration values which allow for the deployment of a pod onto a node with a matching taint. See this document’s prerequisites for the taints this document expected to have been applied to GPU nodes in the cluster.
NVIDIA Data Center GPU Manager (DCGM) Exporter#
The best solution for management of GPUs in your cluster is NVIDIA DCGM(DCGM). However, for this example we do not need the entirety of the DCGM stack. Instead, we’ll use the steps below to install just the DCGM Exporter to enable the collection of GPU metrics in your cluster.
Add the NVIDIA DCGM chart repository to the local cache.
helm repo add nvidia-dcgm https://nvidia.github.io/dcgm-exporter/helm-charts \
  && helm repo update
Use the YAML file below to install the DCGM Exporter.
The contents above were generated using
helm show values nvidia-dcgm/dcgm-exporterand then modified specifically for Triton Server autoscaling.Install the DCGM Exporter Helm chart using the following command.
helm install -n monitoring dcgm-exporter nvidia-dcgm/dcgm-exporter --values nvidia_dcgm-exporter_values.yaml
Connect DCGM and Triton Metrics to Prometheus#
We need to provide a mechanism that will export the metrics collected by Prometheus Server and make them available to Kubernetes’ Horizontal Pod Autoscaler service. The steps below will setup a Prometheus Adapter that creates a custom metrics service API which the HPA service can use to read metrics from Prometheus.
Run the command below to install the Prometheus Adapter Helm chart.
helm install -n monitoring prometheus-adapter prometheus-community/prometheus-adapter \
  --set metricsRelistInterval=6s \
  --set customLabels.monitoring=prometheus-adapter \
  --set customLabels.release=prometheus \
  --set prometheus.url=http://prometheus-kube-prometheus-prometheus \
  --set additionalLabels.release=prometheus
To verify that the adapter is installed and configured correctly, wait for at least 60 seconds and then run the following command. It is important to note that here is a noticeable delay between the adapter being installed and the availability of custom metrics.
kubectl get --raw /apis/custom.metrics.k8s.io/v1beta1
If the command fails, wait longer and retry. If the command fails for more than a few minutes then the adapter is misconfigured and will require intervention.
Triton Metrics Prometheus Rule#
Prometheus rules provide a mechanism for generation of metrics data using a formula that operates on data being collected by Prometheus. We’ll create a set of rules specific to Triton Server which generate metrics useful for autoscaling.
Use the YAML contents below to create a file named
triton-metrics_prometheus-rule.yaml.Run the following command to create the necessary Prometheus Rule in the cluster. Note that the rule will be created in the namespace of your current context, usually
default. If you prefer to install it in a different namespace you can either update your context or add-n <desired_namespace>to the command.kubectl apply -f ./triton-metrics_prometheus-rule.yaml
In all of value files for the example Helm chart, the horizontal-pod autoscaler is configured to use the
triton:queue_compute:ratio metric provided by the above rules.
The benefit of using this metric is that it is hardware and model independent since it measures the ratio between the time a
request spends in the inference queue to the time it takes to complete once it has left the queue.
This kind of metric allows the performance of models on diverse hardware to be compared to each other.
If absolute response times are a more important metric the triton:request_duration:average or
triton:compute_duration:average metrics would more likely meet this requirement.
NFS Creation#
In order to download models from Hugging Face, create TRT-LLM models you need a NFS which your pods can access. We do not prescribe any particular NFS, for this demonstation we will use Amazon EFS (Elastic File System) To enable multiple pods deployed to multiple nodes to load shards of the same model so that they can used in coordination to serve inference request too large to loaded by a single GPU, we’ll need a common, shared storage location. In Kubernetes, these common, shared storage locations are referred to as persistent volumes. Persistent volumes can be volume mapped in to any number of pods and then accessed by processes running inside of said pods as if they were part of the pod’s file system. We will be using EFS as persistent volume.
Additionally, we will need to create a persistent-volume claim which can use to assign the persistent volume to a pod.
1. Create an IAM role#
Follow the steps to create an IAM role for your EFS file system: https://docs.aws.amazon.com/eks/latest/userguide/efs-csi.html#efs-create-iam-resources. This role will be used later when you install the EFS CSI Driver.
2. Install EFS CSI driver#
Install the EFS CSI Driver through the Amazon EKS add-on in AWS console: https://docs.aws.amazon.com/eks/latest/userguide/efs-csi.html#efs-install-driver. Once it’s done, check the Add-ons section in EKS console, you should see the driver is showing Active under Status.
3. Create EFS file system#
Follow the steps to create an EFS file system: https://github.com/kubernetes-sigs/aws-efs-csi-driver/blob/master/docs/efs-create-filesystem.md. Make sure you mount subnets in the last step correctly. This will affect whether your nodes are able to access the created EFS file system.
4. Test NFS#
Follow the steps to check if your EFS file system is working properly with your nodes: https://github.com/kubernetes-sigs/aws-efs-csi-driver/tree/master/examples/kubernetes/multiple_pods. This test is going to mount your EFS file system on all of your available nodes and write a text file to the file system.
5. Create an PVC for the created EFS file system#
We have provided an example in here: pvc_aws. This folder contains three files: pv_aws.yaml, claim_aws.yaml, and storageclass_aws.yaml. Make sure you modify the pv_aws.yaml file and change the volumeHandle value to your own EFS file system ID.
pv.yaml
apiVersion: v1
kind: PersistentVolume
metadata:
  name: efs-pv
spec:
  capacity:
    storage: 200Gi
  volumeMode: Filesystem
  accessModes:
    - ReadWriteMany
  persistentVolumeReclaimPolicy: Retain
  storageClassName: efs-sc
  csi:
    driver: efs.csi.aws.com
    volumeHandle: fs-0cf1f987d6f5af59c # Change to your own ID
claim.yaml
apiVersion: v1
kind: PersistentVolumeClaim
metadata:
  name: efs-claim
spec:
  accessModes:
    - ReadWriteMany
  storageClassName: efs-sc
  resources:
    requests:
      storage: 200Gi
storageclass.yaml
kind: StorageClass
apiVersion: storage.k8s.io/v1
metadata:
  name: efs-sc
provisioner: efs.csi.aws.com
Run the below command to deploy:
kubectl apply -f pvc/
6. Edit cliamName in deployment.yaml to point to your chart/templates/deployment.yaml#
persistentVolumeClaim:
  claimName: nfs-claim-autoscaling-2 (Edit your claimName)
Triton Preparation#
Pod Initialization Script#
Create a Python file with the content below named
server.py.This solution could be further improved by adding a network storage location shared by all nodes in a cluster that could be used to globally cache per model/GPU plan and engine files. Subsequent pod starts on new nodes with the same GPU could download the pregenerated files instead generating them locally. This could save significant time depending on the delta between the time to download the files instead of generating them (likely several seconds at least).
Model Preparation Steps:#
To build the TRT-LLM engine and set up Triton model repository inside the compute node use the following steps:
Modify the
setup_ssh_nfs.yamlfileWe use the
setup_ssh_nfs.yamlfile which does “sleep infinity” to set up ssh access inside the compute node along with EFS.Adjust the following values:
image: change image tag. Default is 24.08 which supports TRT-LLM v0.12.0nvidia.com/gpu: set to the number of GPUs per node in your cluster, adjust in both the limits and requests sectionclaimName: set to your EFS pvc name
SSH into compute node and build TRT-LLM engine
Deploy the pod:
cd multinode_helm_chart/
kubectl apply -f setup_ssh_nfs.yaml
kubectl exec -it setup-ssh-nfs -- bash
Clone the Triton TRT-LLM backend repository:
cd <EFS_mount_path>
git clone https://github.com/triton-inference-server/tensorrtllm_backend.git -b v0.12.0
cd tensorrtllm_backend
git lfs install
git submodule update --init --recursive
Build a Llama3-8B engine with Tensor Parallelism=1, Pipeline Parallelism=1
cd tensorrtllm_backend/tensorrt_llm/examples/llama

pip install -U "huggingface_hub[cli]"
huggingface-cli login
huggingface-cli download meta-llama/Meta-Llama-3-8B --local-dir ./Meta-Llama-3-8B --local-dir-use-symlinks False

python3 convert_checkpoint.py --model_dir ./Meta-Llama-3-8B \
                            --output_dir ./converted_checkpoint \
                            --dtype bfloat16 \
                            --tp_size 1 \
                            --pp_size 1 \
                            --load_by_shard \
                            --workers 1

trtllm-build --checkpoint_dir ./converted_checkpoint \
            --output_dir ./output_engines \
            --max_num_tokens 4096 \
            --max_input_len 65536 \
            --max_seq_len 131072 \
            --max_batch_size 8 \
            --use_paged_context_fmha enable \
            --workers 1
Prepare the Triton model repository
cd <EFS_MOUNT_PATH>/tensorrtllm_backend
mkdir triton_model_repo

cp -r all_models/inflight_batcher_llm/ensemble triton_model_repo/
cp -r all_models/inflight_batcher_llm/preprocessing triton_model_repo/
cp -r all_models/inflight_batcher_llm/postprocessing triton_model_repo/
cp -r all_models/inflight_batcher_llm/tensorrt_llm triton_model_repo/

python3 tools/fill_template.py -i triton_model_repo/preprocessing/config.pbtxt tokenizer_dir:<PATH_TO_TOKENIZER>,tokenizer_type:llama,triton_max_batch_size:8,preprocessing_instance_count:1
python3 tools/fill_template.py -i triton_model_repo/tensorrt_llm/config.pbtxt triton_backend:tensorrtllm,triton_max_batch_size:8,decoupled_mode:True,max_beam_width:1,engine_dir:<PATH_TO_ENGINES>,enable_kv_cache_reuse:False,batching_strategy:inflight_batching,max_queue_delay_microseconds:0
python3 tools/fill_template.py -i triton_model_repo/postprocessing/config.pbtxt tokenizer_dir:<PATH_TO_TOKENIZER>,tokenizer_type:llama,triton_max_batch_size:8,postprocessing_instance_count:1
python3 tools/fill_template.py -i triton_model_repo/ensemble/config.pbtxt triton_max_batch_size:8
[!Note] Be sure to substitute the correct values for
<PATH_TO_TOKENIZER>and<PATH_TO_ENGINES>in the example above. Keep in mind that the tokenizer, the TRT-LLM engines, and the Triton model repository should be in a shared file storage between your nodes. They’re required to launch your model in Triton. For example, if using AWS EFS, the values for<PATH_TO_TOKENIZER>and<PATH_TO_ENGINES>should be respect to the actutal EFS mount path. This is determined by your persistent-volume claim and mount path in chart/templates/deployment.yaml. Make sure that your nodes are able to access these files.Delete the pod
exit
kubectl delete -f setup_ssh_nfs.yaml
Custom Container Image#
Using the file below, we’ll create a custom container image in the next step.
Run the following command to create a custom Triton Inference Server w/ all necessary tools to generate TensorRT-LLM plan and engine files. In this example we’ll use the tag
24.08to match the date portion of24.08-trtllm-python-py3from the base image.docker build \ --file ./triton_trt-llm.containerfile \ --rm \ --tag triton_trt-llm:24.08 \ .
Upload the Container Image to a Cluster Visible Repository.
In order for your Kubernetes cluster to be able to download out new container image, it will need to be pushed to a container image repository that nodes in your cluster can reach. In this example, we’ll use the fictional
nvcr.io/examplerepository for demonstration purposes. You will need to determine which repositories you have write access to that your cluster can also access.First, re-tag the container image with the repository’s name like below.
docker tag \
  triton_trt-llm:24.08 \
  nvcr.io/example/triton_trt-llm:24.08
Next, upload the container image to your repository.
docker push nvcr.io/example/triton_trt-llm:24.08
Kubernetes Pull Secrets#
If your container image repository requires credentials to download images from, then you will need to create a Kubernetes
docker-registry secret.
We’ll be using the nvcr.io container image repository example above for demonstration purposes.
Be sure to properly escape any special characters such as $ in the password or username values.
Use the command below to create the necessary secret. Secrets for your repository should be similar, but not be identical to the example below.
kubectl create secret docker-registry ngc-container-pull \
  --docker-password='dGhpcyBpcyBub3QgYSByZWFsIHNlY3JldC4gaXQgaXMgb25seSBmb3IgZGVtb25zdHJhdGlvbiBwdXJwb3Nlcy4=' \
  --docker-server='nvcr.io' \
  --docker-username='\$oauthtoken'
The above command will create a secret in your cluster named
ngc-container-pull. You can verify that the secret was created correctly using the following command and inspecting its output for the secret you’re looking for.kubectl get secrets
Ensure the contents of the secret are correct, you can run the following command.
kubectl get secret/ngc-container-pull -o yaml
You should see an output similar to the following.
apiVersion: v1
data:
  .dockerconfigjson: eyJhdXRocyI6eyJudmNyLmlvIjp7InVzZXJuYW1lIjoiJG9hdXRodG9rZW4iLCJwYXNzd29yZCI6IlZHaHBjeUJwY3lCdWIzUWdZU0J5WldGc0lITmxZM0psZEN3Z2FYUWdhWE1nYjI1c2VTQm1iM0lnWkdWdGIyNXpkSEpoZEdsdmJpQndkWEp3YjNObGN5ND0iLCJhdXRoIjoiSkc5aGRYUm9kRzlyWlc0NlZrZG9jR041UW5CamVVSjFZak5SWjFsVFFubGFWMFp6U1VoT2JGa3pTbXhrUTNkbllWaFJaMkZZVFdkaU1qVnpaVk5DYldJelNXZGFSMVowWWpJMWVtUklTbWhrUjJ4MlltbENkMlJZU25kaU0wNXNZM2swWjFWSGVHeFpXRTVzU1VjMWJHUnRWbmxKU0ZaNldsTkNRMWxZVG14T2FsRm5aRWM0WjJGSGJHdGFVMEo1V2xkR2MwbElUbXhaTTBwc1pFaE5hQT09In19fQ==
kind: Secret
metadata:
  name: ngc-container-pull
  namespace: default
type: kubernetes.io/dockerconfigjson
The value of
.dockerconfigjsonis a base-64 encoded string which can be decoded into the following.{ "auths": { "nvcr.io": { "username":"$oauthtoken", "password":"VGhpcyBpcyBub3QgYSByZWFsIHNlY3JldCwgaXQgaXMgb25seSBmb3IgZGVtb25zdHJhdGlvbiBwdXJwb3Nlcy4gUGxlYXNlIG5ldmVyIHVzZSBCYXNlNjQgdG8gaGlkZSByZWFsIHNlY3JldHMh", "auth":"JG9hdXRodG9rZW46VkdocGN5QnBjeUJ1YjNRZ1lTQnlaV0ZzSUhObFkzSmxkQ3dnYVhRZ2FYTWdiMjVzZVNCbWIzSWdaR1Z0YjI1emRISmhkR2x2YmlCd2RYSndiM05sY3k0Z1VHeGxZWE5sSUc1bGRtVnlJSFZ6WlNCQ1lYTmxOalFnZEc4Z2FHbGtaU0J5WldGc0lITmxZM0psZEhNaA==" } } }
You can use this compact command line to get the above output with a single command.
kubectl get secret/ngc-container-pull -o json | jq -r '.data[".dockerconfigjson"]' | base64 -d | jq
[!Note] The values of
passwordandauthare also base-64 encoded string. We recommend inspecting the values of the following values:Value of
.auths['nvcr.io'].username.Base64 decoded value of
.auths['nvcr.io'].password.Base64 decoded value of
.auths['nvcr.io'].auths.
Triton Deployment#
Deploying Single GPU Models#
Deploying Triton Server with a model that fits on a single GPU is straightforward using the steps below.
Create a custom values file with required values:
Container image name.
Model name.
Supported / available GPU(s).
Image pull secrets (if necessary).
The provided sample Helm chart include several example values files such as llama-3-8b_values.yaml.
Deploy LLM on Triton + TRT-LLM.
Apply the custom values file to override the exported base values file using the command below, and create the Triton Server Kubernetes deployment.
[!Tip] The order that the values files are specified on the command line is important with values are applied and override existing values in the order they are specified.
helm install <installation_name> \
  --values ./chart/values.yaml \
  --values ./chart/<custom_values>.yaml \
  --set 'triton.image.name=<custom_image_name>' \
  ./chart/.
[!Important] Be sure to substitute the correct values for
<installation_name>and<custom_values>in the example above.Verify the Chart Installation.
Use the following commands to inspect the installed chart and to determine if everything is working as intended.
kubectl get deployments,pods,hpa,services,podmonitors --selector='app=<installation_name>'
[!Important] Be sure to substitute the correct value for
<installation_name>in the example above.You should output similar to below (assuming the installation name of “llama-3”):
NAME                      READY   UP-TO-DATE   AVAILABLE
deployment.apps/llama-3   0/1     1            0

NAME                          READY   STATUS    RESTARTS
pod/llama-3-7989ffd8d-ck62t   0/1     Pending   0

NAME                                          REFERENCE            TARGETS   MINPODS   MAXPODS   REPLICAS
horizontalpodautoscaler.autoscaling/llama-3   Deployment/llama-3   0/1       1         8         1

NAME              TYPE        CLUSTER-IP      EXTERNAL-IP   PORT(S)
service/llama-3   ClusterIP   10.100.23.237   <none>        8000/TCP,8001/TCP,8002/TCP

NAME
podmonitor.monitoring.coreos.com/llama-3
HPA
TARGETSmight show as<unknown>/1. This is not necessarily an issue. It is most likely caused by a lack of client applications sending inference queries to Triton Server. Without inference queries, there are no metrics generated and thus the HPA controller reports the metric’s current values as<unknown>. This issue should resolve itself once clients begin sending inference queries to Triton Server.Uninstalling the Chart
Uninstalling a Helm chart is as straightforward as running the command below. This is useful when experimenting with various options and configurations.
helm uninstall <installation_name>
Deploying Models Too Large for a Single GPU#
Given the memory requirements of some AI models it is not possible to host them using a single device. Triton and TensorRT-LLM provide a mechanism to enable a large model to be hosted by multiple GPU devices working in concert. The provided sample Helm chart provides a mechanism for taking advantage of this capability.
To enable this feature, adjust the model.tensorrtLlm.parallelism.tensor value to an integer greater than 1.
Configuring a model to use tensor parallelism enables the TensorRT-LLM runtime to effectively combine the memory of multiple
GPUs to host a model too large to fit on a single GPU.
Similarly, changing the value of model.tensorrtLlm.parallelism.pipeline will enable pipeline parallelism.
Pipeline parallelism is used to combine the compute capacity of multiple GPUs to process inference requests in parallel.
The number of GPUs required to host the model is equal to product of the values of .tensor and .pipeline.
It is important to note that the GPUs used to host a model must reside on the same node.
[!Note] Combining GPUs which reside on separate nodes is not covered in this guide.
Utilizing Multiple GPU SKUs#
Given the relative limited availability of certain SKUs of GPU, it is not uncommon for services to be required to operate on a mix of GPU hardware. For example, the number of nodes with NVIDIA Hopper based devices might be insufficient to meet load requirements and your clusters may have spare nodes with NVIDIA Ampere based devices. In this scenario, it would make sense to create multiple deployment of the same model using the steps above and placing them all behind a single Kubernetes service for load-balancing needs. Doing so will enable both SKUs of devices to automatically scale independently and provide compute capacity for the service.
To achieve this, we can update the chart to not create a service with our deployment and to include the selector labels
specified by the shared service.
In the example below, we’ll assume the service has already been created and its selector is set to model=llama-3-8b.
helm install llama-3-8b-a100 ./chart/. \
  --values ./chart/values.yaml \
  --values ./chart/llama-3-8b \
  --set 'triton.image.name=<custom_image_name>' \
  --set 'gpu[0]=NVIDIA-A100-SXM4-40GB' \
  --set 'kubernetes.labels[0].model=llama-3-8b' \
  --set 'kubernetes.noService=true'

helm install llama-3-8b-h100 ./chart/. \
  --values ./chart/values.yaml \
  --values ./chart/llama-3-8b \
  --set 'triton.image.name=<custom_image_name>' \
  --set 'gpu[0]=NVIDIA-H100-SXM5-80GB' \
  --set 'kubernetes.labels[0].model=llama-3-8b' \
  --set 'kubernetes.noService=true'
The result will be two deployments in your cluster, both of which are part of your service’s load-balancing pool.
kubectl get deployments --selector='model=llama-3-8b'
NAME                    READY   UP-TO-DATE   AVAILABLE
llama-3-8b-a100         1/1     1            1
llama-3-8b-h100         1/1     1            1
Monitoring Triton in Kubernetes#
Monitoring Triton in Kubernetes can be done using the Prometheus software installed as part of the Prometheus Services section of this document. The installed software includes a Grafana dashboard server. To connect to the Grafana server, we first need to create a networking tunnel from your local workstation into you cluster.
Run the following command to create a networking tunnel from a local machine into the Kubernetes cluster.
kubectl port-forward -n monitoring svc/prometheus-grafana 8080:80
This creates a tunnel from port
8080on your local machine to the Grafana server in the cluster on port80. When successful, you should see output that looks something like the example below.Forwarding from 127.0.0.1:8080 -> 3000 Forwarding from [::1]:8080 -> 3000
Open a web browser and enter
http://http://127.0.0.1:8080/into the address bar.The first time you do this, you will need to login to Grafana. Use the following username and password to complete the login.
Username:
adminPassword:
prom-operator
[!Tip] The above the default username and password for Grafana when it is installed as part of the Prometheus Helm chart.
The first thing we’ll want to do is to create a new custom dashboard. To do this, click on the
+icon in the upper-right of the user interface and selectNew dashboardfrom the dropdown menu.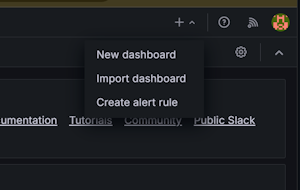
Grafana will prompt you as to how you want to create a new dashboard. Select the
Import dashboardoption.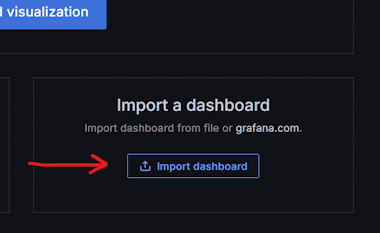
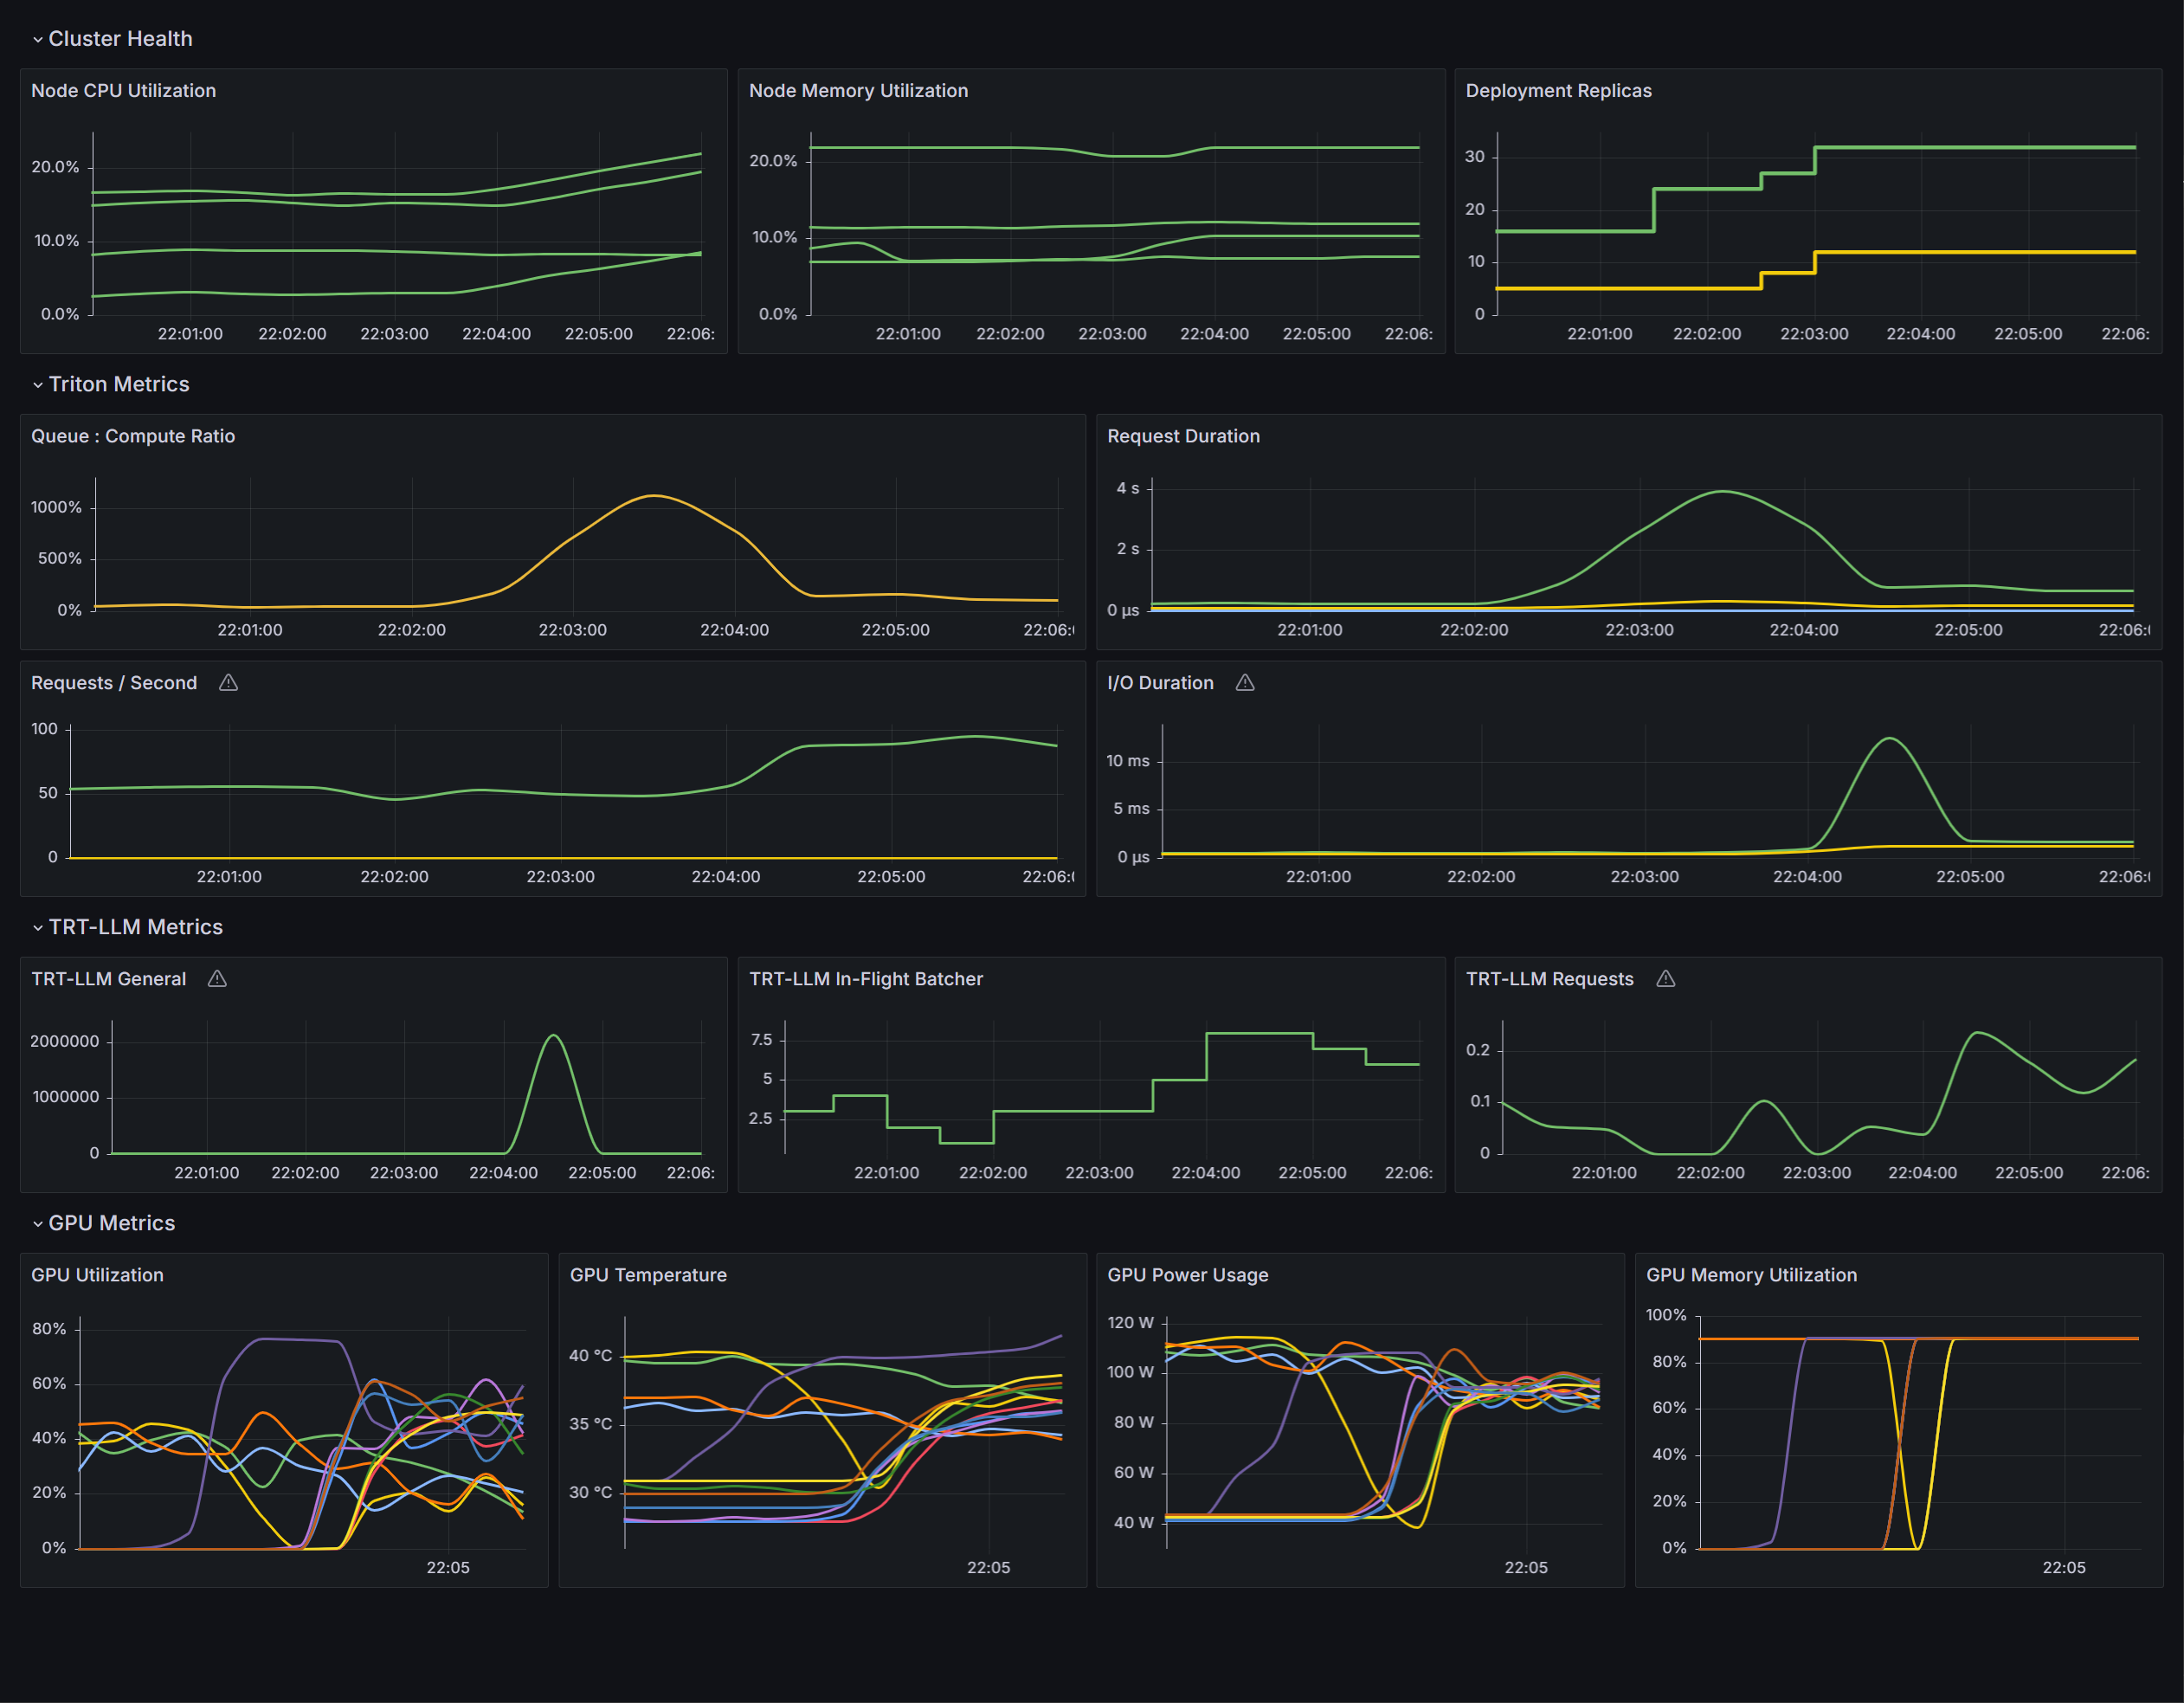
Either copy the content from the provided grafana_inference-metrics_dashboard.json file and paste it into the text box named
Import via dashboard JSON model, or upload the file using the user interfacesUpload dashboard JSON filetool.Once you’ve created the new dashboard, you should see something that looks like the image below.
Once the dashboard has been setup, you will be able to visualize the current state of your cluster. These visualizations can provide insight into why we’ve chosen to use the queue:compute ratio instead of GPU utilization as the metric used to control the behavior of the horizontal pod autoscaler.
GPU Utilization |
Queue-to-Compute Ratio |
|---|---|
|
|
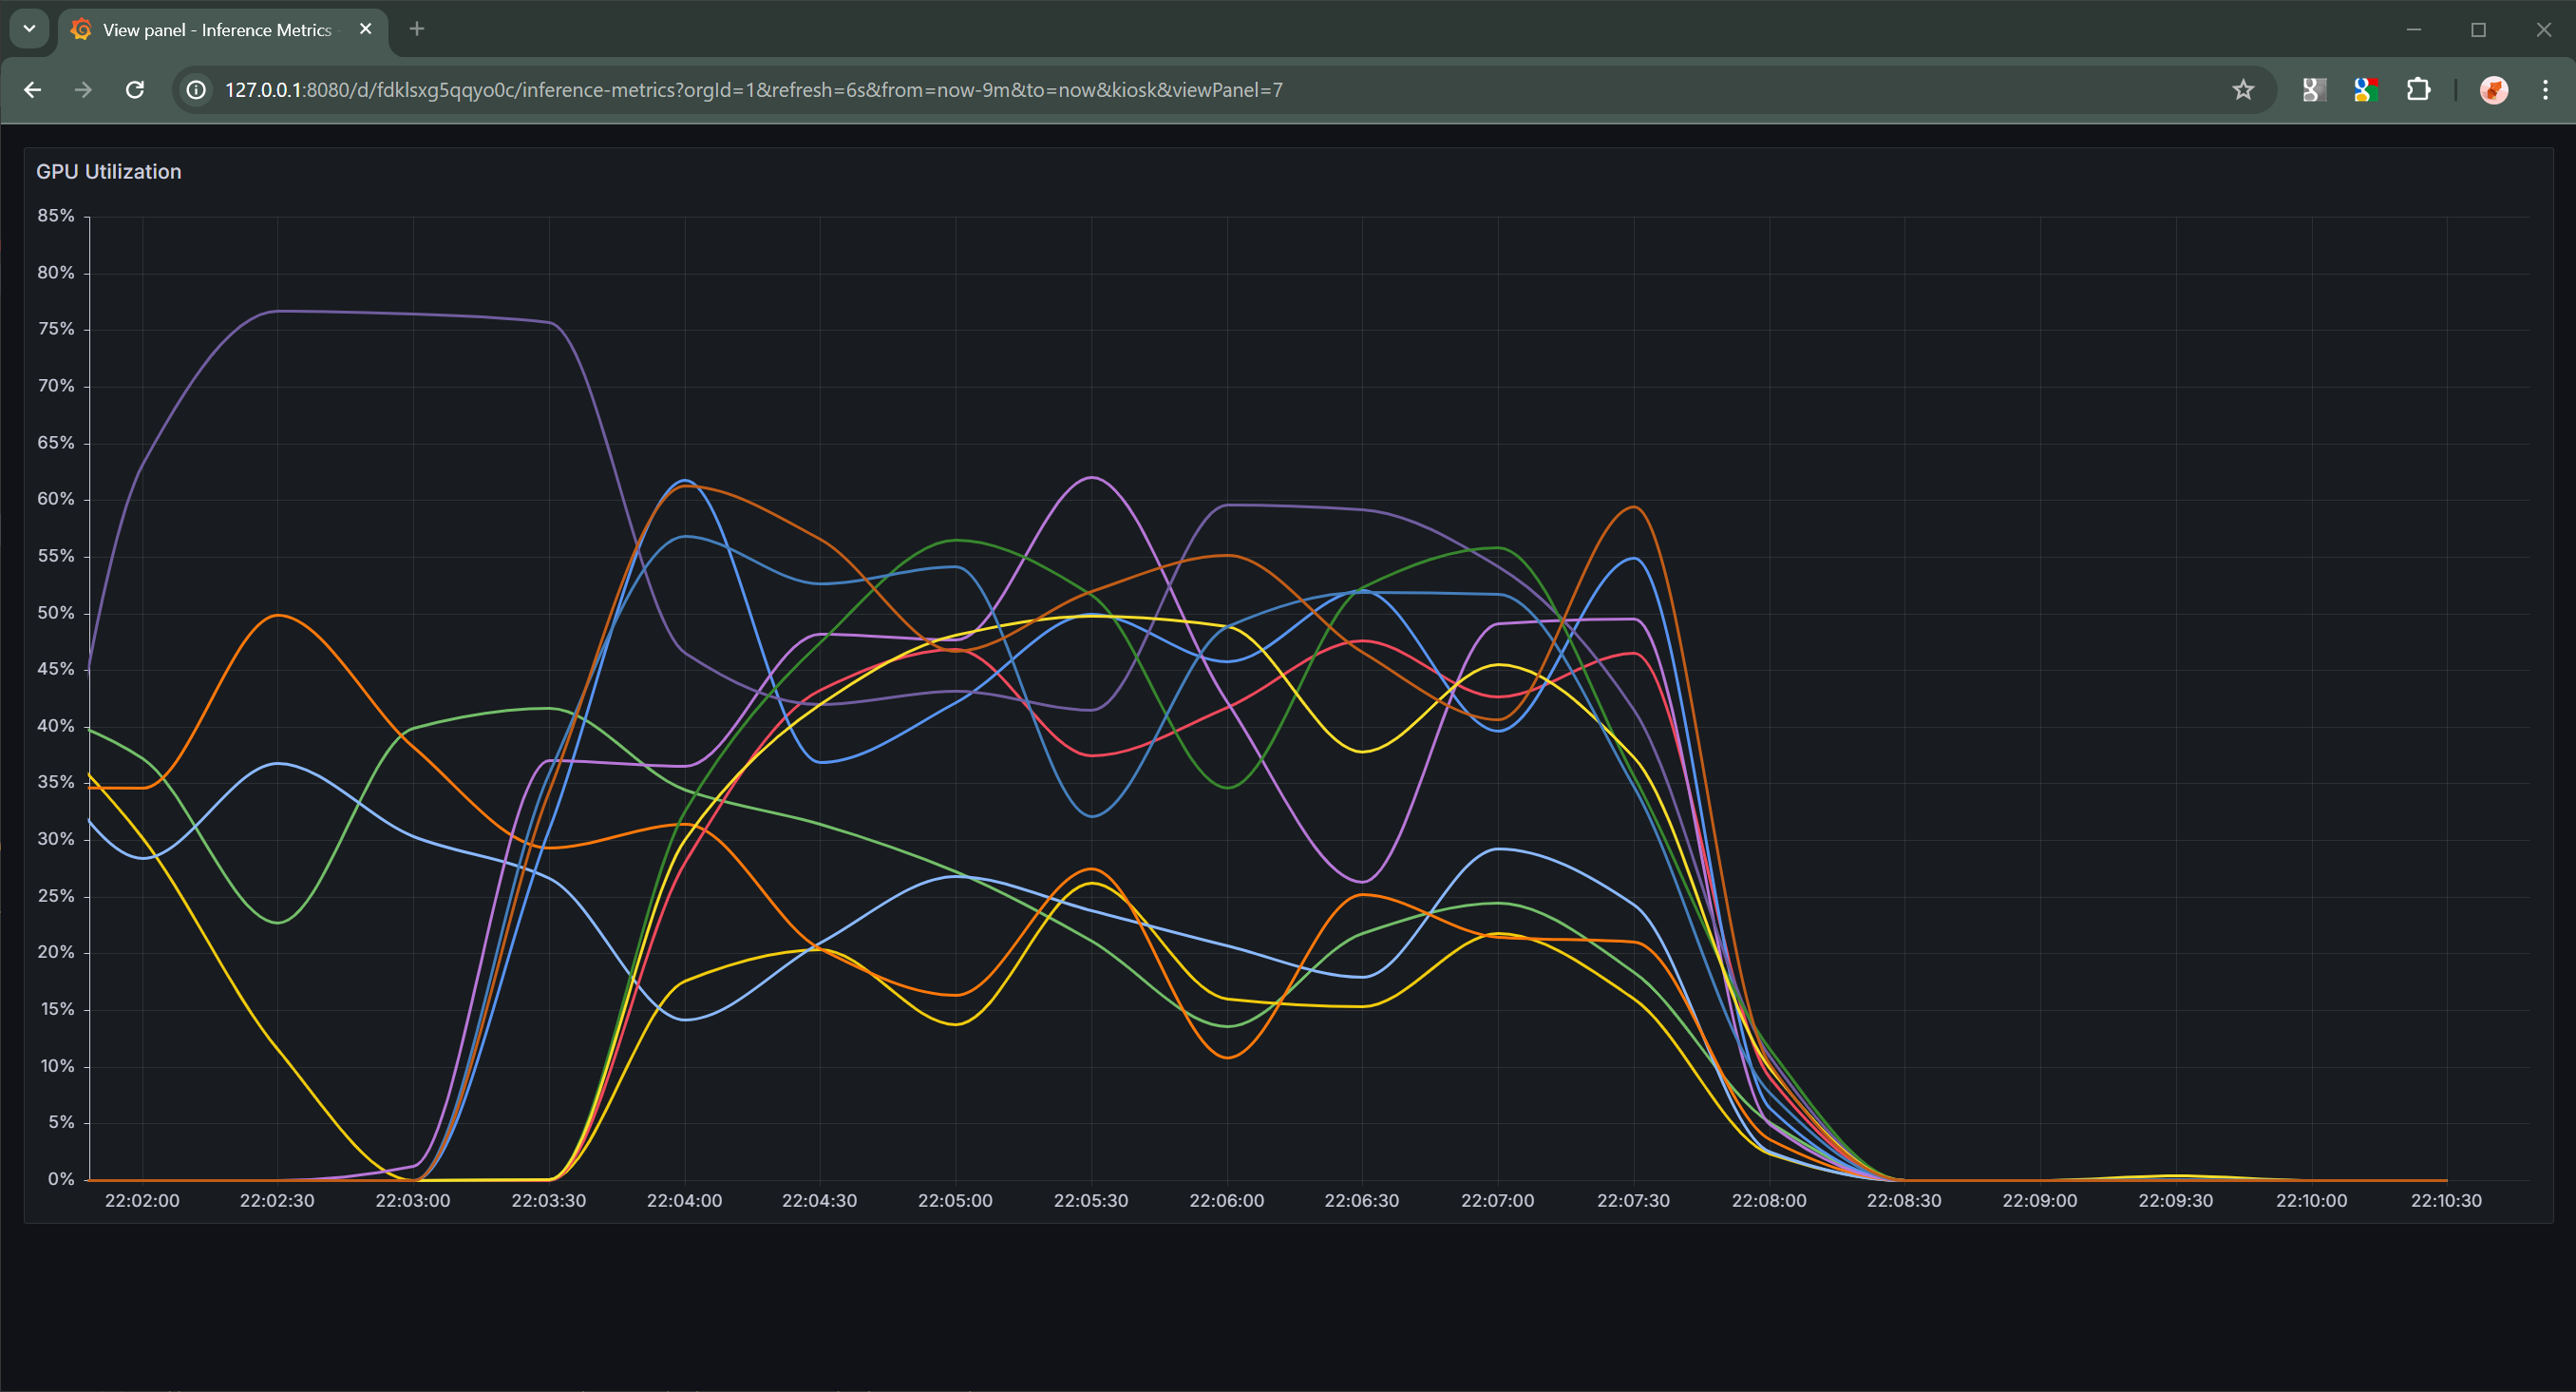
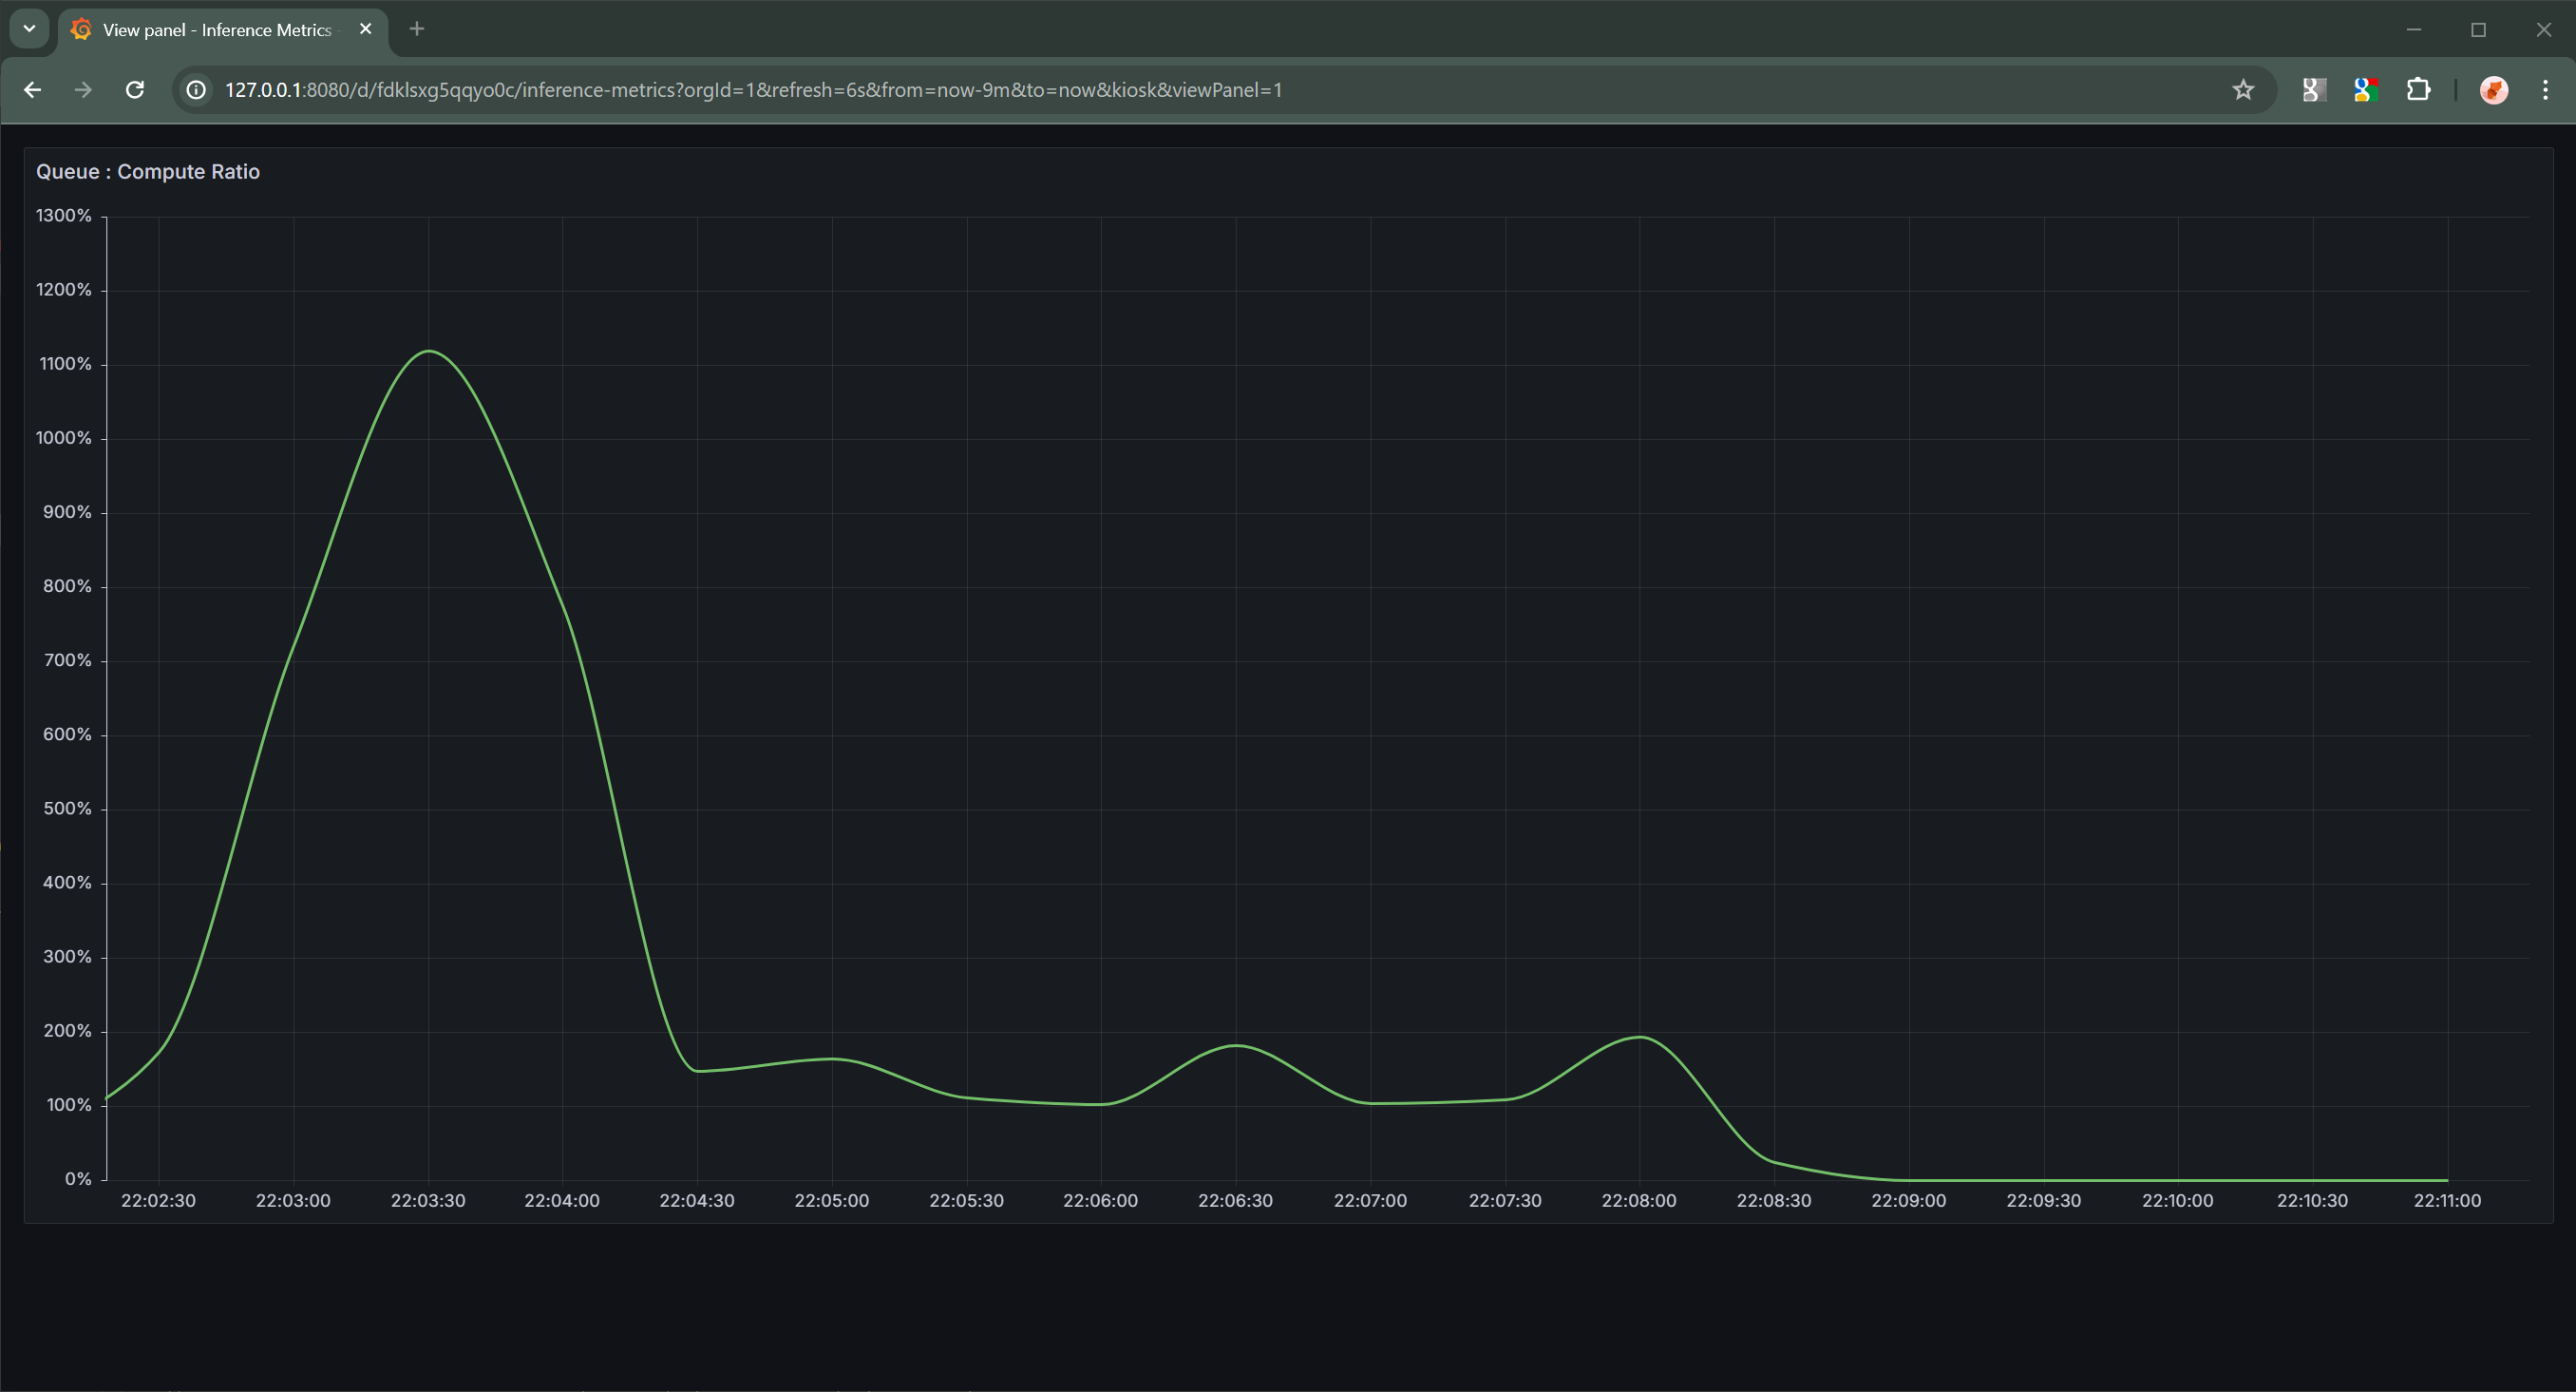
The above graphs are over the same period of time. Comparing the two clearly shows that the ratio graph is a cleaner indication of when additional resources are necessary to meet current inference demands, whereas the GPU utilization graph contains too much noise to produce a clear signal for the horizontal pod autoscaler to operate on.
Developing this Guide#
During the development of this guide, I ran into several problems that needed to be solved before we could provide a useful guide. This section will outline and describe the issues I ran into and how we resolved them.
This document was developed using a Kubernetes cluster provided by Amazon EKS. Clusters provisioned on-premises or provided by other cloud service providers such as Azure AKS or GCloud GKE might require modifications to this guide.
Metrics Configuration is as Much an Art as a Science#
During the development of this guide I spent an inordinate amount of time figuring out every variable, setting, and configuration required to get all of the necessary and useful metrics. Much of the effort was spent on discovering the intricacies of Kubernetes’ HPA controller and how it consumed metrics.
Initially, I was unable to get the HPA controller to recognize the custom metrics I wanted to use to control pod autoscaling.
Ultimately I discovered that the v2 HPA controller had been automatically configured when
Prometheus Stack for Kubernetes was installed to use the custom.metrics.k8s.io/v1beta1
endpoint provided by Prometheus.
Run the following command to retrieve the set of metrics provided by the custom.metrics.k8s.io/v1beta1 endpoint.
kubectl get --raw /apis/custom.metrics.k8s.io/v1beta1
The above will return a JSON blob which can be inspected in your favorite IDE. I recommend VSCode because it handles JavaScript and JSON very well, but use the tool that suits you best.
Current metrics values can be queries from the endpoint using a command like below.
kubectl get --raw /apis/custom.metrics.k8s.io/v1beta1/namespaces/default/pod/*/triton:queue_compute:ratio
The above command requests the triton:queue_compute:ratio metric for all pods in the default namespace.
This is almost exactly what Kubernetes v2 HPA controller will do to query the metrics it needs to make autoscaling decisions.
Once I knew this, I was able to experiment with configuration values in the Prometheus and Prometheus Adapter installations as
well as in the Prometheus Rule we created in the above guide until everything “just worked”.
Why This Set of Software Components?#
The set of software packages described in this document is close the minimum viable set of packages without handcrafting custom Helm charts and YAML files for every package and dependency. Is this the only set of packages and components that can be used to make this solution work? Definitely not, there are several alternatives which could meet our requirements. This set of packages and components is just the set I happen to choose for this guide.
Below is a high-level description of why each package is listed in this guide.
NVIDIA Device Plugin for Kubernetes#
Required to enable GPUs to be treated as resources by the Kubernetes scheduler. Without this component, GPUs would not be assigned to containers correctly.
NVIDIA GPU Discovery Service for Kubernetes#
Provides automatic labelling of Kubernetes nodes based on the NVIDIA devices and software available on the node.
Without the provided labels, it would not be possible to specify specific GPU SKUs when deploying models because the
Kubernetes scheduler treats all GPUs as identical (referring to them all with the generic resources name nvidia.com/gpu).
Kubernetes Node Discovery Service#
This is a requirement for the NVIDIA GPU Discovery Service for Kubernetes.
NVIDIA DCGM Exporter#
Provides hardware monitoring and metrics for NVIDIA GPUs and other devices present in the cluster. Without the metrics this provides, monitoring GPU utilization, temperature and other metrics would not be possible.
While Triton Server has the capability to collect and serve NVIDIA hardware metrics, relying on Triton Server to provide this service is non-optimal for several reasons.
Firstly, many processes on the same machine querying the NVIDIA device driver for current state, filtering the results for only values that pertain to the individual process, and serving them via Triton’s open-metrics server is as wasteful as the the number of Triton Server process beyond the first on the node.
Secondly, due to the need to interface with the kernel-mode driver to retrieve hardware metrics, queries get serialized adding additional overhead and latency to the system.
Finally, the rate at which metrics are collected from Triton Server is not the same as the rate at which metrics are collected from the DCGM Exporter. Separating the metrics collection from Triton Server allows for customized metric collection rates, which enables us to further minimize the process overhead placed on the node.
Why is the DCGM Exporter Values File Custom?#
I decided to use a custom values file when installing the DCGM Exporter Helm chart for several reasons.
Firstly, it is my professional opinion that every container in a cluster should specify resource limits and requests. Not doing so opens the node up to a number of difficult to diagnose failure conditions related to resource exhaustion. Out of memory errors are the most obvious and easiest to root cause. Additionally, difficult to reproduce, transient timeout and timing errors caused CPU over-subscription can easily happen when any container is unconstrained and quickly waste an entire engineering team’s time as they attempt to triage, debug, and resolve them.
Secondly, the DCGM Exporter process itself spams error logs when it cannot find NVIDIA devices in the system. This is primarily because the service was originally created for non-Kubernetes environments. Therefore I wanted to restrict which node the exporter would get deployed to. Fortunately, the DCGM Helm chart makes this easy by support node selector options.
Thirdly, because nodes with NVIDIA GPUs have been tainted with the nvidia.com/gpu=present:NoSchedule that prevents any
pod which does not explicitly tolerate the taint from be assigned to the node, I need to add the tolerations to the DCGM
Exporter pod.
Finally, the default Helm chart for DCGM Exporter is missing the required --kubernetes=true option being passed in via
command line options when the process is started.
Without this option, DCGM Exporter does not correctly associate hardware metrics with the pods actually using it, and
there would be mechanism for understand how each pod uses the GPU resources assigned to it.
Prometheus Stack for Kubernetes#
Provides metrics collection and aggregation services for the cluster. While there are other tools capable of providing similar services, we found the Prometheus Stack for Kubernetes was the easiest to install and configure. Additionally, the automatic inclusion of a Grafana based user interface made visualization of the cluster’s current health easier to set up.
Out initial work on this document were based on another metrics service, but we found the configuration of metrics collection from Triton Server and the use of custom metrics to drive horizontal pod autoscaling overly difficult and confusing.
Prometheus Adapter for Kubernetes#
Provides metrics collection from non-standard metrics providers, like Triton Server, which is a requirement when leveraging custom metrics as described in this document.
Why the Custom Values File for Prometheus Adapter?#
I created a custom values file for Prometheus Adapter for very similar reasons to why I created a custom values file for DCGM Exporter. Taints and tolerations, optimized values for metrics collection, and the necessity of providing the correct URL to the deployed Prometheus server.
Why Does the Chart Run a Python Script Instead of Triton Server Directly?#
There are two reasons:
In order to retrieve a model from Hugging Face, convert and optimize it for TensorRT-LLM, and cache it on the host, I decided that pod initialization container was the most straightforward solution.
In order to make the best use of the initialization container I chose to use a custom server.py
Multi-GPU deployments require a rather specialized command line to run, and generating it using Helm chart scripting was not something I wanted to deal with. Leveraging the custom Python script was the logical, and easiest, solution.
Why is the Python Written Like That?#
Because I’m not a Python developer, but I am learning! My background is in C/C++ with plenty of experience with shell scripting languages.
What is the client/ Folder For?#
I decided to include the tools I used to validate this guide, and the deployment definitions in the client/ folder are a key
piece of that effort.
You can use them yourself, if you want to.
All that is required is to run (example for llama-3-8b) kubectl apply -f ./clients/llama-3-8b.yaml to create the
deployment followed by kubectl scale deployment/llama-3-8b --replicas=<number_of_desired_clients>.
As you increase the number of clients generating inference requests for a given Triton Server deployment, load will increase on the server and the queue-to-compute ratio will eventually cause the horizontal pod autoscaler to increase the number of Triton Server instancing handle requests until the desired ratio is achieved.
Decreasing the number of clients will have the inverse effect and reduce the number of Triton Server instances deployed.
[!Note] It is important to use the
containers/client.containerfileto build a client container image before attempting to create a client deployment in your cluster. Just like when building thecontainers/triton_trt-llm.containerfile, the image will need to hosted somewhere the cluster’s machines are able to download it from.
Why Doesn’t this Guide Include Load Balancer Instructions?#
Experiments with specialized load balancers, that can utilize pod metrics to determine which instance of Triton Server is the best instance to send new work to, showed modest-at-best improvements over the “round robin” system provided by the Kubernetes’ networking layer via kube-proxy. Since kube-proxy is required for every network operation in a cluster anyways, leveraging the existing solution was a more optimal solution because it avoided adding even more complexity without a justifiable value.
Results in your environment could very well be different. I encourage you to experiment with specialized load balancers to determine the best solution for your workloads.
Software versions featured in this document:
Triton Inference Server v2.45.0 (24.08-trtllm-python-py3)
TensorRT-LLM v0.9.0
NVIDIA Device Plugin for Kubernetes v0.15.0
NVIDIA GPU Discovery Service for Kubernetes v0.8.2
NVIDIA DCGM Exporter v3.3.5
Kubernetes Node Discovery Service v0.15.4
Prometheus Stack for Kubernetes v58.7.2
Prometheus Adapter for Kubernetes v4.10.0
Author: J Wyman, System Software Architect, AI & Distributed Systems
Copyright © 2024, NVIDIA CORPORATION. All rights reserved.