Enterprise Lifecycle Integration#
How to Use This Information#
This section provides information on the anticipated uses and limitations of this information.
Intended Audience#
This information is written for the following audience:
Enterprise IT administrators and endpoint operations teams
Platform engineering or SRE teams operating fleets at scale
Security operations teams that require evidence-driven workflows
Support and escalation teams that need standardized diagnostics artifacts
Document Scope#
The following are within the scope of this document.
Lifecycle-driven operational playbooks. For example, the following workflow:
Procure → Provision → Monitor → Maintain → Respond → Retire
Agentless remote execution model (SSH) with a strict stdout JSON contract
Evidence minimization and artifact handling patterns
Wrapper patterns for enterprise platforms (for example, job systems, orchestration, and configuration management)
The following are not within the scope of this document.
Prescriptive identity architecture (for example, IAM design, key management, and PKI)
Organization-specific network segmentation and firewall policy
Business or legal policy decisions (such as retention durations and legal hold workflows)
Detailed application-layer configuration beyond manageability requirements
Detailed ISO repack, USB
OEMDATAlayout, and cloud-init seed procedures (see Custom Installation with cloud-init)
Document Conventions#
This document uses the following conventions:
Collectors are read-only tools safe to run frequently and at high concurrency.
Controllers change state and must be gated by changing windows, rings or waves, and validation.
Tools return exactly one bounded JSON document on stdout per invocation.
Large outputs and deep evidence are stored as artifacts; stdout returns pointers only.
When you see inline code, it represents literal strings, such as file names, flags, fields, or paths.
Operational Guardrails#
Note: Read this before running controllers.
The following are guardrails to consider.
Run controllers only in approved change windows with staged rollouts (for example pilot → waves → broad).
Keep stdout JSON bounded to avoid platform truncation.
Treat artifact creation as on-demand; store and retain artifacts per policy.
Separate transport or auth failures (platform layer) from tool failures and endpoint health failures.
Support Boundaries and Operational Responsibilities#
This section clarifies what is provided and supported as part of the DGX Spark manageability baseline versus what remains the responsibility of the enterprise IT environment. It is intended to reduce ambiguity during deployment, escalation, and long-term operations.
Supported Baseline Posture#
Supported Baseline (high-level)#
DGX Spark enterprise manageability is designed and validated against the supported baseline OS image (DGX OS).
Baseline Topic |
Guidance |
|---|---|
OS baseline |
DGX OS is the supported baseline for the guide’s operational contract. |
Driver stack |
Driver behavior, versions, and compatible combinations are validated relative to the baseline. |
Firmware alignment |
Firmware inventory and update posture are interpreted relative to the baseline and platform capabilities. |
Tooling |
Production tools installed into DGX_spark_management/bin/ are intended for fleet automation. |
Reference scripts |
Landscape scripts are reference implementations and may require adaptation for production governance. |
Shipped Software Baseline and SBOM Source#
For DGX Spark Founders Edition, customers who require a software inventory or SBOM can generate one from the DGX Spark System Recovery Image. The recovery image represents the recovery media to reset to factory settings for the latest software image.
For DGX Spark systems from other manufacturers, use the recovery image or software delivery process provided by the respective OEM. OEM variant images might differ from the DGX Spark Founders Edition recovery baseline.
For the recovery media download and recovery procedure, refer to System Recovery. For current component version information, refer to DGX Spark Release Notes.
Management Platform Support Posture#
Canonical Landscape is the primary recommended management platform for DGX Spark, and its license is included as part of the Ubuntu Pro entitlement. Landscape provides user management, policy deployment, and OS, firmware, and driver updates from a local repository. For enrollment steps, see Ubuntu Pro and Landscape client enrollment.
In addition, ecosystem tools such as Ansible, Puppet, Tanium, and others may offer ARM64‑capable agents that can be used for broader fleet management, including approval workflows and rollback strategies. These alternatives are supported solely by their respective vendors. Any integration examples referenced in this document do not imply NVIDIA support or validation.
Reimaging Posture#
Reimaging may be required in certain customer workflows, but it has consequences for predictability and supportability.
Reimaging Posture#
Reimaging away from the supported baseline OS can change the behavior across drivers and firmware.
Scenario |
Operational Expectation |
|---|---|
Baseline DGX OS |
Predictable behavior: Spark Manageability Guide playbooks apply directly. |
Baseline and approved updates |
Predictable within validated update channels; confirm before and after evidence. |
Non-baseline OS image |
Higher variance; validate collectors and controllers; adjust wrappers and evidence paths as needed. |
Mixed fleet baselines |
Increase drift and support complexity; maintain baseline identity records per ring or group. |
Division of Responsibility (NVIDIA vs Enterprise IT)#
NVIDIA Provides (Typical) |
Enterprise IT Owns (Typical) |
|---|---|
DGX OS baseline image and guidance |
Identity strategy, authentication, RBAC, and secrets management |
Reference tools for inventory, diagnostics and update control |
Orchestration platform selection, job packaging, scheduling, and rings and waves |
Reference scripts demonstrating platform patterns (Landscape) |
Change management, approvals, and maintenance windows |
Evidence paths and recommended minimization model |
Artifact storage, retention policies, legal hold, and ticket linkage |
Escalation guidance and support interfaces |
Network segmentation, firewall rules, and access pathways |
Controller Class |
Minimum Governance Expectation |
Update control (spark_updatectl.py) |
Change window with ring rollout and precheck and postcheck evidence. Rollback awareness is retained. |
Diagnostics bundles (spark_diagctl.py bundle modes) |
On-demand only. Artifacts are handled through evidence store. Ticket linkage is recommended. |
DGX Spark Overview, Enterprise Challenges, Lifecycle Backbone, and the JSON/Agentless SSH#
DGX Spark is being introduced into environments that already have mature endpoint operations. This section establishes a lifecycle-following framework and a simple operational contract so enterprise tooling can manage DGX Spark consistently at fleet scale.
Key Takeaways
Treat DGX Spark as a enterprise endpoint with an appliance mindset.
Standardize on SSH for remote execution and JSON on stdout as the integration contract.
Use artifacts only when deep evidence is required; keep routine results small and bounded.
Capabilities Summary#
This matrix summarizes the current DGX Spark manageability capabilities exposed by this repository. It is intended to help an Enterprise IT administrator quickly understand the following:
What exists today and how it is delivered (installed tool vs reference script)
What evidence is produced (stdout JSON vs artifacts).
How to Read This Table
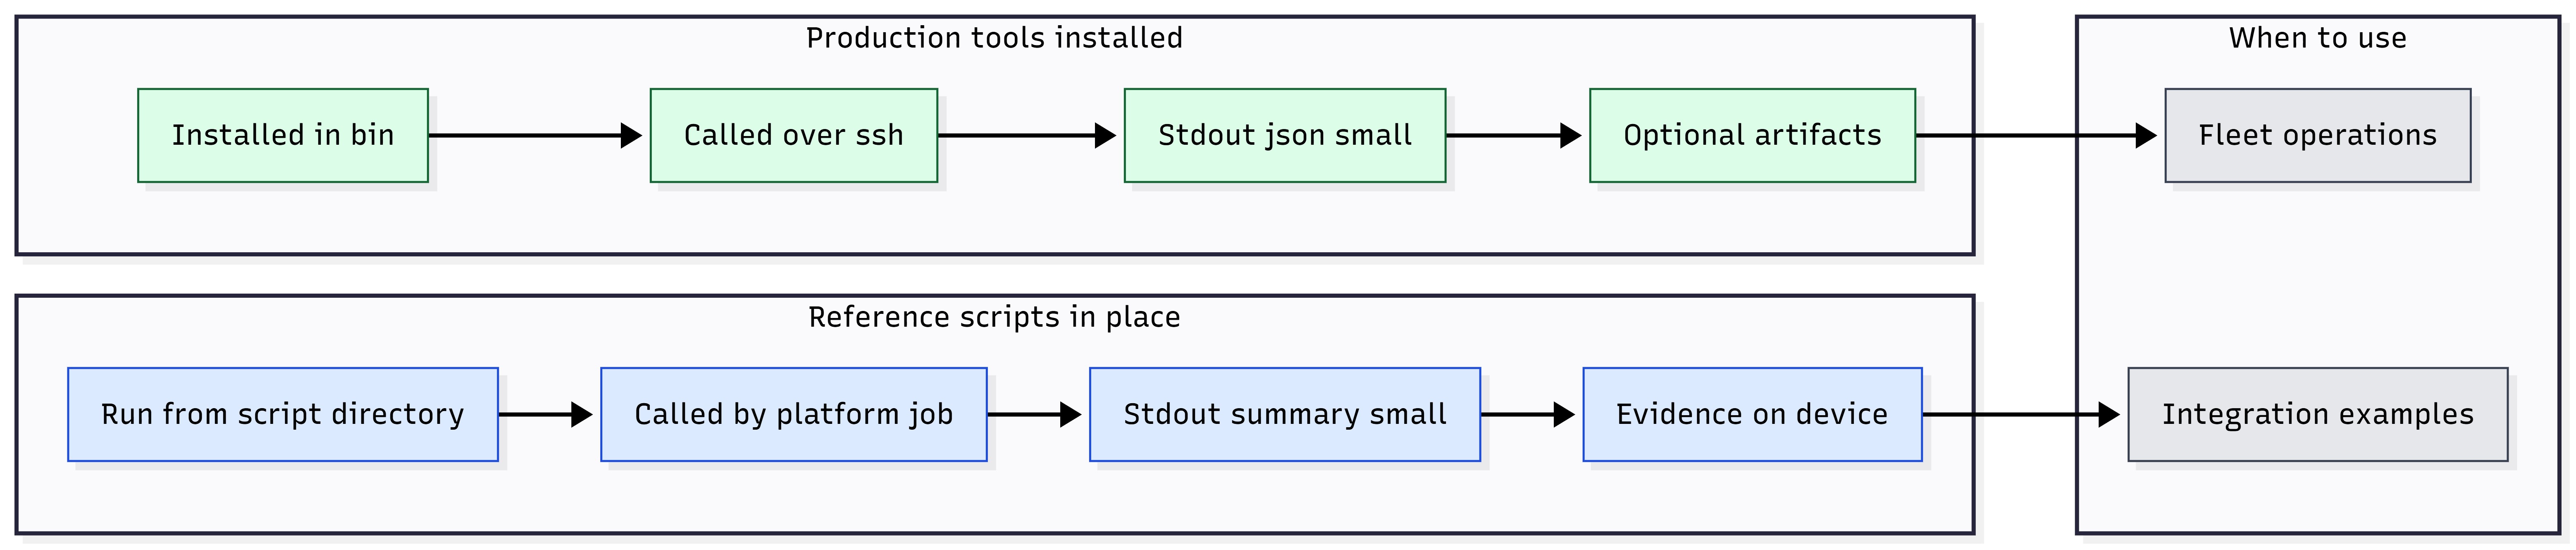
Production (installed): Fleet-ready tooling installed into DGX_spark_management/bin/.
Reference (in-place): Example scripts designed for Canonical Landscape constraints; not installed by default.
Evidence model: stdout JSON is the primary contract; artifacts are generated only when deep evidence is required.
Capability area |
Integration overview |
Delivery |
Primary commands |
Evidence produced |
|---|---|---|---|---|
Identity and asset acceptance |
Capture stable identifiers and an “as-received” acceptance snapshot. |
Production |
|
stdout JSON; optional on-device JSON record |
Hardware configuration inventory |
Enumerate key hardware configuration (CPU/GPU/SSD/NIC/memory). |
Production |
|
stdout JSON; optional on-device JSON record |
Firmware inventory |
Report firmware versions (UEFI/BIOS, NIC, SSD, GPU as available). |
Production |
|
stdout JSON; optional on-device JSON record |
Driver inventory |
Report key driver versions (GPU/NIC/storage/USB as implemented). |
Production |
|
stdout JSON; optional on-device JSON record |
Software inventory |
Enumerate installed software inventories for drift and compliance contexts. |
Production |
|
stdout JSON; optional on-device JSON record |
UEFI-backed tags (optional) |
Read/write UEFI-backed metadata tags for fleet workflows (if enabled). |
Production |
|
stdout JSON (read/write result); optional on-device record |
Health posture and diagnostics (L1) |
Return bounded health posture signals for monitoring and triage. |
Production |
|
stdout JSON summary |
Deep evidence bundles (L2) |
Generate targeted or full diagnostics bundles when escalation requires evidence. |
Production |
|
stdout JSON + artifact pointer(s) |
Reset / reboot context |
Explain reboot/reset reasons for stability correlation and incident triage. |
Production |
|
stdout JSON; optional on-device JSON record |
Controlled SW/FW updates |
Expose update posture and controlled update operations within maintenance windows. |
Production |
|
stdout JSON; optional update evidence artifacts depending on mode |
Landscape reference execution |
Run platform-friendly checks and store per-run evidence under a run directory. |
Reference ( |
|
Short stdout + on-device evidence under |
DGX Spark Overview#
DGX Spark is deployed as an enterprise-managed, locally accelerated AI companion device, often alongside standard PC fleets, to provide on-prem or edge AI compute where latency, privacy, data gravity, or disconnected operations make cloud-only workflows impractical.
In enterprise terms, DGX Spark behaves less like a general-purpose end-user PC and more like a managed endpoint appliance:
It runs NVIDIA’s base OS (DGX OS).
It is typically administered remotely, at scale, with minimal local interaction.
It should integrate into existing IT operations: inventory, monitoring, patching, incident response, and retirement.
Documentation Principle: Treat DGX Spark as a first-class enterprise endpoint but manage it with an appliance mindset: baseline control, automation, and evidence-driven operations.
Figure 1: DGX Spark context (PC fleet + AI workloads + enterprise tooling).
Enterprise Management Challenges#
Enterprise IT teams managing PCs globally typically rely on:
Rich device identity and hardware inventory
Standardized patching and reboot orchestration
Predictable driver and firmware servicing channels
Mature remote diagnostics and support bundles
CMDB integration, drift detection, and reporting. Linux-based devices often break those assumptions:
Management approaches differ across distros and package managers
Endpoint agents vary by platform and may not be desirable in regulated environments
Ad-hoc scripting without consistent outputs leads to fragile automations
Troubleshooting evidence collection can be inconsistent, large, and noisy. DGX Spark’s manageability approach addresses these challenges by providing:
Bounded, machine-ingestible outputs (JSON)
An agentless control-plane model (SSH)
Optional artifact bundles when deep evidence is required
Lifecycle-aligned playbooks that map to standard IT operations
PC-Centric Expectation |
DGX Spark Operational Equivalent |
|---|---|
Identity and inventory are always queryable |
Standard SSH collectors emit bounded JSON snapshots for ingestion. |
Patching and reboots are orchestrated |
Maintenance-window playbooks: precheck → update and reboot → postcheck, all returning JSON. |
Driver and firmware servicing is predictable |
Standardize on a supported baseline (DGX OS) and validate drift through inventory JSON. |
Support bundles are standardized |
Generate evidence artifacts only when needed and reference them from the JSON result. |
Drift detection and reporting are continuous |
Record baseline OS build, firmware, drivers, and critical packages. Compare them over time. |
Figure 2: Manageability assumptions vs Linux endpoint realities.
Lifecycle Backbone (How Enterprise IT Actually Runs Fleets)#
The information in this section is organized around a lifecycle backbone that enterprise IT already understands. It deliberately starts before the device is powered on, because procurement decisions (SKUs, support, warranty, spares, standards alignment, and so on) drive long-term operational cost.
Procurement and Receiving
Define standard SKUs and configurations, support entitlements, and regional logistics.
Establish asset identity expectations (serial and UUID conventions, labeling, CMDB records).
Plan sparing, RMA flows, and replacement pools aligned to global sites.
Initial Provisioning
Establish device identity, hardware, firmware, software inventory, and baseline state.
Apply initial configuration required for remote management (SSH reachability, time sync, and so on).
Record enrollment metadata and ownership tags (as defined by your IT processes).
Apply automated first-boot configuration with cloud-init and repacked BaseOS media where required. See Cloud-init for DGX Spark and Custom Installation with cloud-init.
Ongoing Monitoring
Run health checks and alerting signals.
Detect drift from known good baselines (such as OS build, firmware set, driver set, critical packages).
Analyze reset reasons and stability indicators to catch systemic issues early.
Maintenance Windows
Coordinate controlled updates and reboots within change windows.
Validate update outcomes and preserve rollback safety.
Enforce staged rollouts (rings and waves) to reduce fleet risk.
Incident Response
Collect targeted evidence or full diagnostics bundles when needed.
Package artifacts for escalation (such as, engineering, NVIDIA support, or OEM workflows).
Execute remediation consistently and record outcomes for postmortems.
End-of-Life
Execute factory reset aligned to retirement policy.
Produce retirement evidence (such as method, timestamps, success and failure, and artifact references).
Handle redeploy, transfer, and disposal with chain-of-custody documentation.
Figure 3: Lifecycle backbone (Procure → Provision → Monitor → Maintain → Respond → Retire).
JSON-First, Agentless SSH Execution Model#
The information in this section standardizes on one universal remote control plane:
Remote execution: SSH (works from Windows and from enterprise management platforms)
Output contract: JSON on stdout (small, bounded; or machine-ingestible)
Deep evidence: Artifacts (tarballs and log bundles) referenced by JSON and pulled only when needed. This model intentionally avoids requiring a resident management agent on the DGX Spark endpoint.
Existing platforms orchestrate SSH execution and ingest JSON results.
Figure 4: Orchestrator → SSH → Tool → stdout JSON → parse or ingest (plus optional artifact pull).
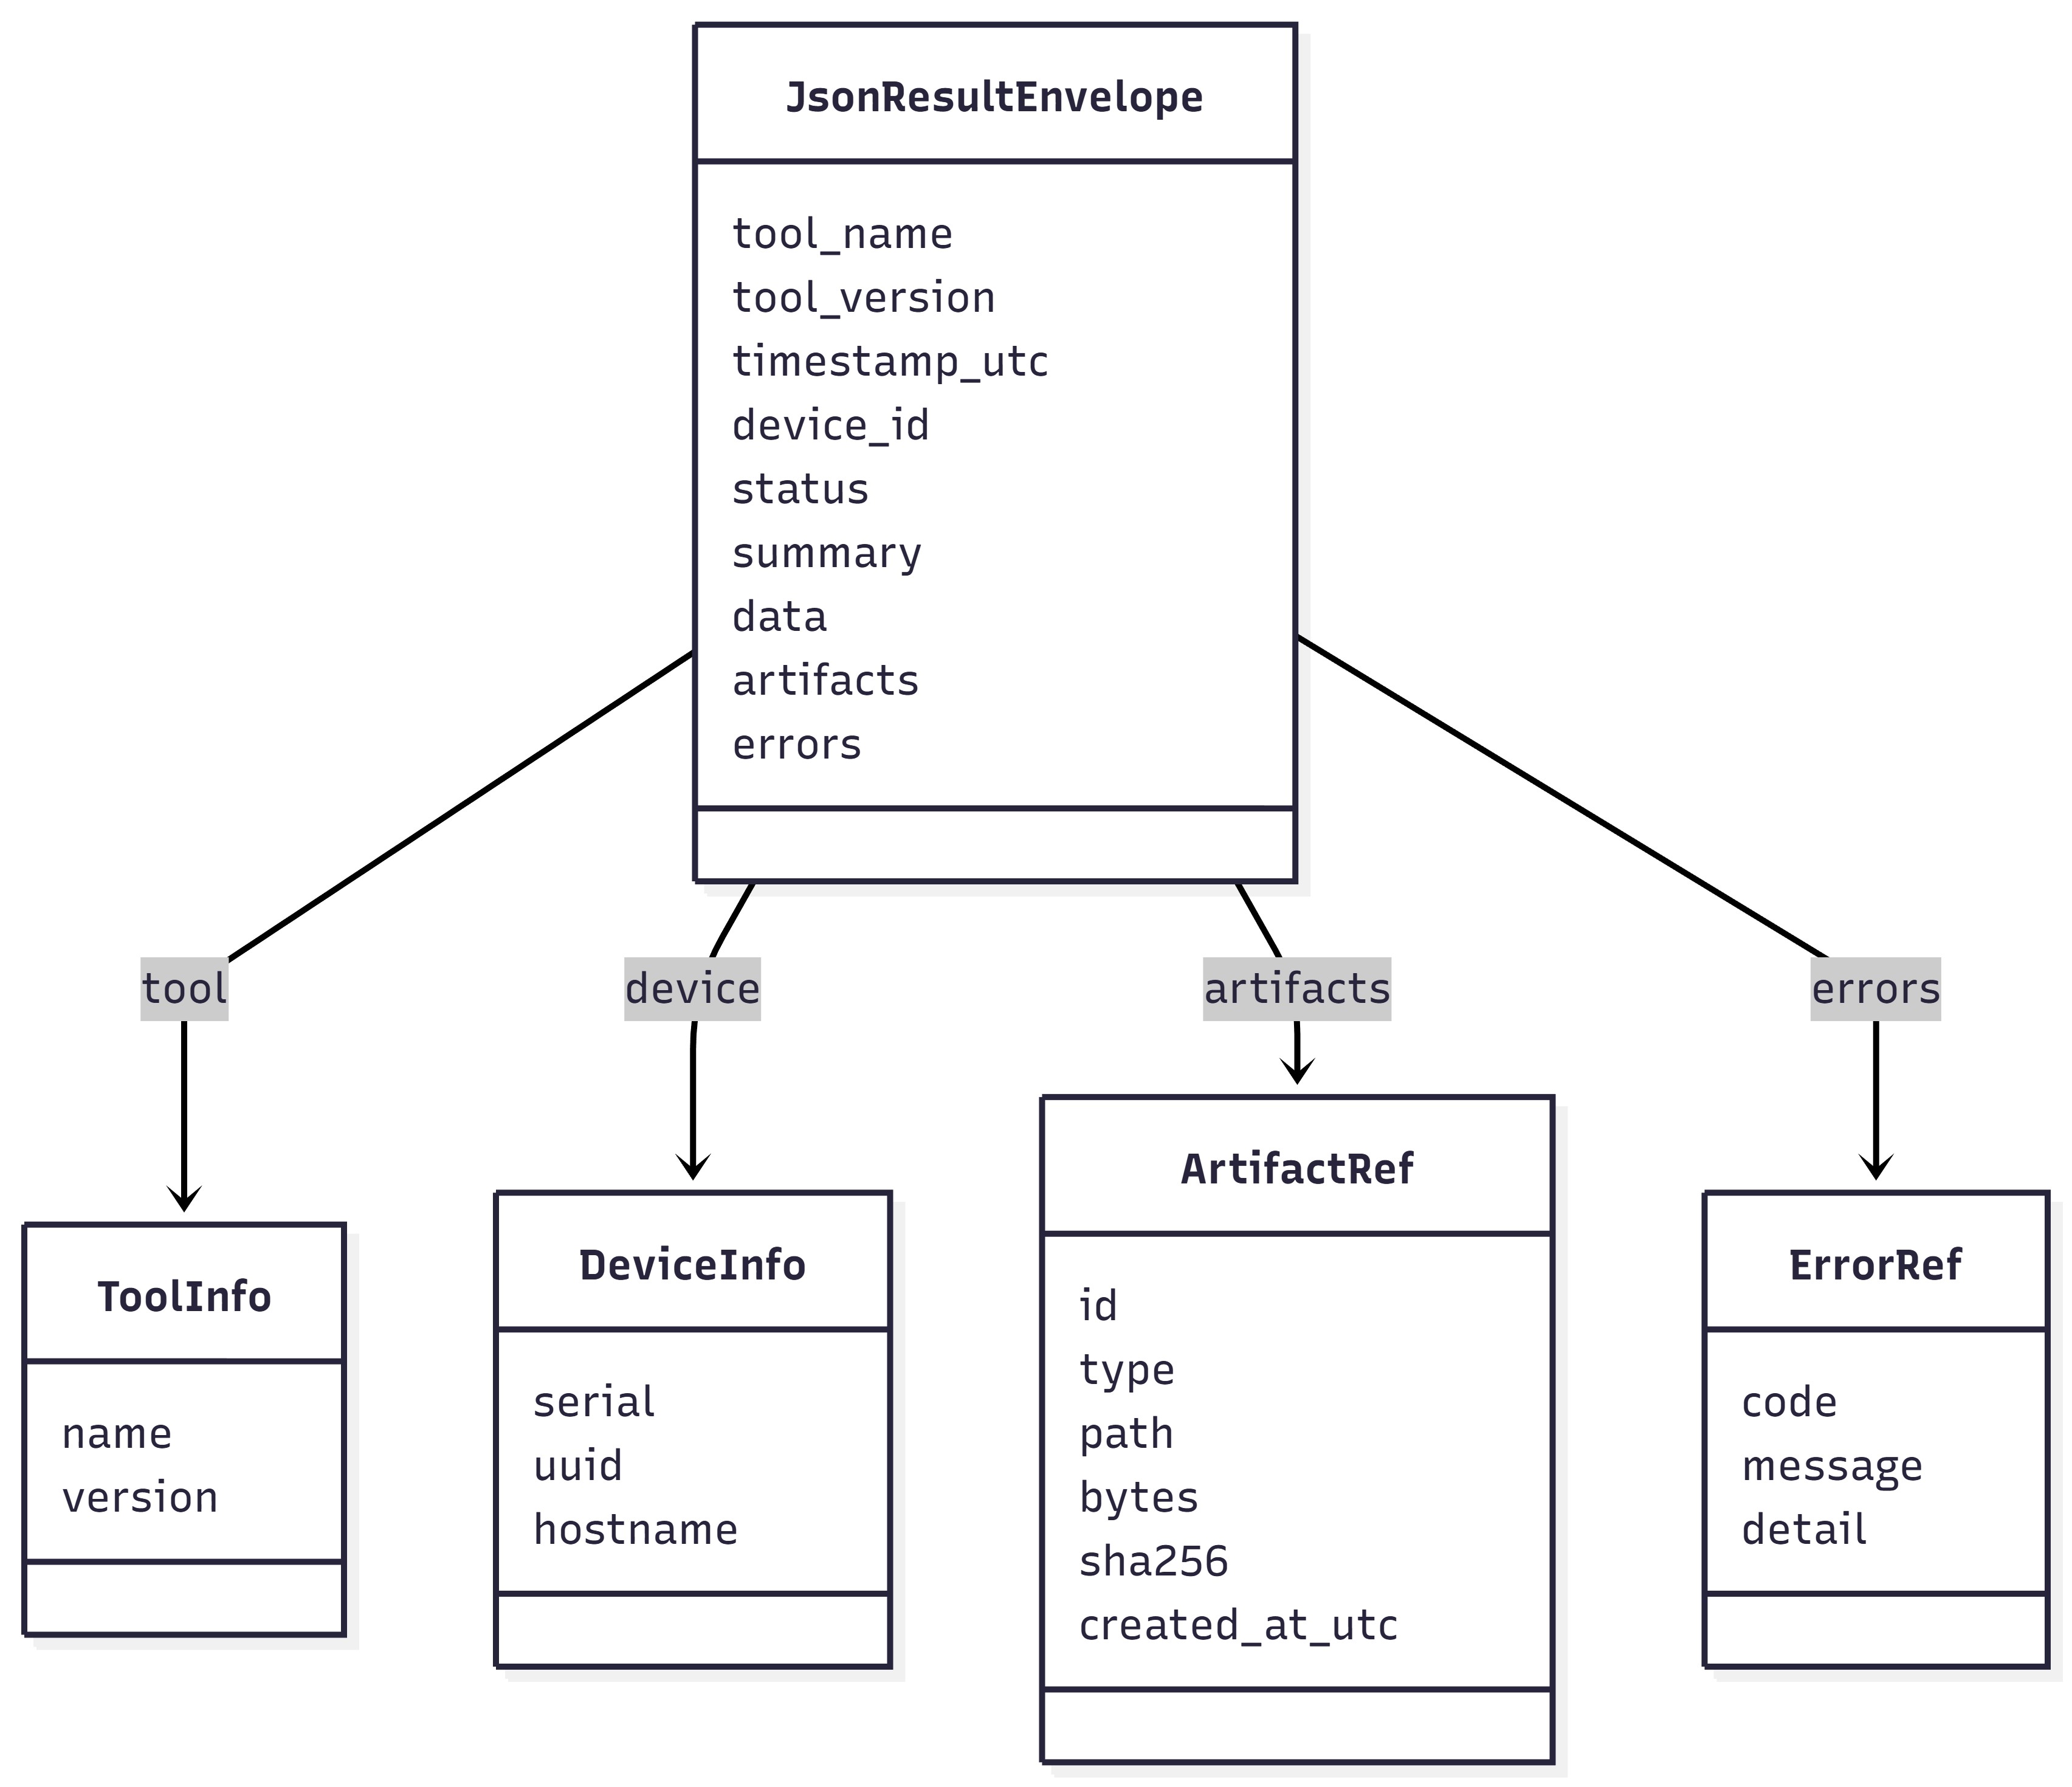
Figure 5: JSON result envelope (fields) and artifact pointer model.
Simple Operations#
IT teams can run the entire control plane from endpoints and servers using built-in OpenSSH capabilities:
Direct SSH command execution
Scripting and scheduling
JSON capture and forwarding into CMDB, SIEM, and monitoring pipelines
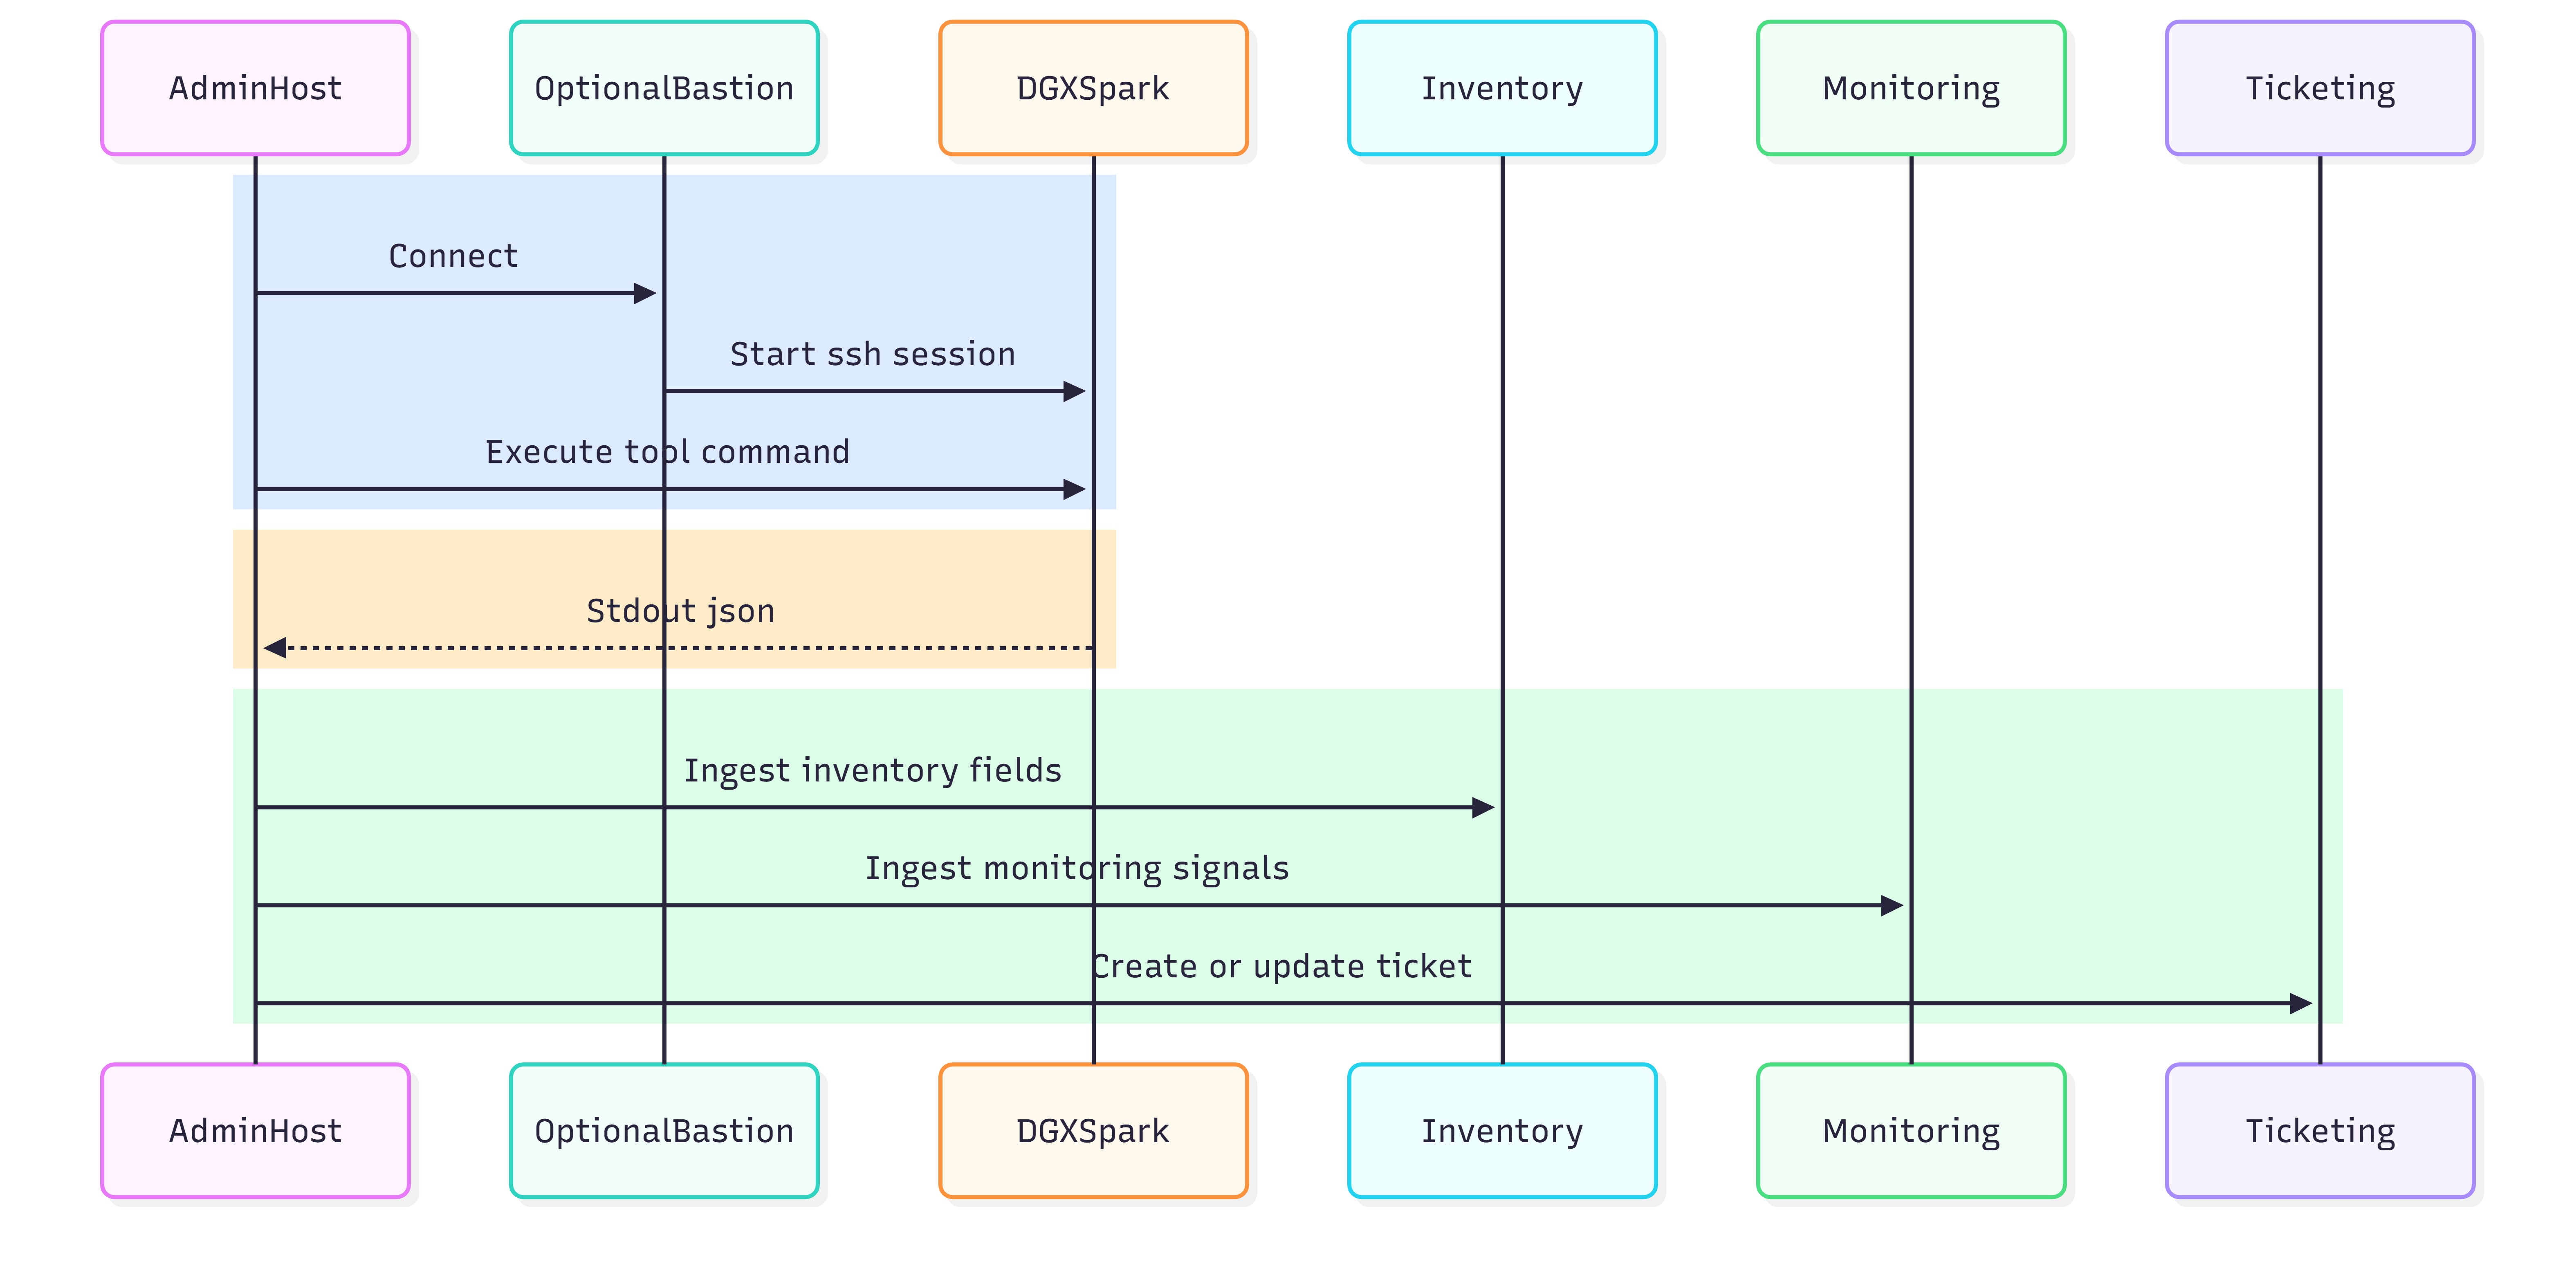
Figure 6: Admin workstation or server → SSH → DGX Spark → JSON ingestion targets.
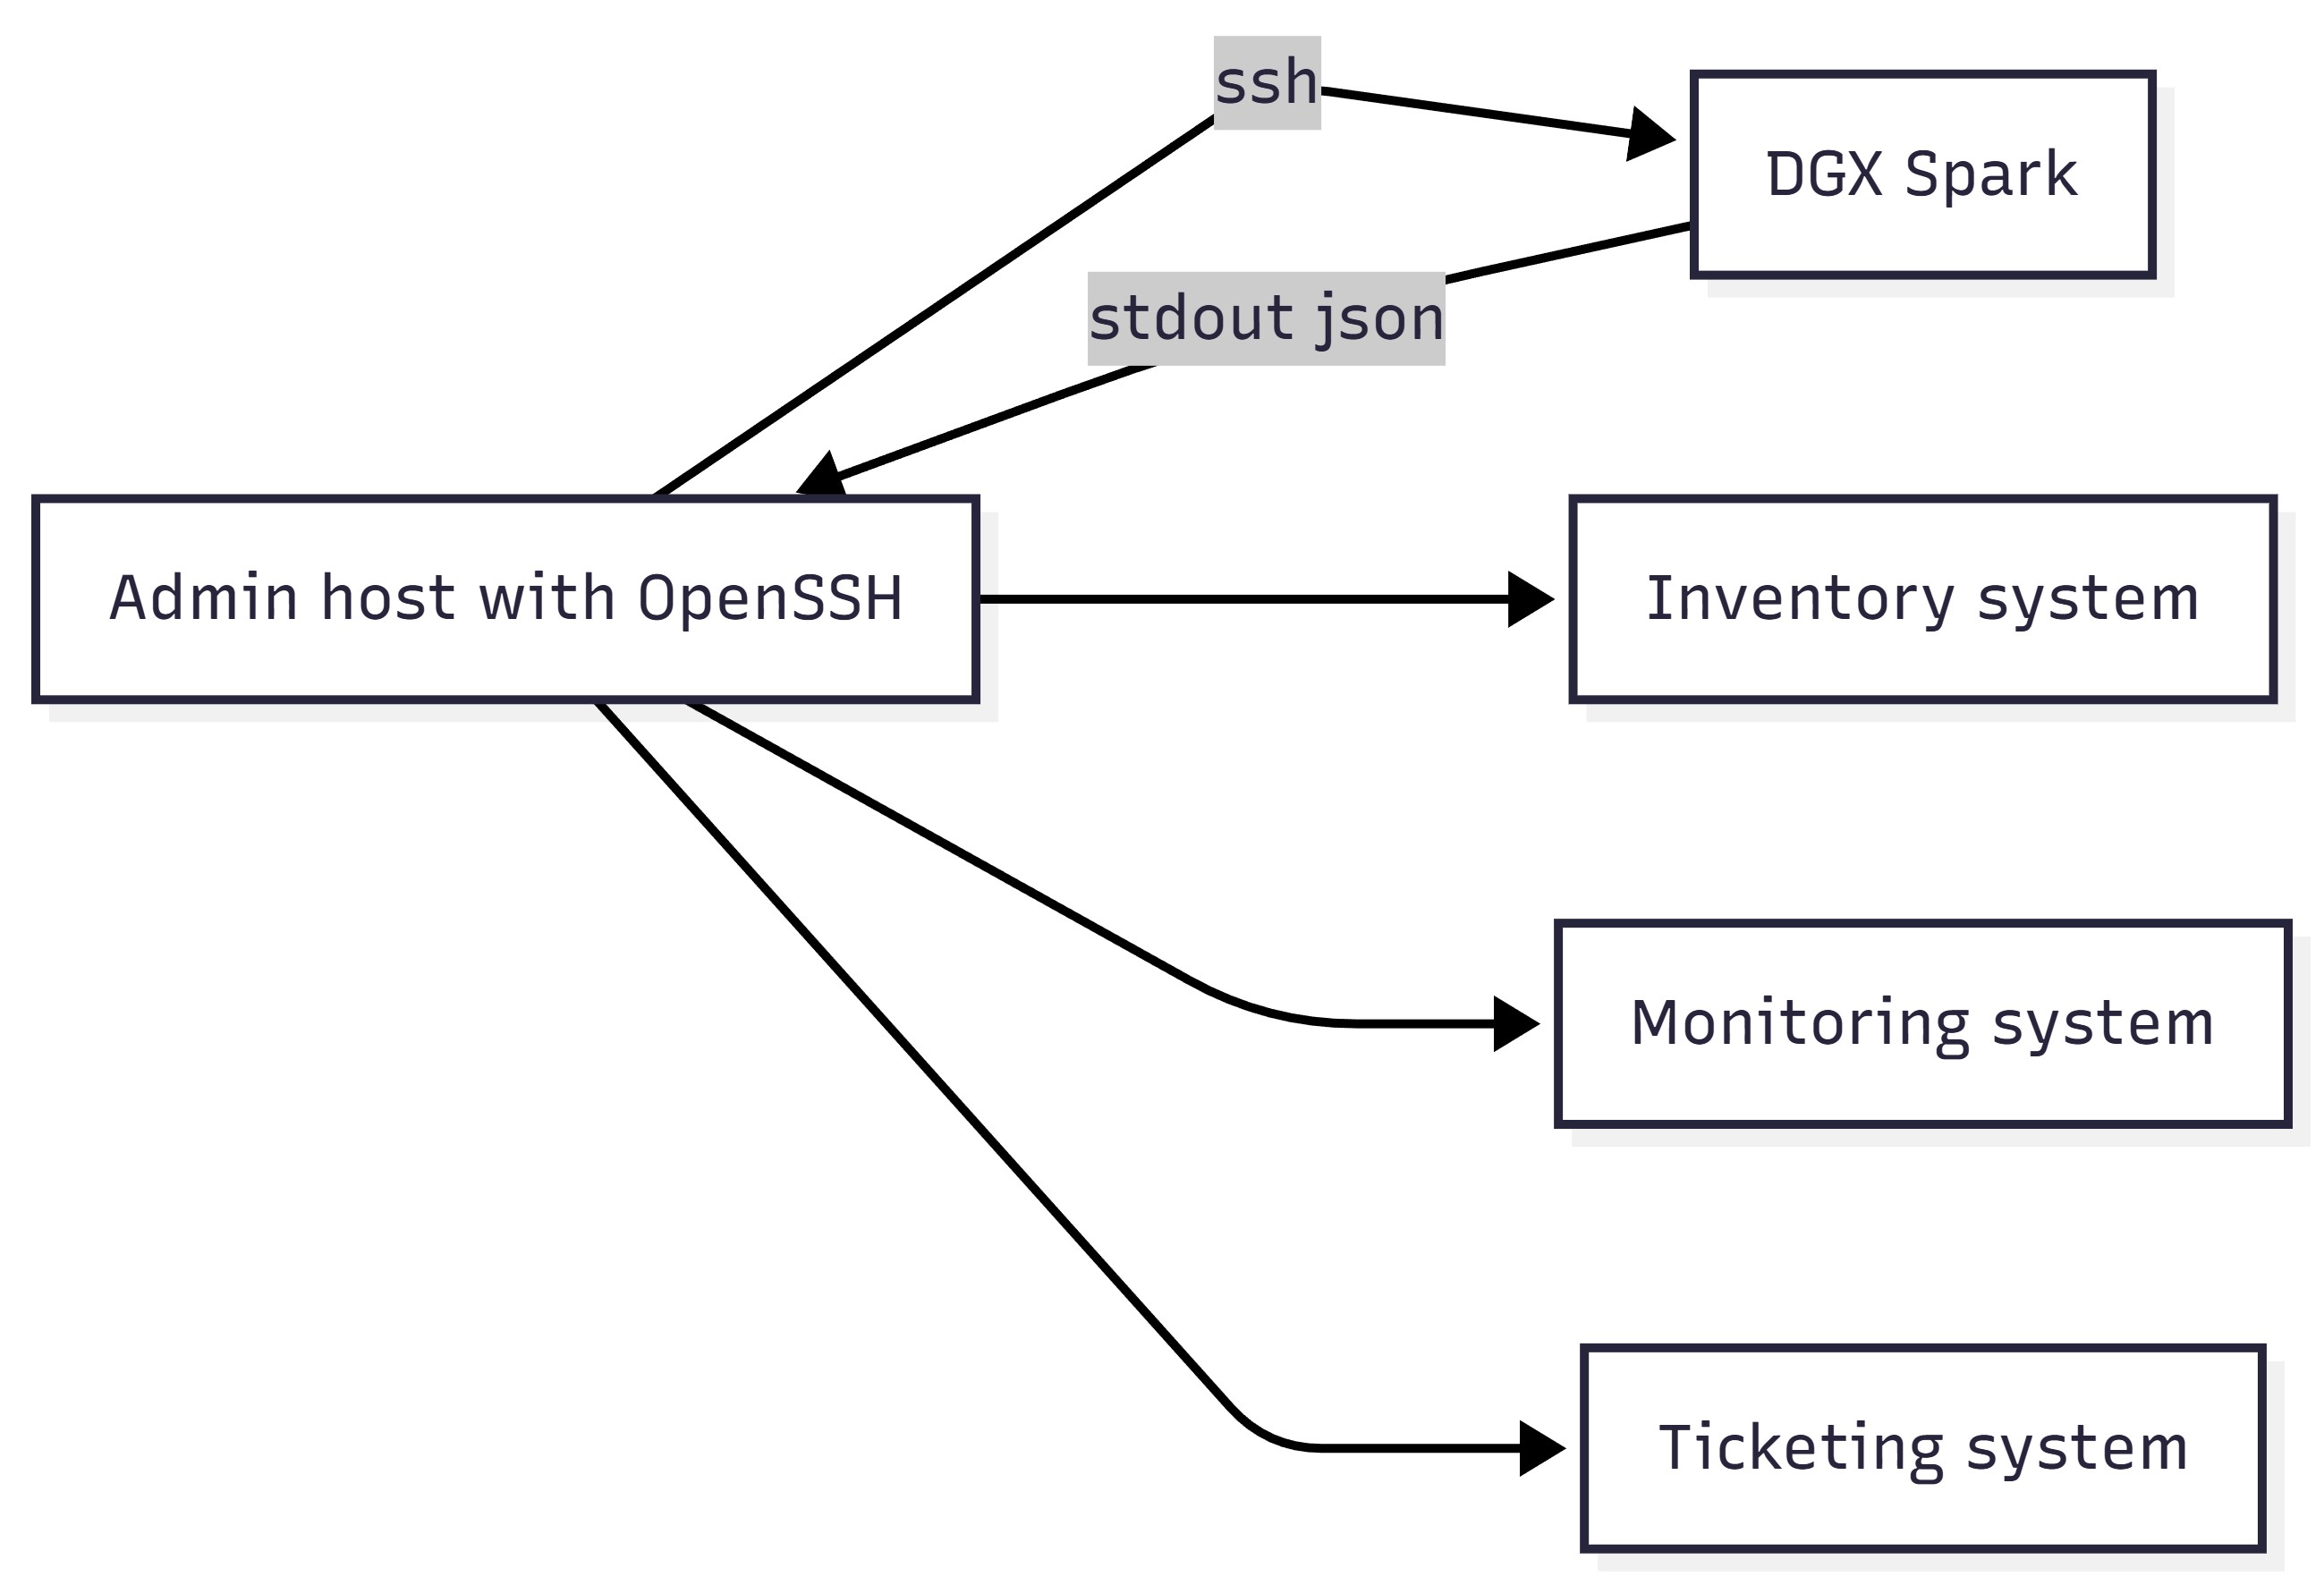
Figure 7: Admin host SSH invocation example flow
Artifact Strategy#
Use two tiers of operational evidence:
stdout JSON: Bounded, predictable, and easy to store and index
artifacts: Collected selectively (incident response and escalation), stored with retention controls; and CMDB stores pointers only
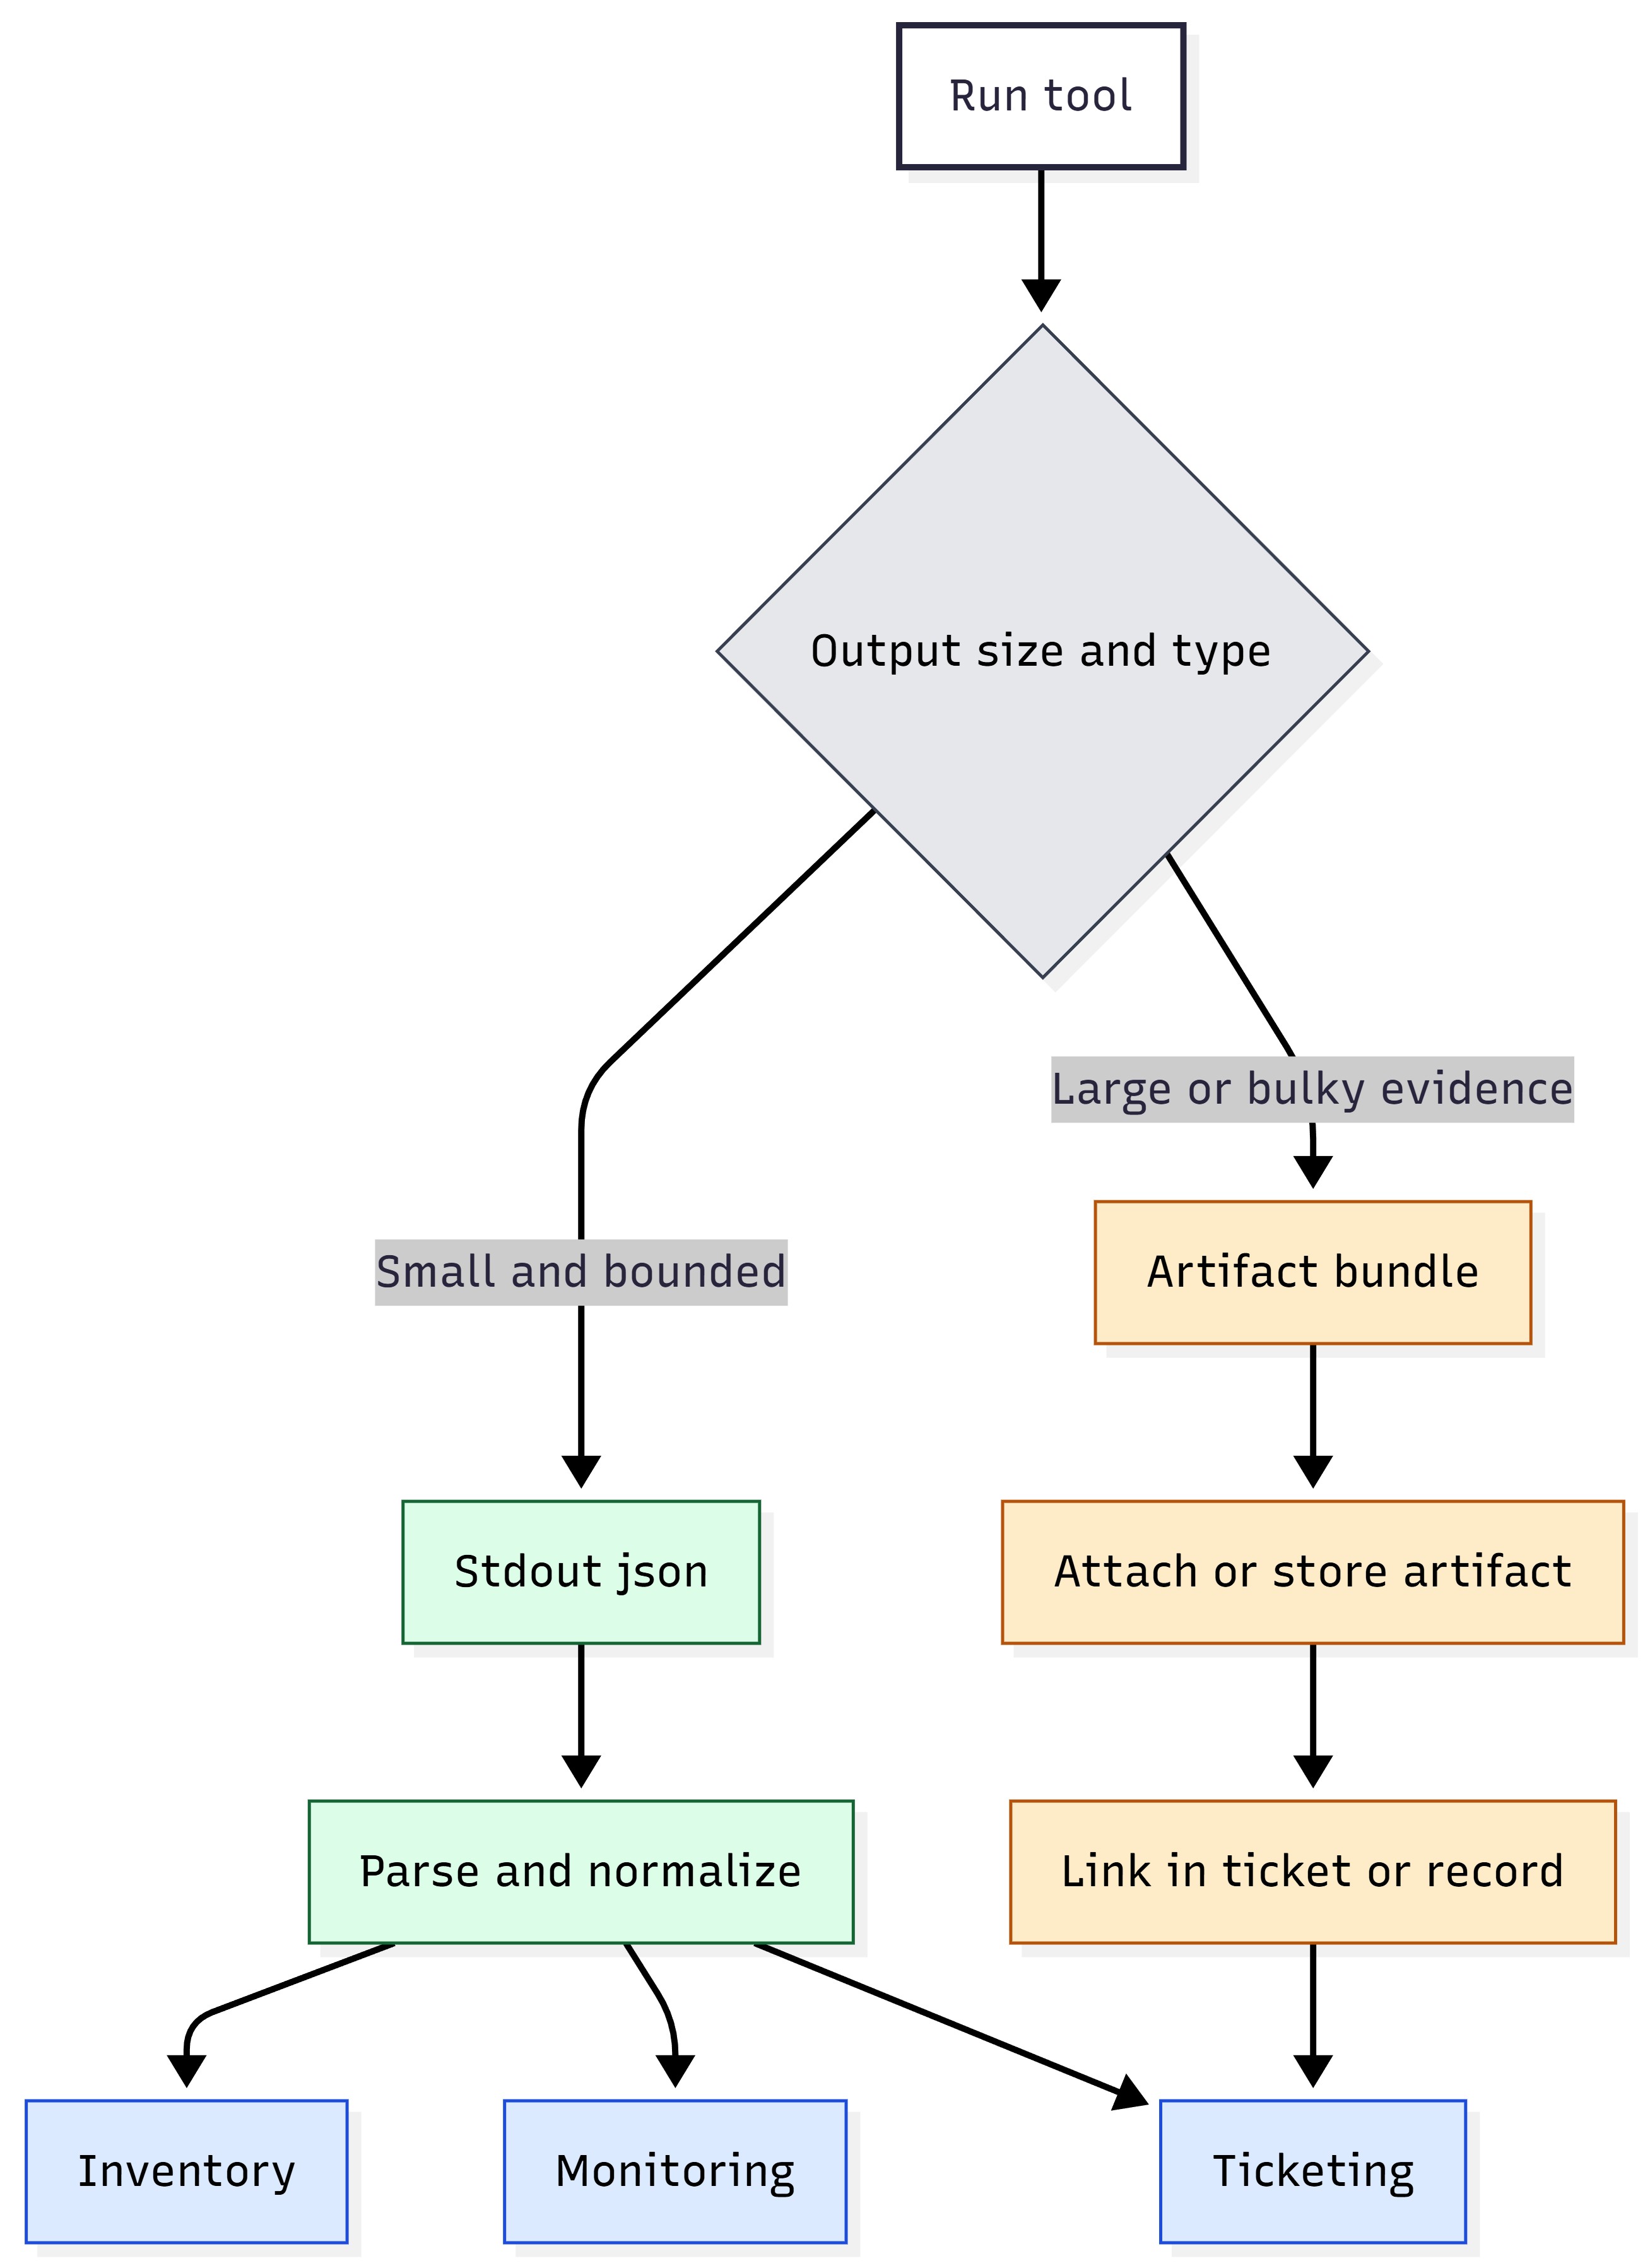
Figure 8: Decision split—small JSON vs large artifacts (pointers + retention).
Artifact Type |
Typical Retention |
Notes |
|---|---|---|
Routine health snapshots |
30–90 days |
Prefer JSON-only; avoid artifacts unless needed. |
Incident diagnostics bundles |
90–180 days |
Retain for root cause analysis and escalation cycles. |
Security audit evidence |
180–365+ days |
Align with compliance and legal hold policy. |
Retirement proofs |
Per policy |
Retention period set by chain-of-custody or enterprise governance. |
Operational UX Details#
This subsection describes the practical operator experience, such as what to run, what you get back, and how to handle evidence in a way that scales in enterprise job systems.
Operator Workflow in One Screen#
Pick the lifecycle intent (such as inventory, drift check, health posture, update window, incident evidence, and retire).
Run the corresponding installed command over SSH.
Capture stdout JSON as the authoritative record.
Retrieve artifacts only when JSON reports they exist or escalation requires deeper evidence.
Quick start: The four most common actions#
Intent |
Command to Run |
What to Store |
|---|---|---|
Acceptance snapshot (as-received) |
device_identity.py os_build_identity.py |
stdout JSON for CMDB; optional on-device JSON record |
Baseline inventories (provisioning) |
hardware_config.py firmware_reporter.py driver_i nventory_reporter.py software_i nventory_reporter.py |
stdout JSON for drift anchors; retain build + driver + firmware fields |
Monitoring (routine posture) |
spark_diagctl.py rese t_reason_reporter.py |
stdout JSON for health/stability signals |
Incident escalation (deep evidence) |
spark_diagctl.py (bundle modes) |
stdout JSON + artifact pointer(s); retrieve bundle only when needed |
Stdout JSON is the API (contract)#
Stdout JSON is the integration contract. Recommended capture: stdout (verbatim), rc, stderr, ts, host. See JSON result capture (stdout as the API) for the standard envelope fields.
Evidence Handling: Summary First, Artifacts on Demand#
Apply the rule in Artifact Strategy. If the result is small, keep it in stdout JSON. If the result is large (such as logs or bundles), generate or retrieve it as an artifact. Store artifacts in your normal evidence store and link them back to the run record or ticket.
Scenario |
Operational Handling |
|---|---|
Routine monitoring |
stdout JSON only; run frequently; bounded outputs |
Drift investigation |
stdout JSON summaries; artifact only if a deep diff is required |
Incident response L1 |
stdout JSON + minimal targeted log excerpts |
Incident response L2 |
stdout JSON + artifact bundle; retrieve and attach to ticket |
Retirement evidence |
stdout JSON “certificate” + optional artifact evidence per policy |
Common Failure Classes#
When automation fails at scale, the fastest recovery comes from classifying failures consistently:
Failure Class |
What it Usually Means |
First Action |
|---|---|---|
Transport/auth |
SSH could not connect or authenticate; device unreachable; key or policy issue. |
Fix connectivity or credentials in the orchestration layer; rerun a collector. |
Privilege |
Command requires sudo or access to privileged system interfaces. |
Grant least-privilege sudo for the tool; re-run; validate no interactive prompts. |
Tool execution |
Missing dependency, unexpected OS state, or tool internal error. |
Check stderr + tool log directory; compare against supported baseline. |
Endpoint degraded |
Tool ran successfully but returned warning or failure status due to device health signals. |
Collect targeted diagnostics; escalate to L2 bundle if needed. |
Integration Patterns: SSH Execution from Management Platforms#
This section describes how enterprise platforms execute remote actions over SSH, capture results, and feed them into downstream systems. The goal is portability. The same operational pattern should work whether you trigger jobs from Windows, a jump host, or a central orchestration tier.
Key takeaways: See JSON-first, agentless SSH execution model and Artifact Strategy for the execution and evidence model. Design for fleet realities: output limits, timeouts, concurrency, and predictable privilege boundaries.
The Universal Remote Execution Model#
At scale, enterprise tooling converges on a consistent execution loop:
Select targets (static groups, rings, or dynamic inventory queries).
Execute a remote command over SSH (often through a job, package, or policy).
Capture stdout, stderr, and exit code.
Parse stdout JSON into normalized fields.
Ingest results into CMDB, monitoring, and ITSM workflows.
(Optional) Retrieve artifacts when JSON indicates they exist.
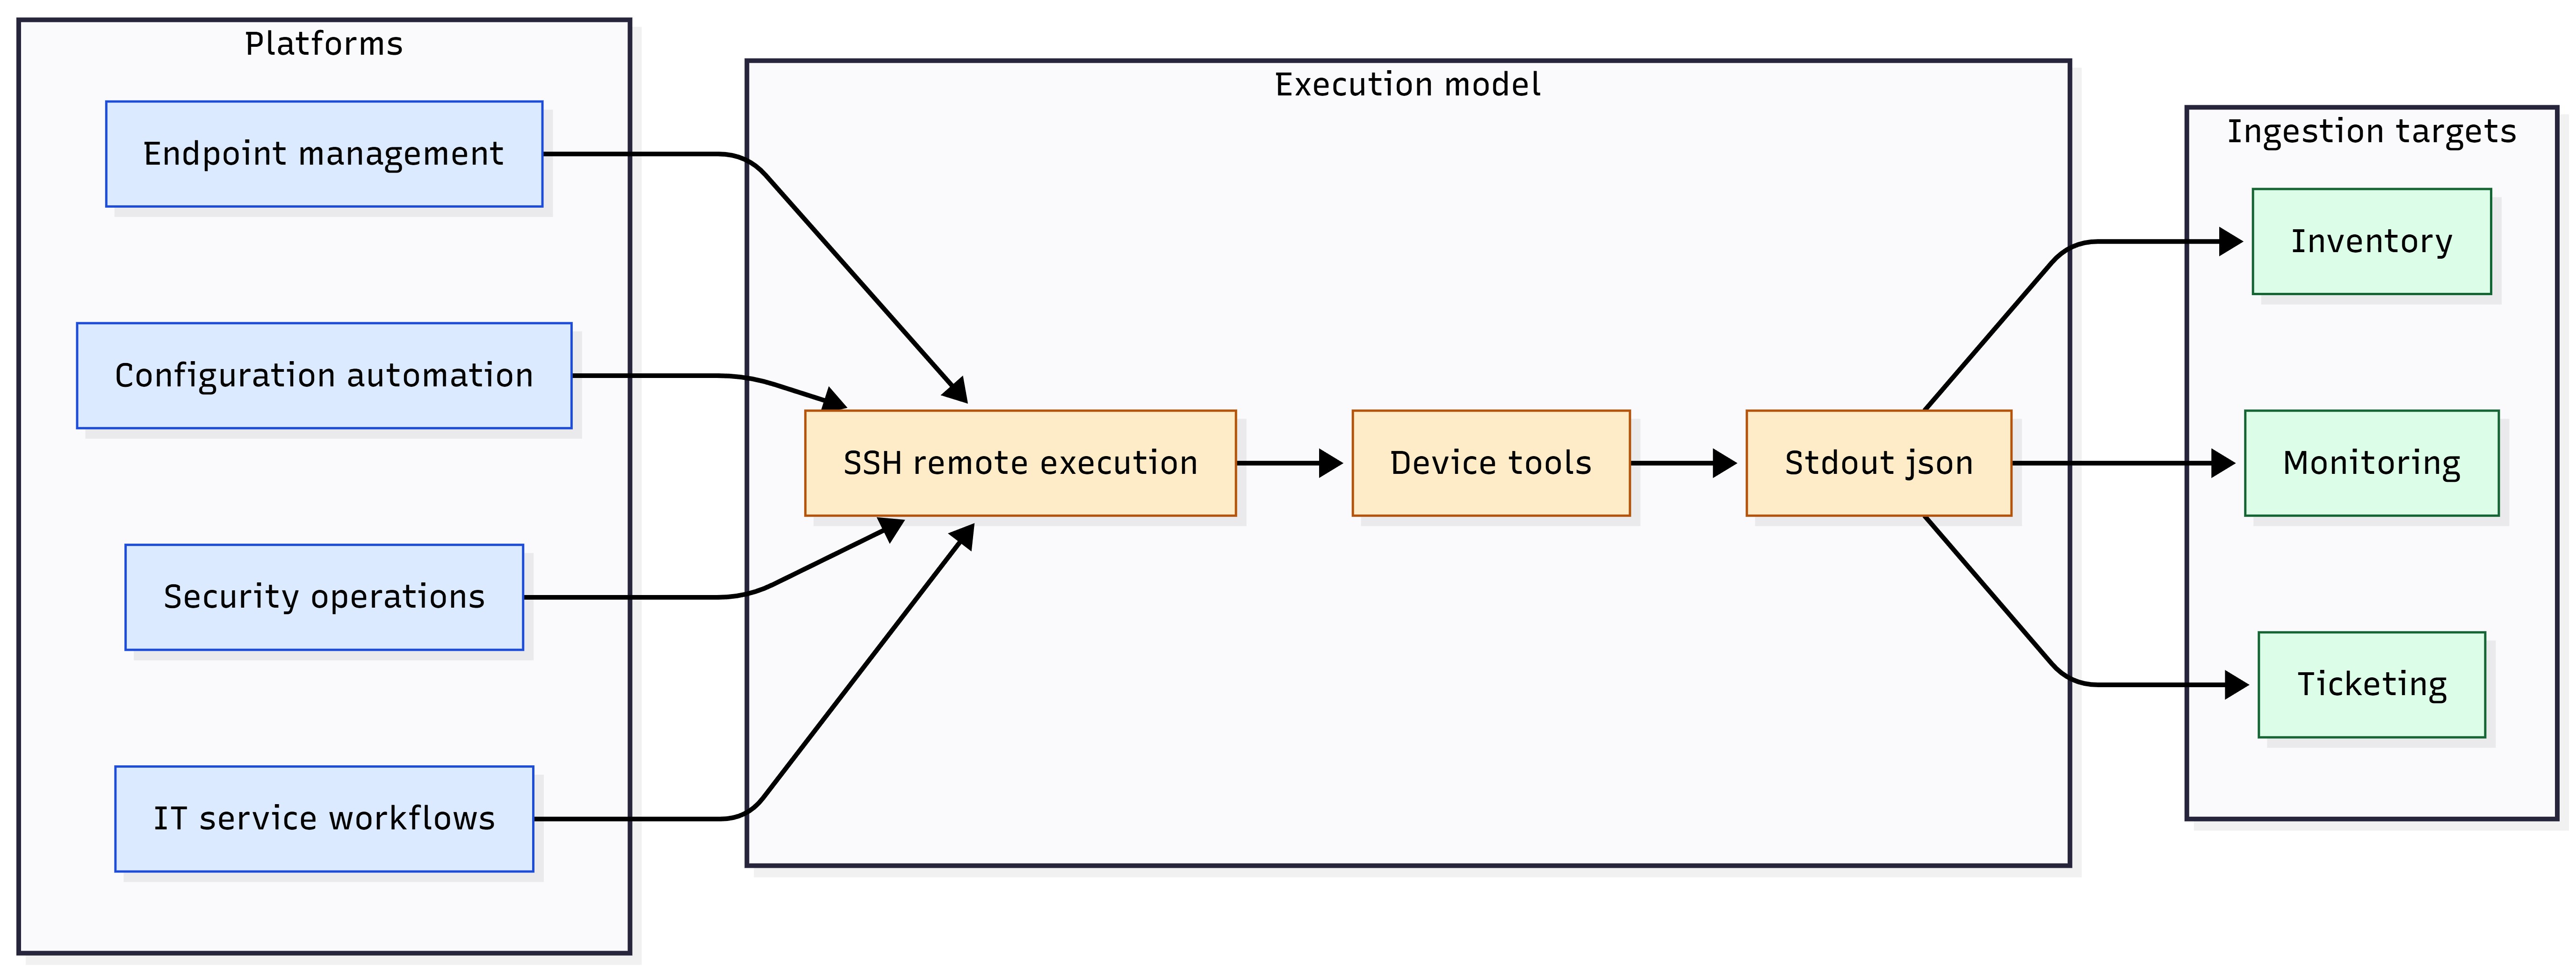
Figure 9: Universal model — platform → SSH → device tool → stdout JSON → ingest; optional artifact pull.
SSH Execution#
Many enterprise IT teams prefer a simple operational model.
Admin devices includes an OpenSSH client for interactive use and automation.
PowerShell provides a natural surface for fan-out, scheduling, and JSON capture.
Output should be stored verbatim and parsed off-box.
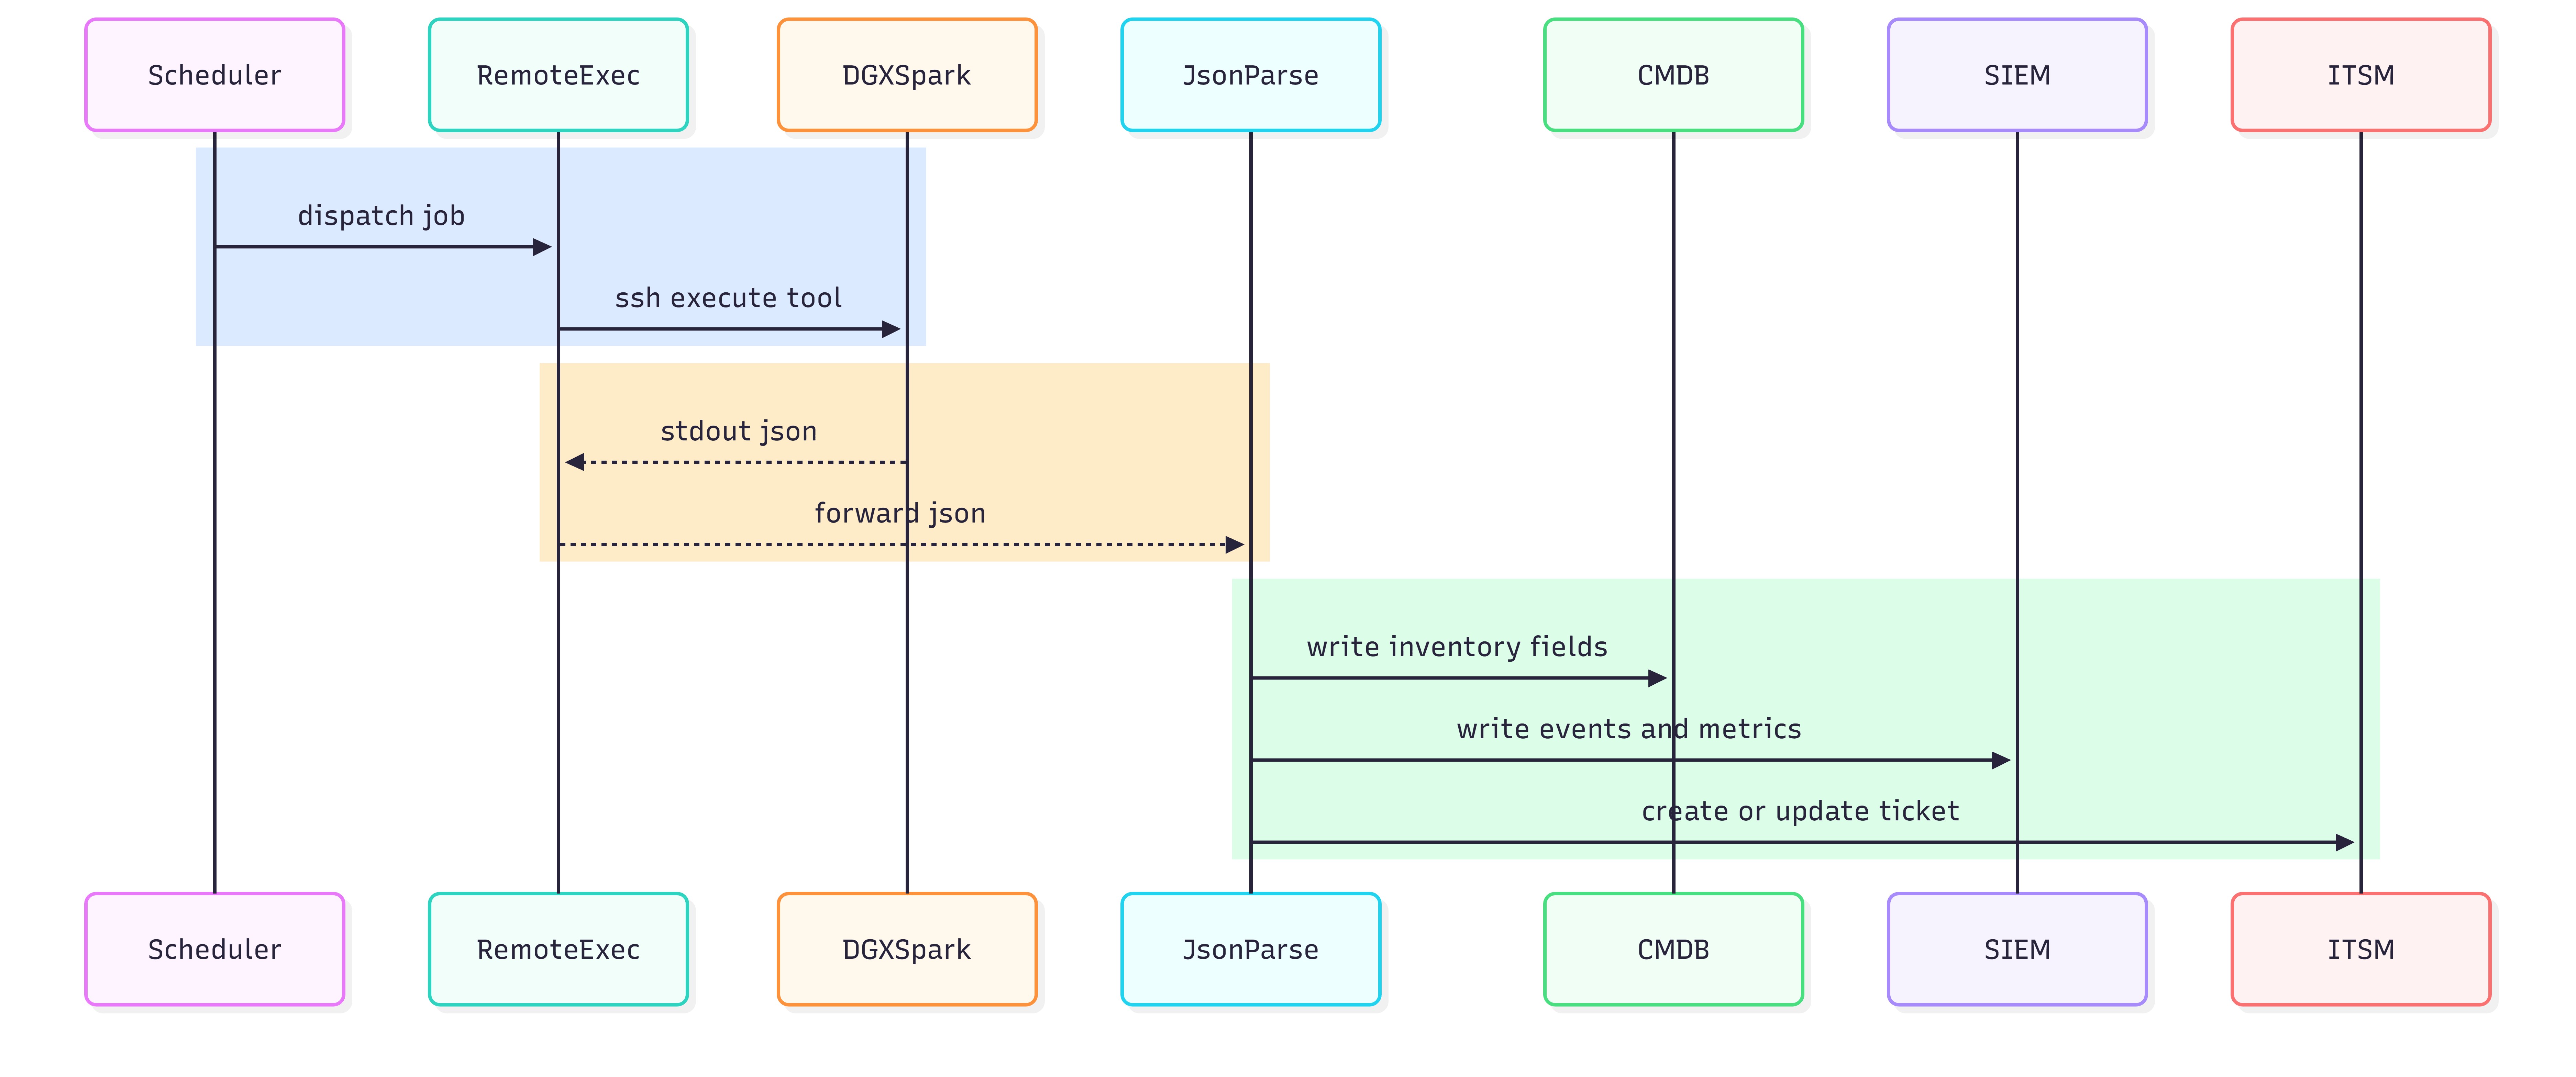
Figure 10: SSH invocation capturing stdout JSON to file.
ssh -o BatchMode=yes -o StrictHostKeyChecking=accept-new nvidia@DGX_HOST “sudo /usr/ local/bin/dgx-mgmt/spark_diagctl.py” | Out-File -Encoding utf8 .\ spark_diagctl.py $doc = Get-Content .\ spark_diagctl.py -Raw | ConvertFrom-Json
$doc.status
SSH Access Patterns for Enterprise Operations (Non-Prescriptive)#
The information in this section is intentionally non-prescriptive about identity and IAM. In practice, most enterprises converge on one of these connectivity patterns:
Direct SSH per device (common in labs and smaller networks).
Bastion or jump-host mediated SSH (typical for segmented networks).
Brokered SSH execution (platform runs jobs from a central execution tier).
Operational considerations that matter at fleet scale:
Stable addressing or an authoritative inventory source
Non-interactive authentication and execution
Predictable sudo permissions for tools
Separation between read-only collectors and state-changing controllers
Pattern |
Strengths |
Tradeoffs |
|---|---|---|
Direct per-device SSH |
Simple and transparent; minimal infrastructure |
Harder at scale; network exposure; credential sprawl risk |
Bastion or jump host |
Fits segmentation; centralizes access control and logging |
Capacity planning; potential bottleneck |
Brokered execution |
Central scheduling, targeting, and reporting; easier fleet automation |
Depends on platform constraints; adds abstraction |
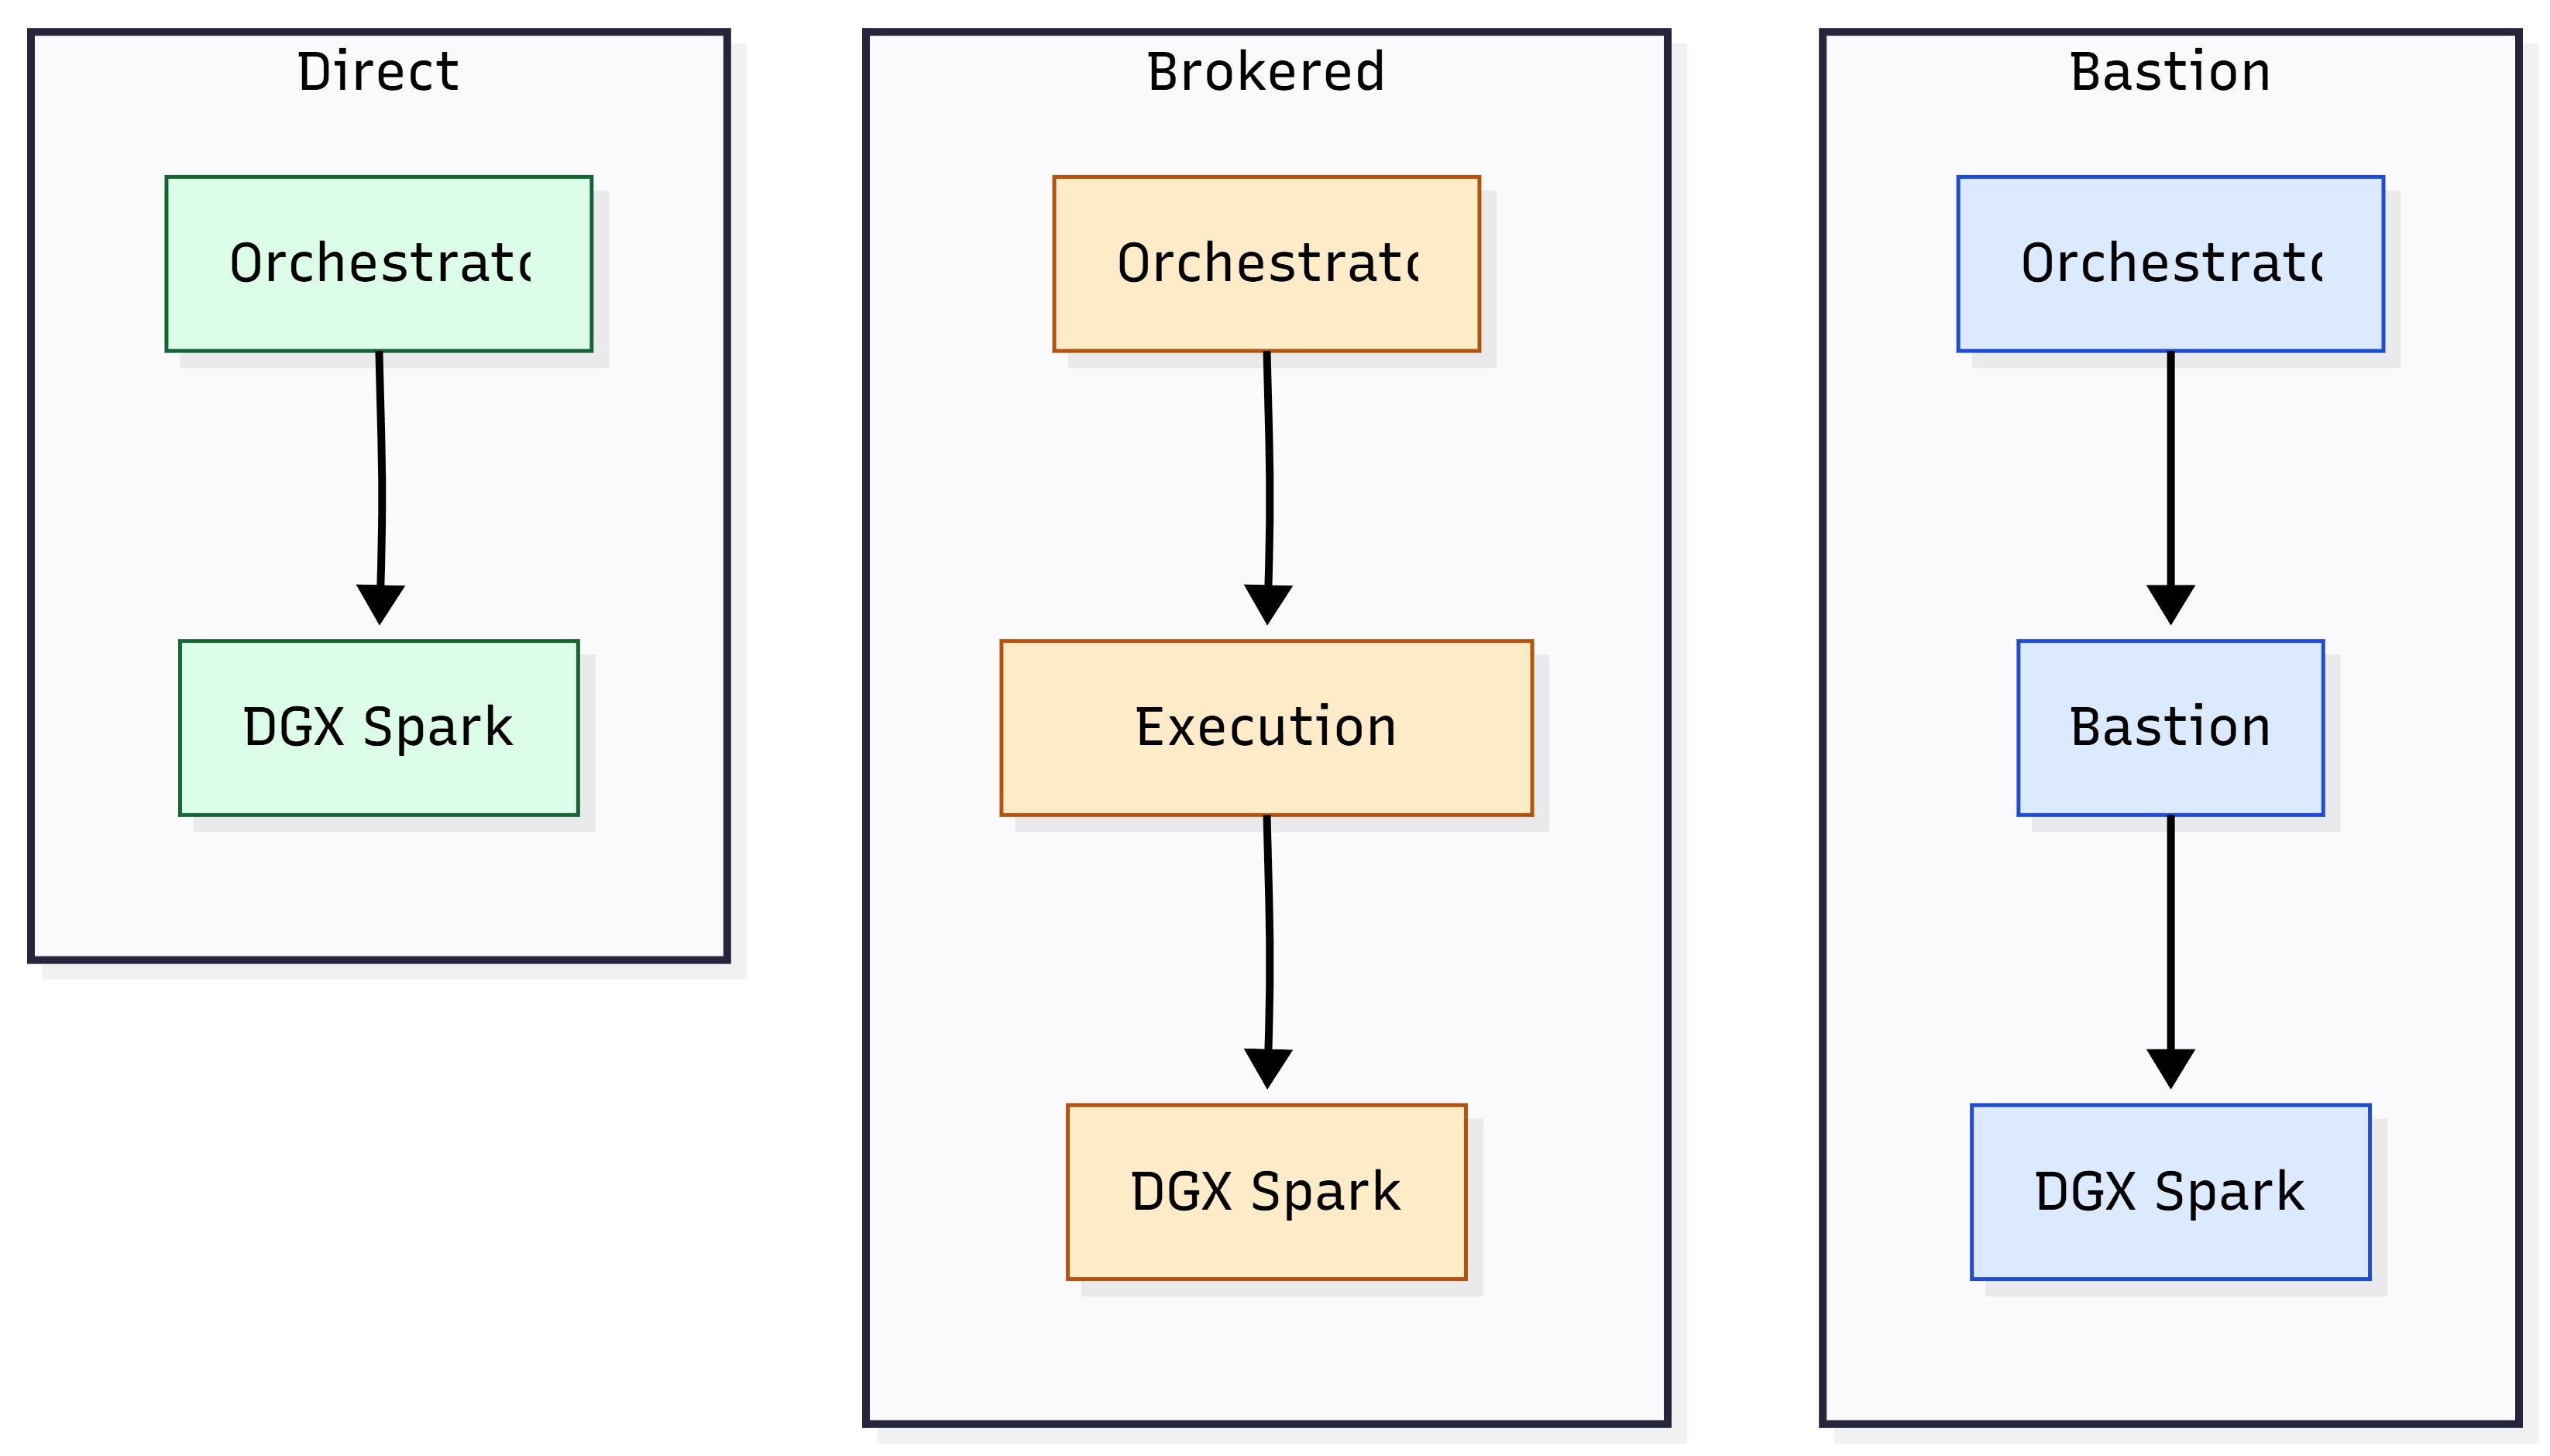
Figure 11: SSH connectivity patterns — direct vs bastion vs brokered execution.
JSON Result Capture (stdout as the API)#
(Model described in JSON-first, agentless SSH execution model and Artifact Strategy) To keep integrations uniform across platforms, it is assumed that:
Orchestration wrappers store stdout verbatim (or as close as possible)
Parsing happens off-box (in the platform, not on the device)
Operational requirements:
stdout JSON is the authoritative contract
stderr is retained for debugging, but is not the primary data plane
If a tool fails before emitting JSON, the wrapper should emit a standard failure envelope
Field |
Purpose |
|---|---|
tool |
Stable identifier of the command or tool invoked |
ts |
UTC timestamp for correlation |
host |
Target identity used by the orchestrator (hostname or asset ID) |
status |
ok |
rc |
Exit code from the tool execution |
duration_ms |
Runtime to support SLOs and debugging |
summary |
Small bounded summary suitable for indexing |
warnings |
Optional list of non-fatal issues |
artifacts |
Optional list of artifact pointers (ok, data, errors, meta) |
{
“tool”: “spark_diagctl.py “,
“ts”: “2026-01-12T21:17:00Z”,
“host”: “DGX_HOST”,
“status”: “ok”,
“rc”: 0,
“duration_ms”: 842,
“summary”: {
“disk”: “ok”,
“network”: “ok”, “drivers”: “ok”
},
“warnings”: [], “artifacts”: []
}
Artifact Retrieval Patterns#
Artifacts are used when:
A health signal indicates anomaly
Incident response requires evidence
Escalation requires a standardized support bundle
Audits require retained evidence beyond JSON summaries
Common patterns:
Pull model: Orchestrator retrieves artifact through scp/sftp after job completion.
Store-and-link model: Orchestrator uploads artifact to internal object storage and stores a link in the job record or ticket.
Retention model: Artifacts are retained per policy and then deleted automatically.
Artifact Type |
Typical Trigger |
Notes |
|---|---|---|
Diagnostics bundle |
Incident or escalation |
Prefer store-and-link; include hashes; keep sizes predictable |
Focused logs |
Single failing signal |
Smaller than full bundles; faster retrieval and triage |
Configuration snapshot |
Drift investigation |
Pair with a baseline record for comparisons |
Update evidence |
Maintenance window validation |
Attach to change ticket when required |
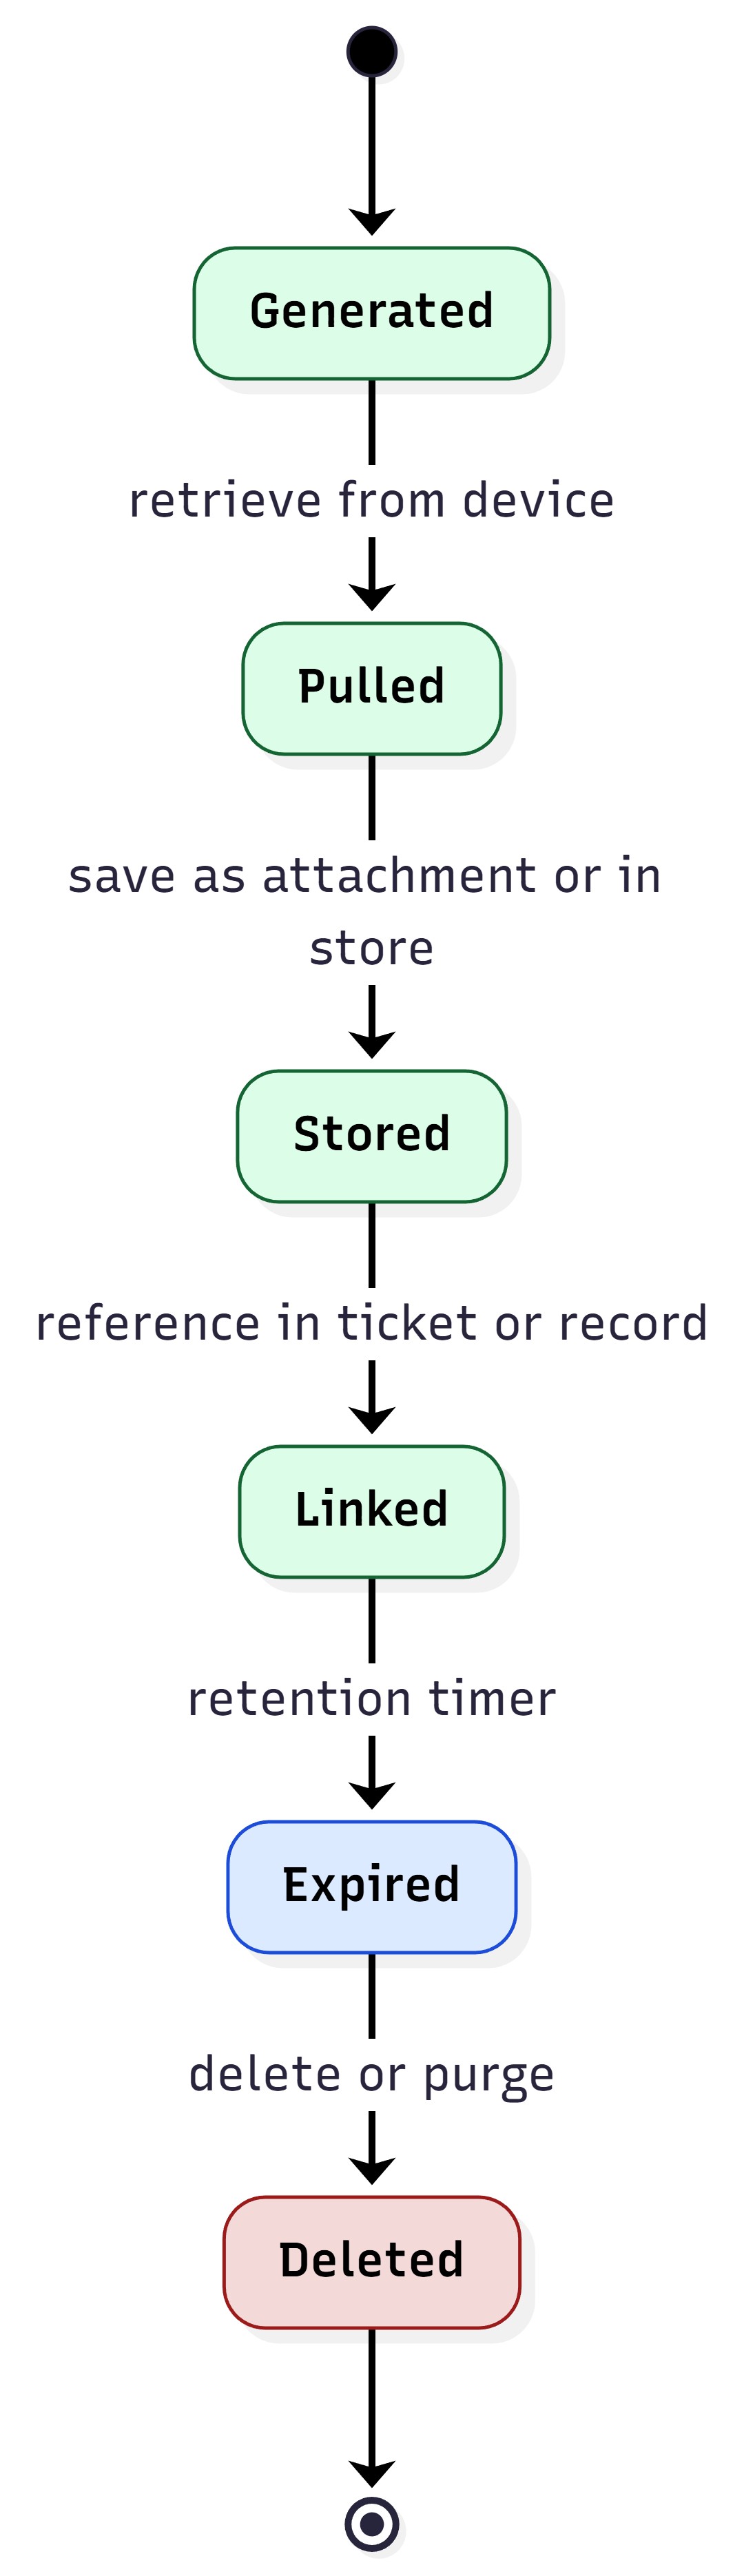
Figure 12: Artifact lifecycle — generate → retrieve → store → link → expire.
Implementation#
This section is meant to help an Enterprise IT admin (or integrator) quickly answer:
What tooling does NVIDIA provide?
Where is the source code and documentation for each tool?
What gets installed on-device and what runs in-place as reference code?
Where do outputs and logs land on the DGX Spark device?
Which tools or scripts are relevant to each lifecycle stage
For top-level directory layout and command-to-source-path mapping, see Repository layout reference.
Repository Content#
Download Enterprise Lifecycle Integration Scripts package (ZIP) and extract it on your integration host.
The package is a collection of example Python tools and shell scripts intended to help enterprise IT teams manage DGX Spark systems at scale. The examples use agentless, SSH-based remote execution with structured JSON output for integration into your enterprise management platforms. NVIDIA provides these materials for reference and customer adaptation. They are not a supported production software offering. The examples illustrate capabilities across the device lifecycle, from procurement and provisioning through monitoring, maintenance, incident response, and retirement, with no resident agent on the device. Capabilities include the following:
Hardware and software inventory
Firmware and driver reporting
Health diagnostics
Controlled updates
Security posture checks
The archive includes tool and script sources, reference shell scripts, optional per-tool install.sh scripts, and companion documentation referenced in this section.
This repository contains two distinct implementation types:
Production Tools (11)#
These are production-ready, stdlib-only Python tools designed for fleet automation with:
JSON-first output
Configuration defaults with CLI override support
Safety guardrails for state-changing operations
Comprehensive documentation and test coverage
The following is the installed command location on the device:
DGX_spark_management/bin/
The following are the production tools functional areas and source roots:
clear_asset_information/ (7 tools)
controlled_sw_fw_updates/ (1 tool)
remote_ops_remediation/ (2 tools)
data_protection_privacy/ (1 tool)
Each production tool follows a consistent structure:
{functional_area}/{tool_name}/src/
{functional_area}/{tool_name}/config/
{functional_area}/{tool_name}/install.sh
Installed entry point(s) land in DGX_spark_management/bin/
Canonical Landscape Reference Scripts (8)#
These are reference implementations designed for Canonical Landscape “remote script execution” constraints. The device must be enrolled in Landscape first; see Ubuntu Pro and Landscape client enrollment.
The reference shell scripts and their per-script README.md files are included in Enterprise Lifecycle Integration Scripts package (ZIP). After you extract the archive, follow LANDSCAPE_REFERENCE_SCRIPTS_SETUP.md at the archive root or docs/core_docs/01_core_overview/03_LANDSCAPE_REFERENCE_SCRIPTS_SETUP.md before using those scripts.
Minimal error handling (examples, not production frameworks)
stdout output intended to be short and platform-friendly
Detailed evidence stored locally on the device per run
Reference Scripts Run In-Place
They are not installed into bin/ by default.
They live under their functional area folders with landscape_ prefix naming.
Reference Script Functional Areas
attestable_conformance_regulatory/ (1 script)
resilience_recovery_rollback/ (4 scripts)
network_enterprise_connectivity/ (2 scripts)
security_posture_vuln_response/ (1 script)
Reference script structure:
{functional_area}/landscape_{script_name}/README.md
{functional_area}/landscape_{script_name}/{script_name}.sh
Script Path (Repo) |
Primary Script |
Purpose |
Stdout + Evidence |
|---|---|---|---|
attestable_conformance_regulatory/ landscape_signing_verification/ |
signing_verification.sh |
APT signing verification |
Short stdout; detailed evidence stored per run on device |
resilience_recovery_rollback/ landscape_verified_boot_integrity/ |
verified_boot_integrity.sh |
Verified boot integrity reference |
Short stdout; per-run evidence under run directory |
resilience_recovery_rollback/ landscape_recovery_backup_levels/ |
recovery_backup_levels.sh |
Recovery/backup level reference |
Short stdout; per-run evidence under run directory |
resilience_recovery_rollback/ landscape_factory_reset_reprovision/ |
factory_reset_reprovision.sh |
Factory reset + reprovision |
Short stdout; per-run evidence under run directory |
resilience_recovery_rollback/ landscape_health_watchdogs/ |
health_watchdogs.sh |
Health watchdog reference |
Short stdout; per-run evidence under run directory |
network_enterprise_connectivity/ landscape_collect_package/ |
collect_package.sh |
Support bundle collection reference |
Short stdout; evidence bundle stored on device |
network_enterprise_connectivity/ landscape_retrieve_logs_stdout/ |
retrieve_logs_stdout.sh |
Bounded log retrieval reference |
Short stdout; bounded excerpts; detailed evidence on device |
security_posture_vuln_response/ landscape_encryption_at_rest/ |
encryption_at_rest.sh |
Encryption-at-rest reference |
Short stdout; evidence stored per run on device |
When to Use Reference Scripts#
Use reference scripts when management platform constraints are the
dominant design factor (for example, strict stdout limits or “run script
remotely” paradigms). For broad enterprise automation, use production
tools installed in bin/.
Primary Entry Points#
After you download and extract the script package (see Repository Content), use the following files in the extracted tree for the authoritative directory layout, reading order, and per-tool references. Paths below are relative to the root of the extracted script package.
docs/core_docs/00_INDEX.md— Documentation index and reading orderdocs/core_docs/01_core_overview/01_PROJECT_README.md— Overview, quick start, naming conventionsdocs/core_docs/01_core_overview/02_PROJECT_STRUCTURE.md— Directory tree and runtime layoutdocs/core_docs/01_core_overview/03_LANDSCAPE_REFERENCE_SCRIPTS_SETUP.md— Landscape reference script framework
I want to… |
Read this first |
|---|---|
Get a quick start view |
docs/core_docs/01_core_overview/01_PROJECT_README.md |
Understand folder structure and runtime layout |
docs/core_docs/01_core_overview/02_PROJECT_STRUCTURE.md |
Integrate Landscape reference scripts |
docs/core_docs/01_core_overview/03_LANDSCAPE_REFERENCE_SCRIPTS_SETUP.md |
Tool Deep-Dive Documentation#
Each production tool has the following:
A tool folder README at {functional_area}/{tool_name}/README.md
Centralized “production tools” documentation referenced by
docs/core_docs/00_INDEX.md. Tool locations and reference code map points to these documents per tool and summarizes the following:Command synopsis and options
JSON output structure and key fields
Troubleshooting and known limitations
Integration notes
Installed Commands on the DGX Spark#
This subsection provides information about the installed commands on the DGX Spark.
Installed Command Directory#
When deployed, production tools are installed here:
DGX_spark_management/bin/ Expected installed commands:
bin/device_identity.py
bin/hardware_config.py
bin/firmware_reporter.py
bin/os_build_identity.py
bin/driver_inventory_reporter.py
bin/software_inventory_reporter.py
bin/NVAIAwrite
bin/NVAIAread
bin/spark_updatectl.py
bin/spark_diagctl.py
bin/reset_reason_reporter.py
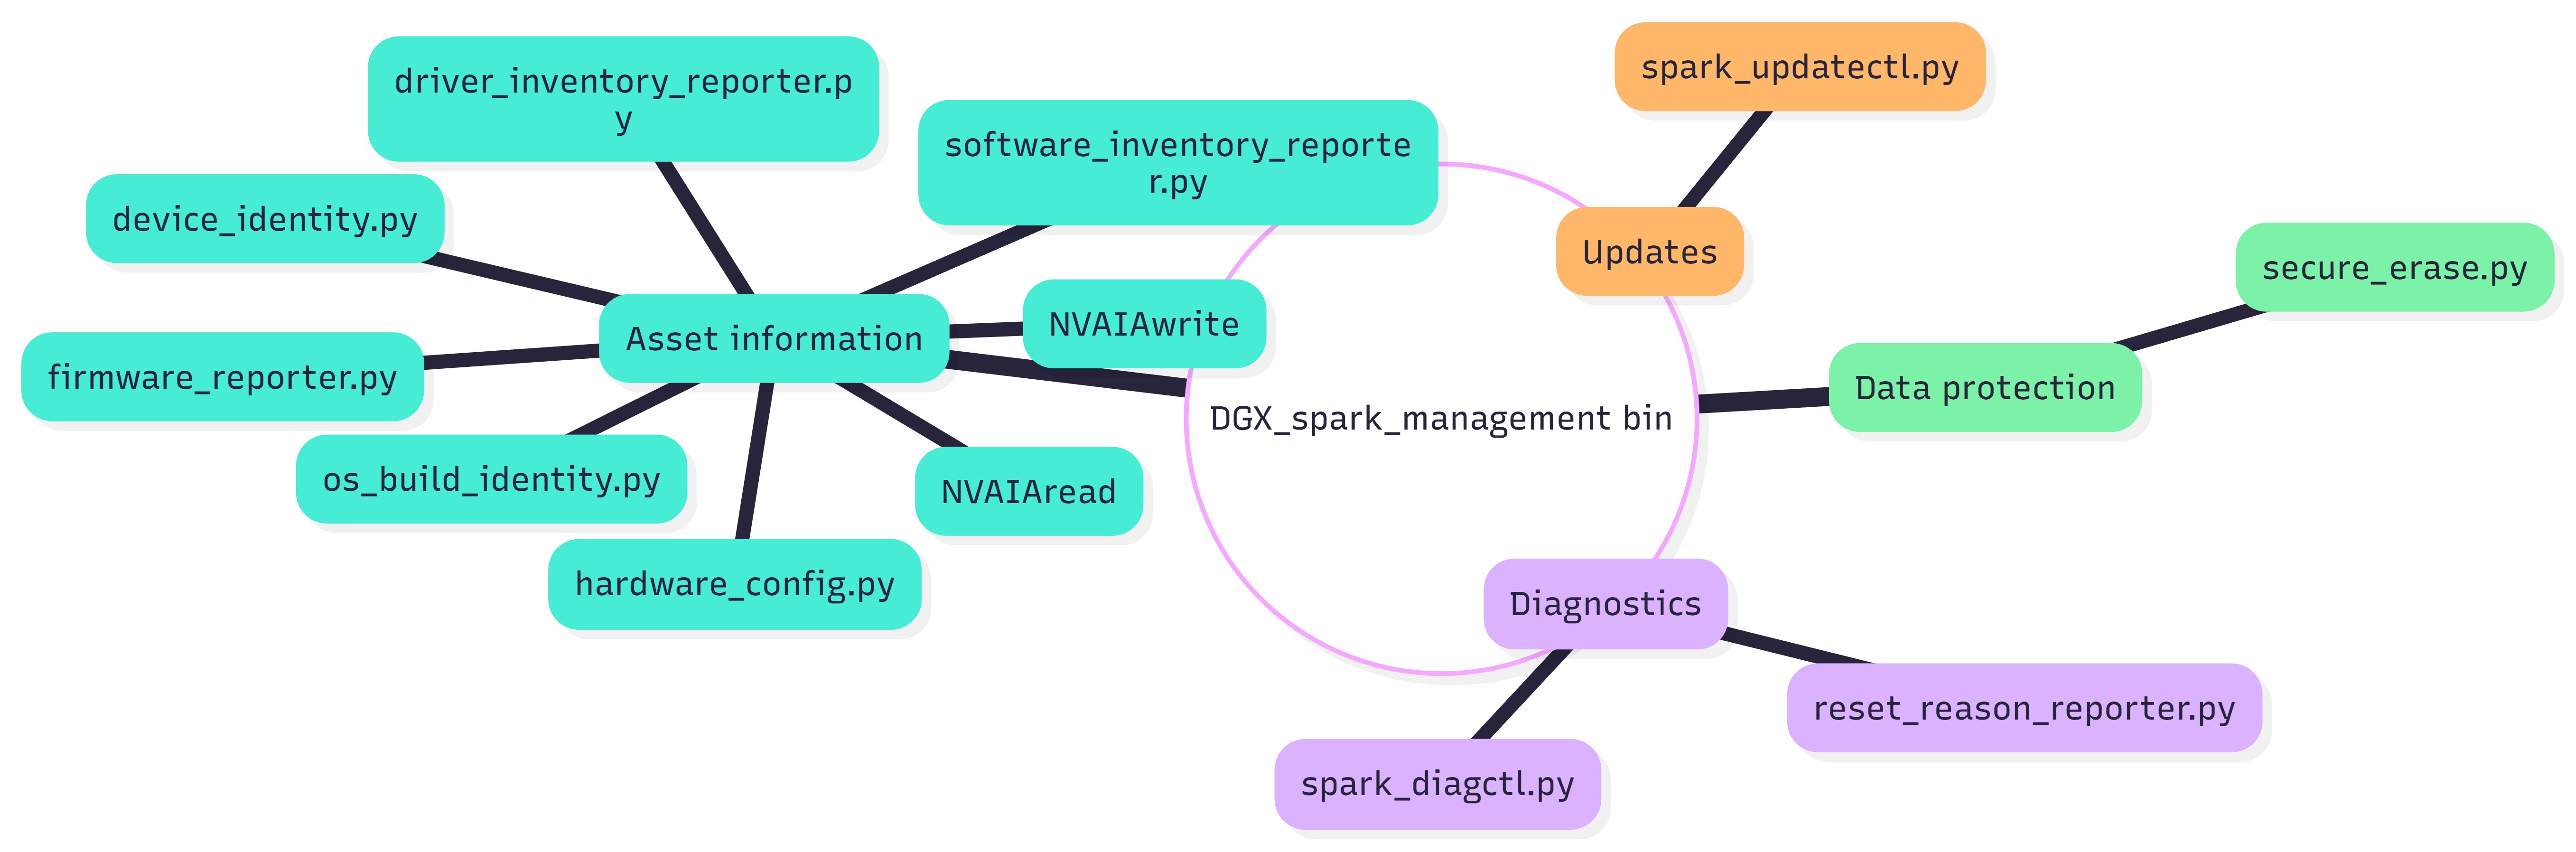
Figure 15: Example listing of DGX_spark_management/bin/ on a device.
Runtime Outputs and Logs#
Production tools and reference scripts write runtime output to:
/var/lib/dgx_spark_management/{functional_area}/{tool_or_script_name}/ Examples:
/var/lib/dgx_spark_management/clear_asset_information/hardware_inventory_collector/ device_identity.json
/var/lib/dgx_spark_management/controlled_sw_fw_updates/update_control_plane/ status.json
/var/lib/dgx_spark_management/remote_ops_remediation/ diagnostic_collector/diagnostics_full.json
Production logs are found under:
/var/log/dgx_spark/{functional_area}/{tool_name}/
Examples:
/var/log/dgx_spark/clear_asset_information/ hardware_inventory_collector/device_identity.log
/var/log/dgx_spark/controlled_sw_fw_updates/update_control_plane/spark_updatectl.log
/var/log/dgx_spark/remote_ops_remediation/diagnostic_collector/spark_diagctl.log
Landscape reference scripts store per-run evidence under:
/var/lib/dgx_spark_management/{functional_area}/{landscape_script}/run_<UTC>/
Category |
Location Pattern |
|---|---|
Production runtime outputs |
/var/lib/dgx_spark_management/ {functional_area}/{tool_name}/ |
Production logs |
/var/log/dgx_spark/ {functional_area}/{tool_name}/ |
Figure 16: Evidence flow — stdout JSON vs on-device evidence directory vs platform attachment.
Repository Layout Reference#
Use this subsection to locate folders and source files in the
DGX_spark_management/ script package. For the full directory tree and
runtime layout, see docs/core_docs/01_core_overview/02_PROJECT_STRUCTURE.md in the extracted archive.
Top-Level Repository Layout#
Path |
Purpose |
|---|---|
bin/ |
Installed production tool entrypoints (what operators run on endpoints) |
docs/ |
Architecture, structure, deployment, and tool references |
clear_asset_information/ |
Production tools: identity, hardware, firmware, OS build, drivers, software, asset tags |
controlled_sw_fw_updates/ |
Production tool: update control plane (reboot coordination, rollback reporting) |
remote_ops_remediation/ |
Production tools: diagnostics collector, reset reason reporter |
data_protection_privacy/ |
Production tool: data protection and privacy |
attestable_conformance_regulatory/ |
Landscape script: APT signing verification |
resilience_recovery_rollback/ |
Landscape scripts: boot integrity, backup levels, factory reset, watchdogs |
network_enterprise_connectivity/ |
Landscape scripts: support bundle collection, log retrieval |
security_posture_vuln_response/ |
Landscape script: encryption-at-rest reporting |
enrollment_identity_access/ |
Planned functional area placeholder |
integration_automation/ |
Planned functional area placeholder |
lifecycle_business_ops/ |
Planned functional area placeholder |
packaging/ |
Packaging artifacts (for example, systemd units) |
tools/ |
Development tooling helpers |
Where operators spend time
Operators and integrators typically use
bin/(installed commands) anddocs/(usage and integration guidance).Developers work primarily under functional area folders.
Production Tools: Command-to-Source Mapping#
Each production tool folder includes README.md, src/,
config/, and install.sh (installs into bin/).
Clear Asset Information (Seven Tools)#
Installed command |
Source root |
Notes |
|---|---|---|
device_identity.py |
clear_asset_information/hardware_inventory_collector/src/device_identity.py |
Stable identifier through SMBIOS/DMI logic |
hardware_config.py |
clear_asset_information/hardware_inventory_collector/src/hardware_config.py |
CPU/GPU/SSD/NIC/memory enumeration |
firmware_reporter.py |
clear_asset_information/firmware_version_reporter/src/firmware_reporter.py |
BIOS/UEFI/NIC/SSD/GPU firmware enumeration |
os_build_identity.py |
clear_asset_information/os_build_identity_reporter/src/os_build_identity.py |
OS build + DGX identity |
driver_inventory_reporter.py |
clear_asset_information/driver_inventory_reporter/src/driver_inventory_reporter.py |
GPU/NIC/storage/USB drivers |
software_inventory_reporter.py |
clear_asset_information/software_inventory_reporter/src/software_inventory_reporter.py |
dpkg/snap/pip/docker enumeration |
NVAIAwrite / NVAIAread |
clear_asset_information/asset_tag_manager/src/ |
UEFI-backed metadata store (read/write) |
Controlled Software/Firmware Updates (One Tool)#
Installed command |
Source root |
|---|---|
spark_updatectl.py |
controlled_sw_fw_updates/update_control_plane/src/spark_updatectl.py |
Remote Ops and Remediation (Two Tools)#
Installed command |
Source root |
|---|---|
spark_diagctl.py |
remote_ops_remediation/diagnostic_collector/src/spark_diagctl.py |
reset_reason_reporter.py |
remote_ops_remediation/reset_reason_reporter/src/reset_reason_reporter.py |
Lifecycle Mapping to the Actual Code in This Repository#
This section maps the lifecycle found in Lifecycle backbone (how enterprise IT actually runs fleets) to the tools and scripts in this repository.
Procurement and Receiving#
Relevant production tools:
bin/device_identity.py
bin/os_build_identity.py
bin/hardware_config.py
bin/firmware_reporter.py
Stage Objective |
Recommended Tools |
Outputs to Capture |
|---|---|---|
Acceptance snapshot |
Identity + build + HW + FW |
stdout JSON + stored on-device JSON paths |
Initial Provisioning#
Relevant production tools:
Identity, hardware, firmware, OS build, driver inventory, and software inventory
optional: bin/NVAIAwrite and bin/NVAIAread if UEFI-backed tags are used
Baseline Set |
Primary Tools |
Drift Anchor Fields |
|---|---|---|
Identity + build + inventories |
device_identity.py os_build_identity.py hardware_config.py firmware_reporter.py driver_i nventory_reporter.py software_i nventory_reporter.py |
OS build identity; firmware set; driver set; and critical package inventory hashes and counts |
Optional first-boot automation uses cloud-init with repacked BaseOS media; see Cloud-init for DGX Spark.
Cloud-init for DGX Spark#
This section explains cloud-init basics and how it supports automated first-boot provisioning of DGX Spark in enterprise deployments.
What is cloud-init#
Cloud-init is a widely used initialization framework that runs during the early boot process of Linux systems. It allows system configuration and provisioning tasks to be automated at first boot using simple configuration files. Originally developed for cloud environments, cloud-init is equally effective for provisioning physical devices such as DGX Spark systems.
For DGX Spark deployments, cloud-init enables administrators to apply configuration policies automatically when a device is first powered on, eliminating the need for manual setup.
Typical uses include:
Setting the system hostname and identity
Creating administrator accounts and installing SSH keys
Configuring networking or Wi-Fi profiles
Installing packages or applying update policies
Installing corporate certificates or proxy settings
Registering the system with enterprise management platforms
Cloud-init executes during the early stages of the boot process and normally runs once per instance, making it well suited for automated provisioning workflows.
DGX Spark Procedures#
On DGX Spark, cloud-init implements first-boot provisioning during the
Initial Provisioning lifecycle stage. Site-specific configuration
(users, packages, out-of-box experience behavior, and optional local
package or firmware mirrors) is delivered through repacked BaseOS media,
OEM cloud-init seeds, and optional OEMDATA USB layout.
For step-by-step procedures, USB partitioning, repack scripts, example
user-data files, and verification workflows, see
Custom Installation with cloud-init.
For general cloud-init module reference and behavior, see https://docs.cloud-init.io/en/latest/.
Ongoing Monitoring#
The following are relevant production tools:
bin/spark_diagctl.py (health posture and targeted collection modes)
bin/reset_reason_reporter.py
(Optional) Periodic drift re-checks using os_build_identity, driver_inventory, and firmware_reporter
Signal |
Source Tool |
Artifacts (if any) |
|---|---|---|
Health posture |
spark_diagctl.py |
Optional bundle modes |
Reset context |
reset_reason_reporter.py |
None |
Maintenance Windows#
The following are relevant production tools:
bin/spark_updatectl.py
Validation tools: os_build_identity, spark_diagctl, optional driver or firmware tools
Phase |
Tools |
Evidence |
|---|---|---|
Pre-check |
Build identity + health |
stdout JSON |
Update control |
spark_updatectl.py |
stdout JSON + optional artifact |
Post-check |
Build identity + health |
stdout JSON |
Incident Response#
Relevant production tools:
Level 1: Targeted triage: spark_diagctl health, reset_reason_reporter, plus identity, build, and drivers as needed
Level 2 Deep evidence: spark_diagctl bundle collection modes. Relevant reference scripts (Landscape environments) include log retrieval and support bundle collection scripts under network_enterprise_connectivity/
Level |
Tools and Scripts |
Output Handling Expectation |
|---|---|---|
Level 1 |
Bounded collectors |
stdout JSON only |
Level 2 |
Bundle modes / reference scripts |
stdout JSON + artifacts/evidence |
Cascade and Redeployment#
Cascade and redeployment is a re-provisioning motion:
The device changes user, function, or environment
The lifecycle loop returns to provisioning steps while preserving linkage to prior history, if desired.
Relevant production tools:
Provisioning baseline set (identity, build, hardware, firmware, drivers, and software)
Optional tag tools, if used to mark new function or owner. Relevant reference scripts (Landscape environments) include factory reset and re-provisioning examples under resilience_recovery_rollback/
Motion |
Recommended Steps |
Evidence to Capture |
|---|---|---|
Re-provision |
Baseline re-capture or optional reset |
New baseline JSON plus optional reset evidence |
Tool Locations and Reference Code Map#
This section explains the tools and example implementations inside the project repository. The goal is to make it easy to locate the correct scripts, understand what they do, and embed them into enterprise platform wrappers without copying large files.
Repository Layout Conventions Used in This Section#
It is assumed that the repository organizes content into:
Tools: Scripts or binaries invoked remotely (collectors and controllers).
Reference code: Examples used to demonstrate platform integration patterns.
Platform wrappers: Example job scripts for specific management platforms.
Artifacts: Optional bundles (diagnostics or logs) created on demand.
To avoid repeating paths everywhere, define a single canonical base path and reuse it.
Note: In the provided examples, the tool directory is referenced as a single variable (for example, dgx_tool_dir). Replace it with your repo’s actual path on the device.
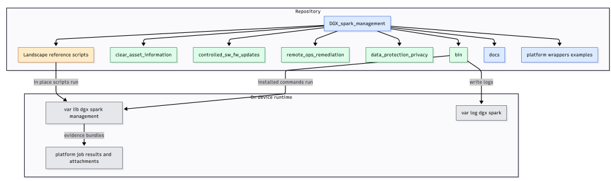
Figure 17: Repo layout — tools, reference code, wrappers, and artifacts.
Canonical Tool Directory and Naming Scheme#
For readability and consistency, it is assumed that:
Collectors are named *.py and emit one JSON envelope on stdout
Controllers are also *.json but are gated and validated
Artifact generators indicate artifact creation and return pointers in artifacts
Category |
Convention |
|---|---|
Collector |
Name ends in .json; read-only; safe to run frequently; bounded output |
Controller |
Name ends in .json; changes state; gated; includes precheck= and postcheck guidance |
Artifact generator |
Name indicates bundle creation; stdout JSON returns artifact pointer list |
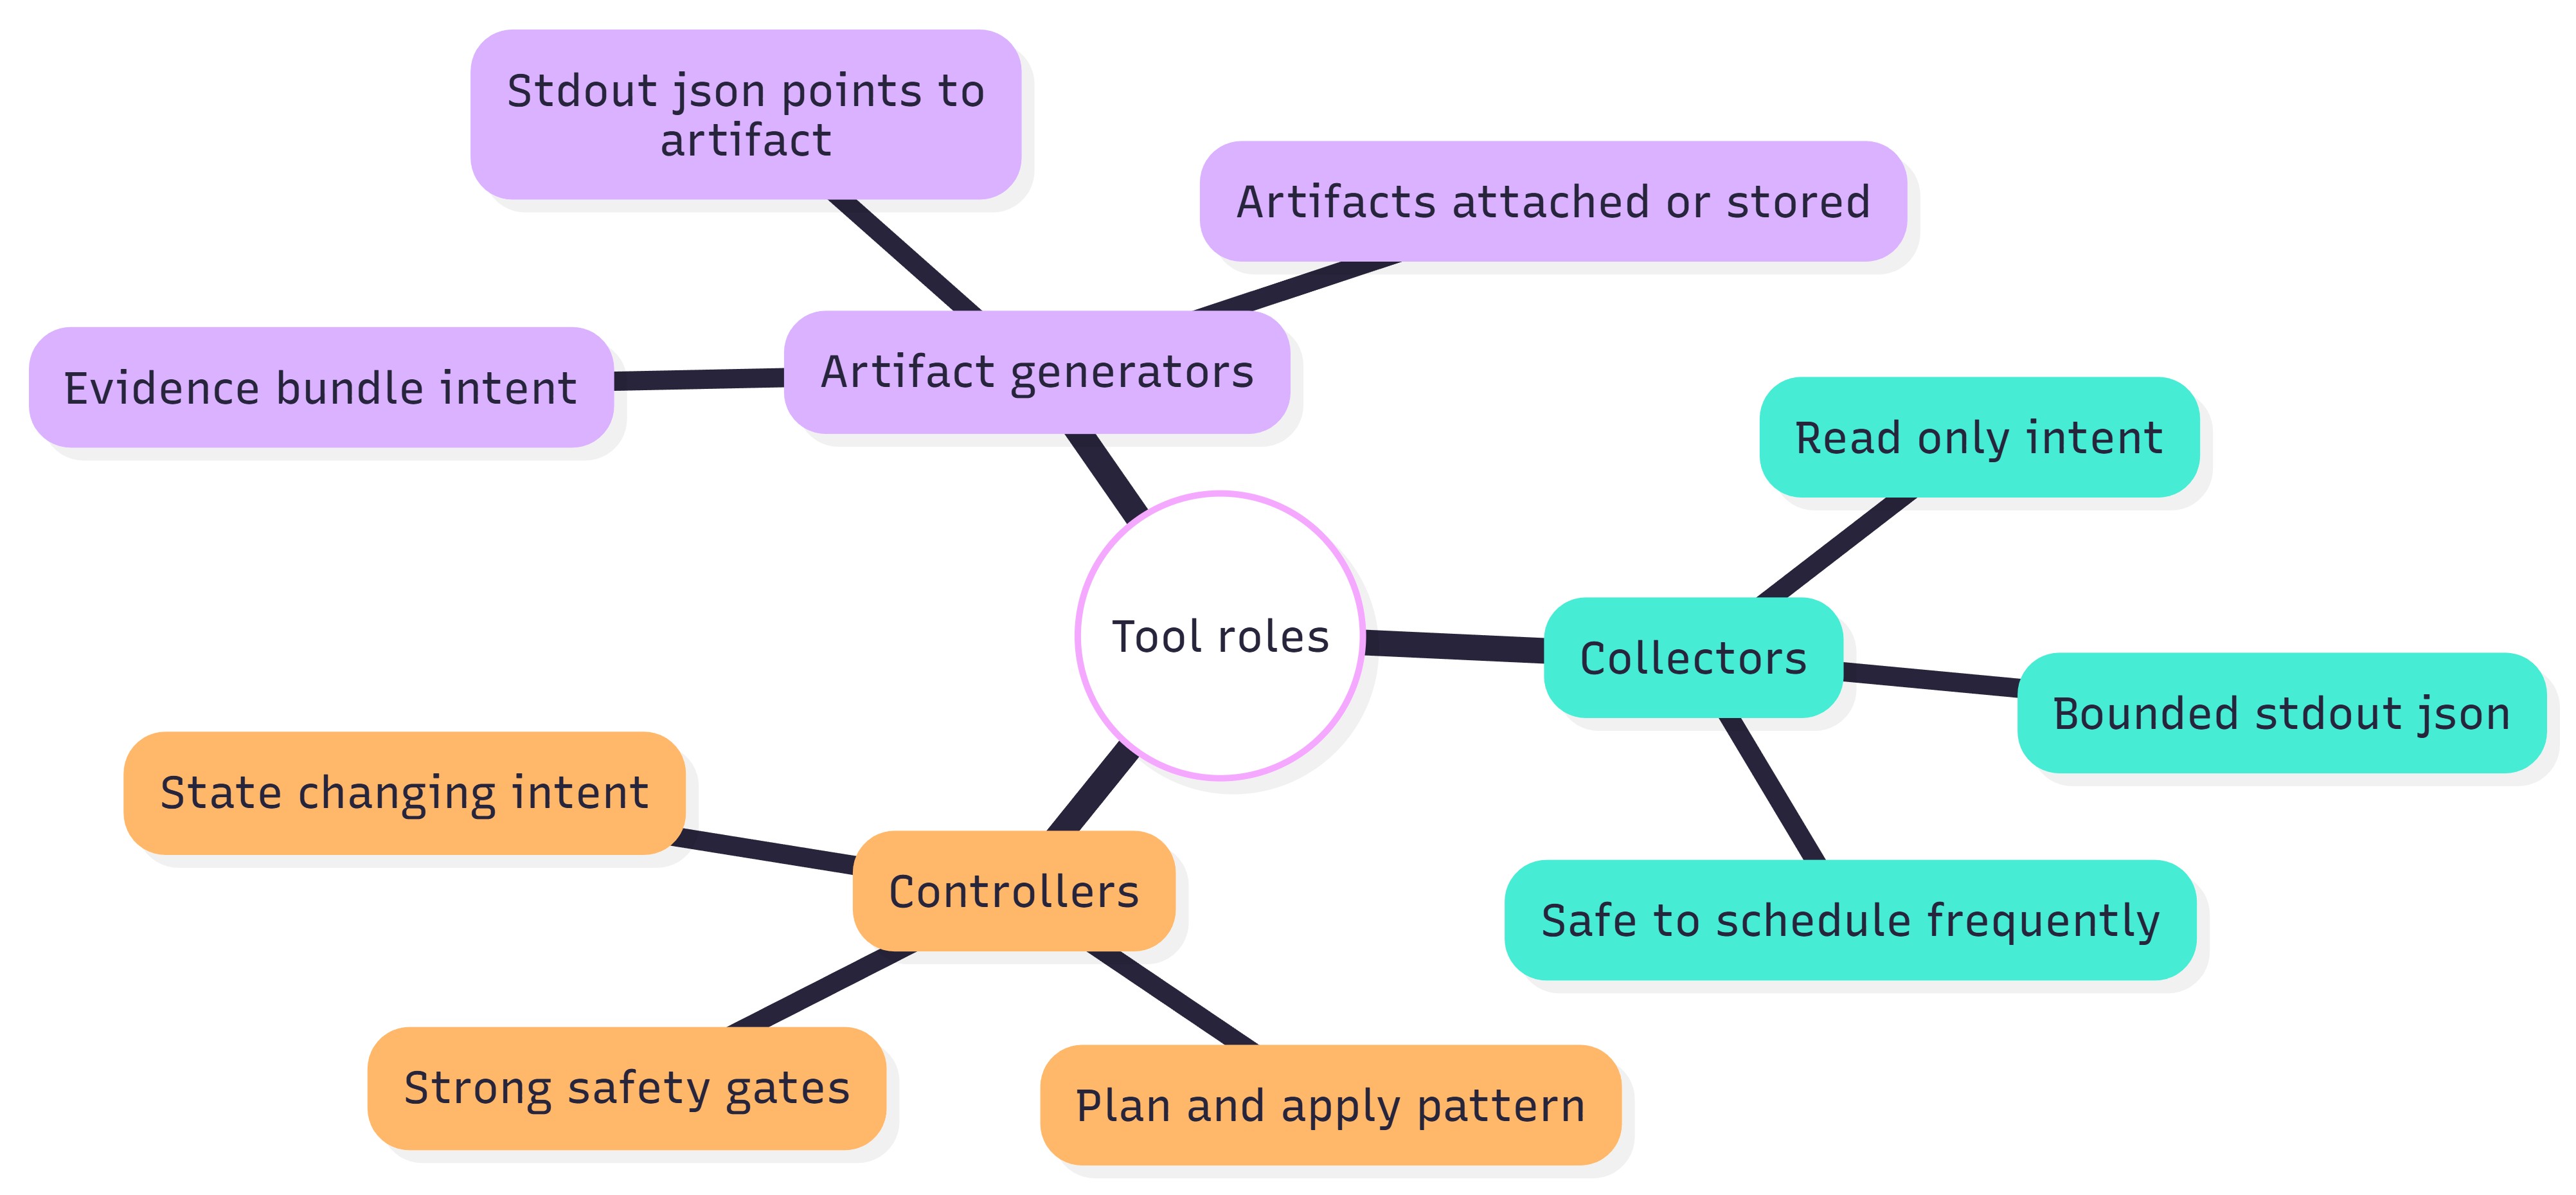
Figure 18: Naming scheme — collectors vs controllers vs artifact generators.
Reference Code Map#
See Canonical Landscape reference scripts (8) for the full list of Landscape reference scripts and their purposes. Enrollment is required before running them; see Ubuntu Pro and Landscape client enrollment.
How to Use These References#
Treat these directories as examples of platform wrapper integration and evidence minimization. For production automation, use the guide’s standardized collector and controller tools and keep wrapper scripts thin.
Tool Invocation Patterns#
Across all platforms, it is assumed that the same invocation pattern is used:
SSH executes a tool from the canonical tool directory.
The tool emits one JSON envelope on stdout.
The platform stores stdout JSON verbatim and parses it off-box.
Artifacts are created only on demand; stdout returns pointers.
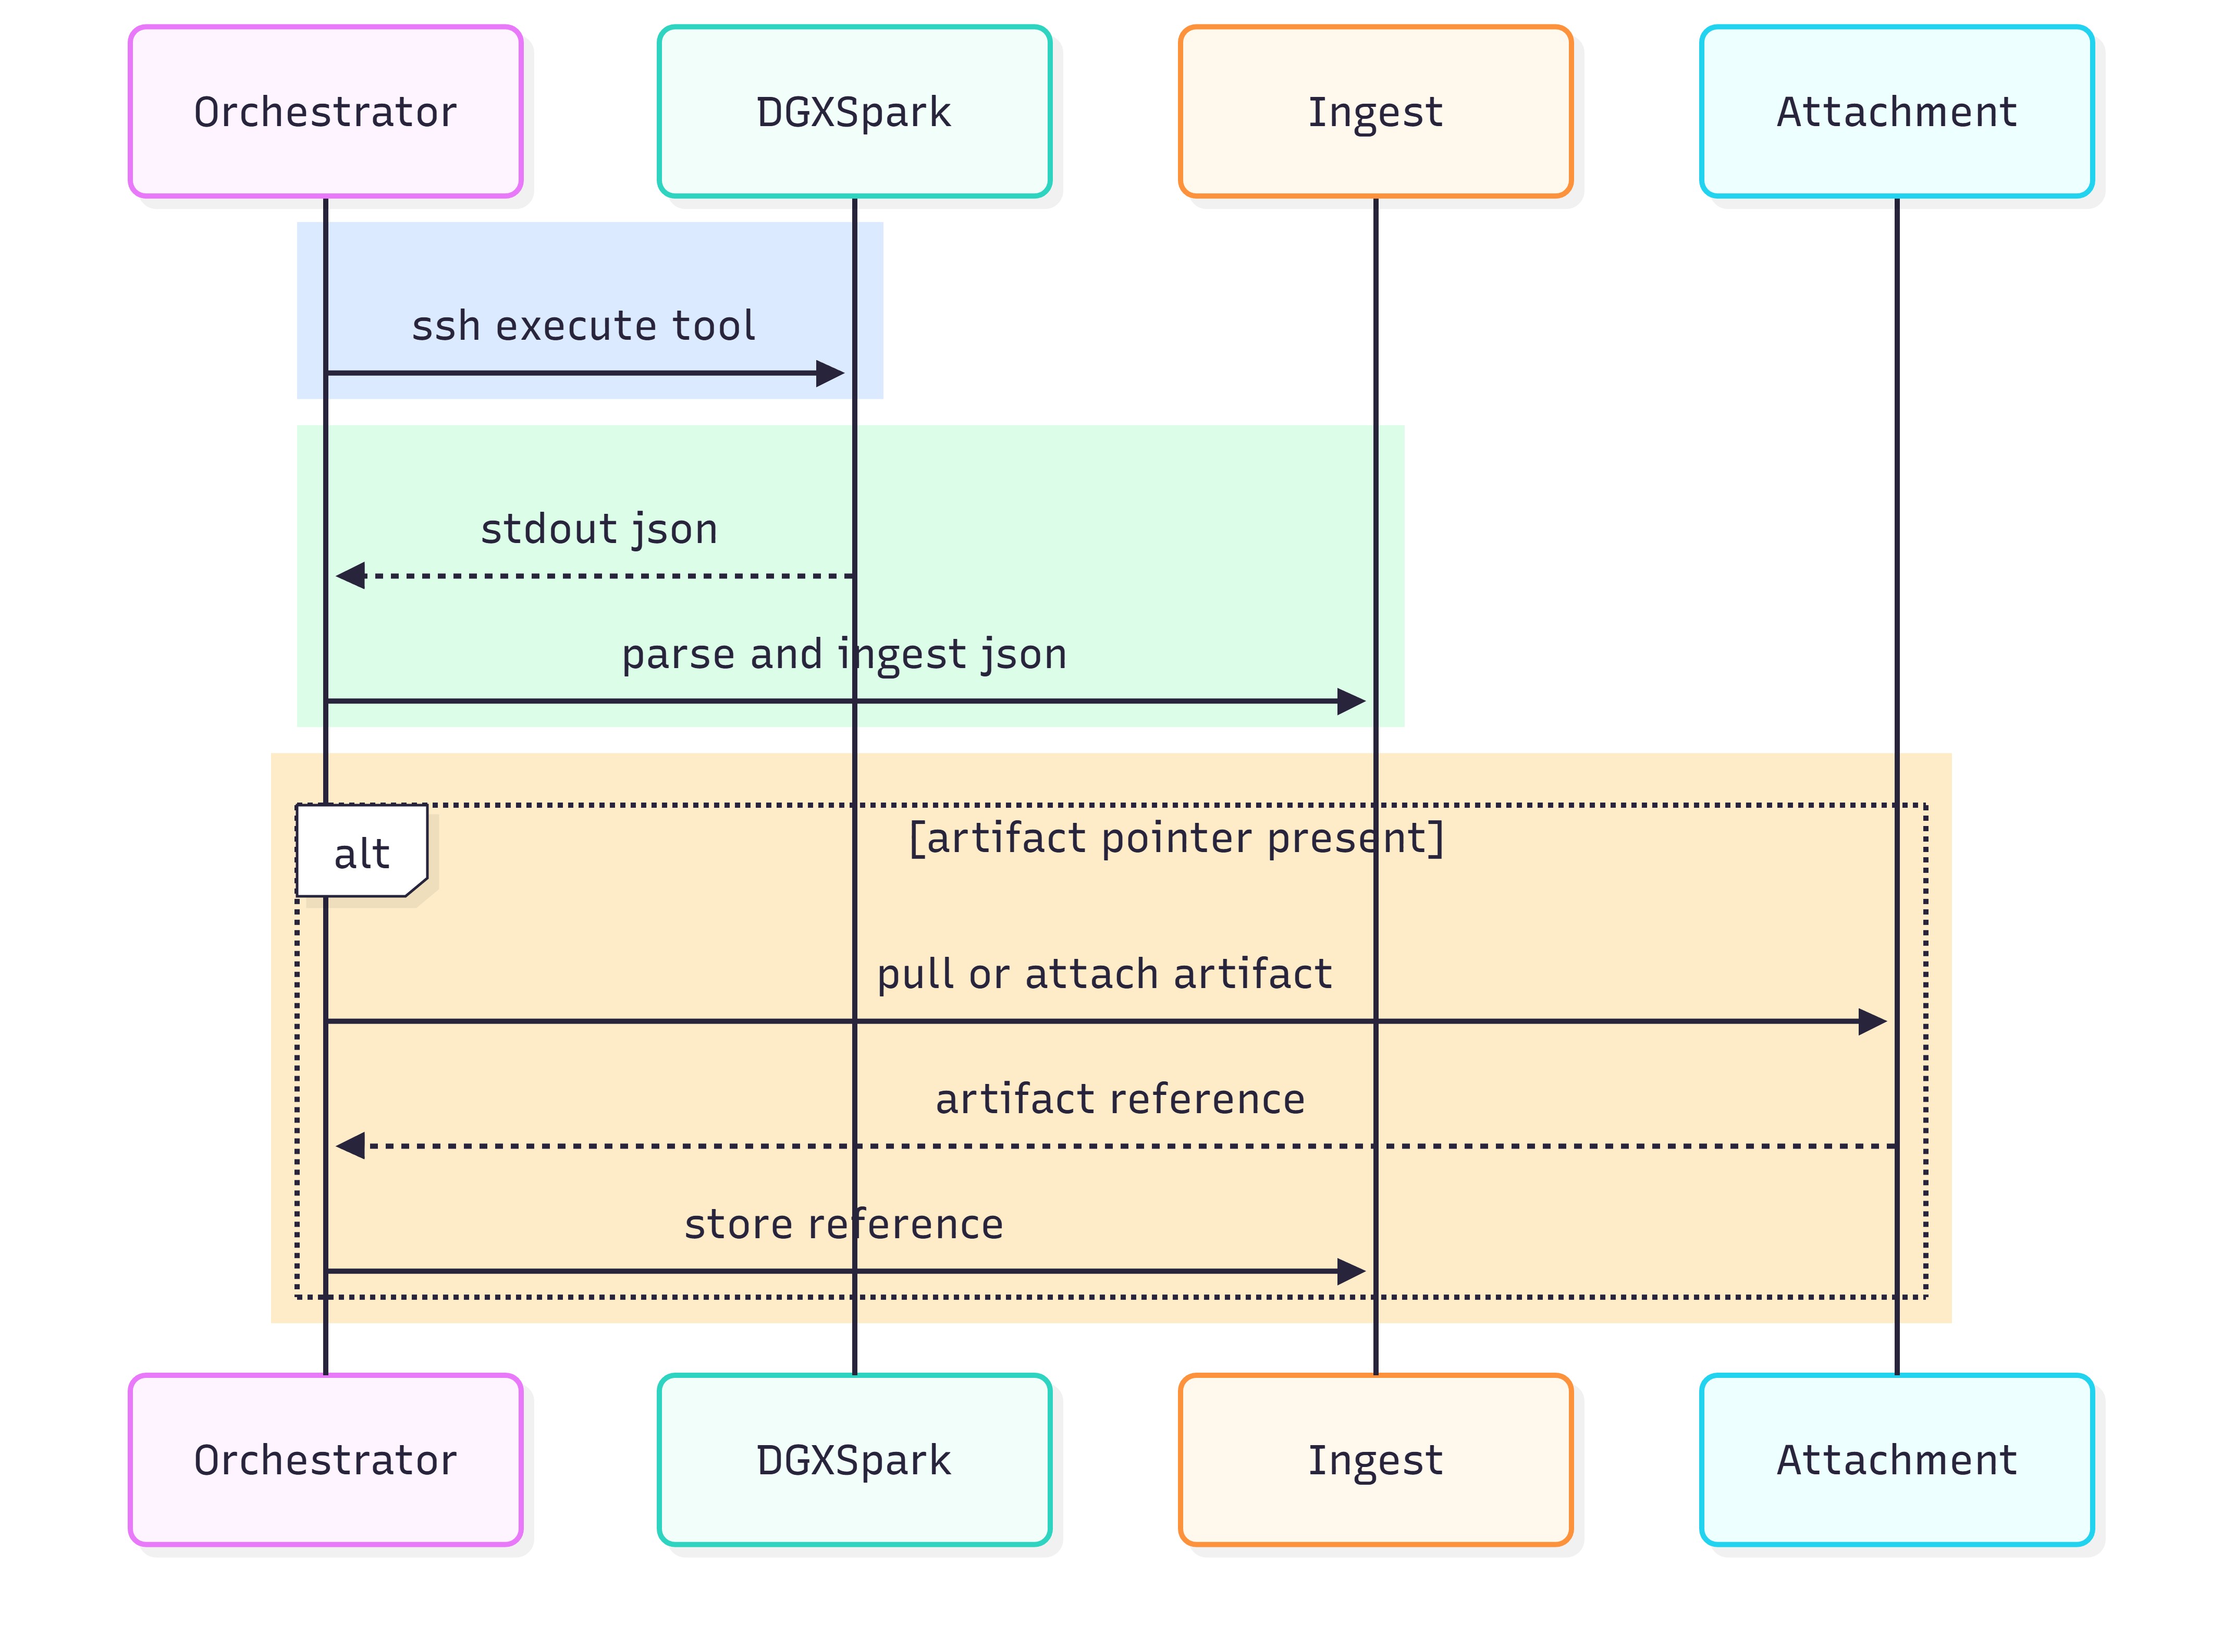
Figure 19: Invocation contract — SSH executes tool → stdout JSON → ingest; optional artifacts by pointer.
Embedding Paths in Examples#
To keep the document readable, examples should not hardcode long paths repeatedly. Use one variable name consistently, and document where the variable is set per platform.
Platform Wrapper |
How to Represent the Tool Path |
|---|---|
Windows scripts |
Set a single variable and call tools via that variable |
Ansible |
Use a vars: entry such as dgx_tool_dir and reference it in tasks |
Landscape jobs |
Use the job definition to call a script in-place, or call a canonical tool directory |
BigFix/Tanium |
Store the SSH wrapper centrally and pass the tool path as a parameter |
Recommendation
In later sections, whenever you see dgx_tool_dir, replace it with the actual installed location on the endpoint. Keep the replacement consistent across all playbooks and wrappers.
Evidence Minimization (stdout vs artifacts)#
This repository includes examples that write evidence to disk (for later retrieval). That pattern is correct for large evidence and diagnostics, but stdout must remain bounded.
Use this decision rule:
If the result is small and can be summarized, return it in stdout JSON.
If the result is large, generate an artifact and return a pointer in stdout JSON.
Case |
Preferred Handling |
|---|---|
Routine inventory and health signals |
stdout JSON summary only |
Long logs or large inventories |
artifact bundle + pointer in stdout JSON |
Incident response deep evidence |
artifact bundle + hashes + retrieval hint |
Audit or retirement proofs |
stdout JSON certificate + artifact evidence as required |
For additional information on evidence minimization, see Artifact Strategy and Evidence Handling: Summary First, Artifacts on Demand.
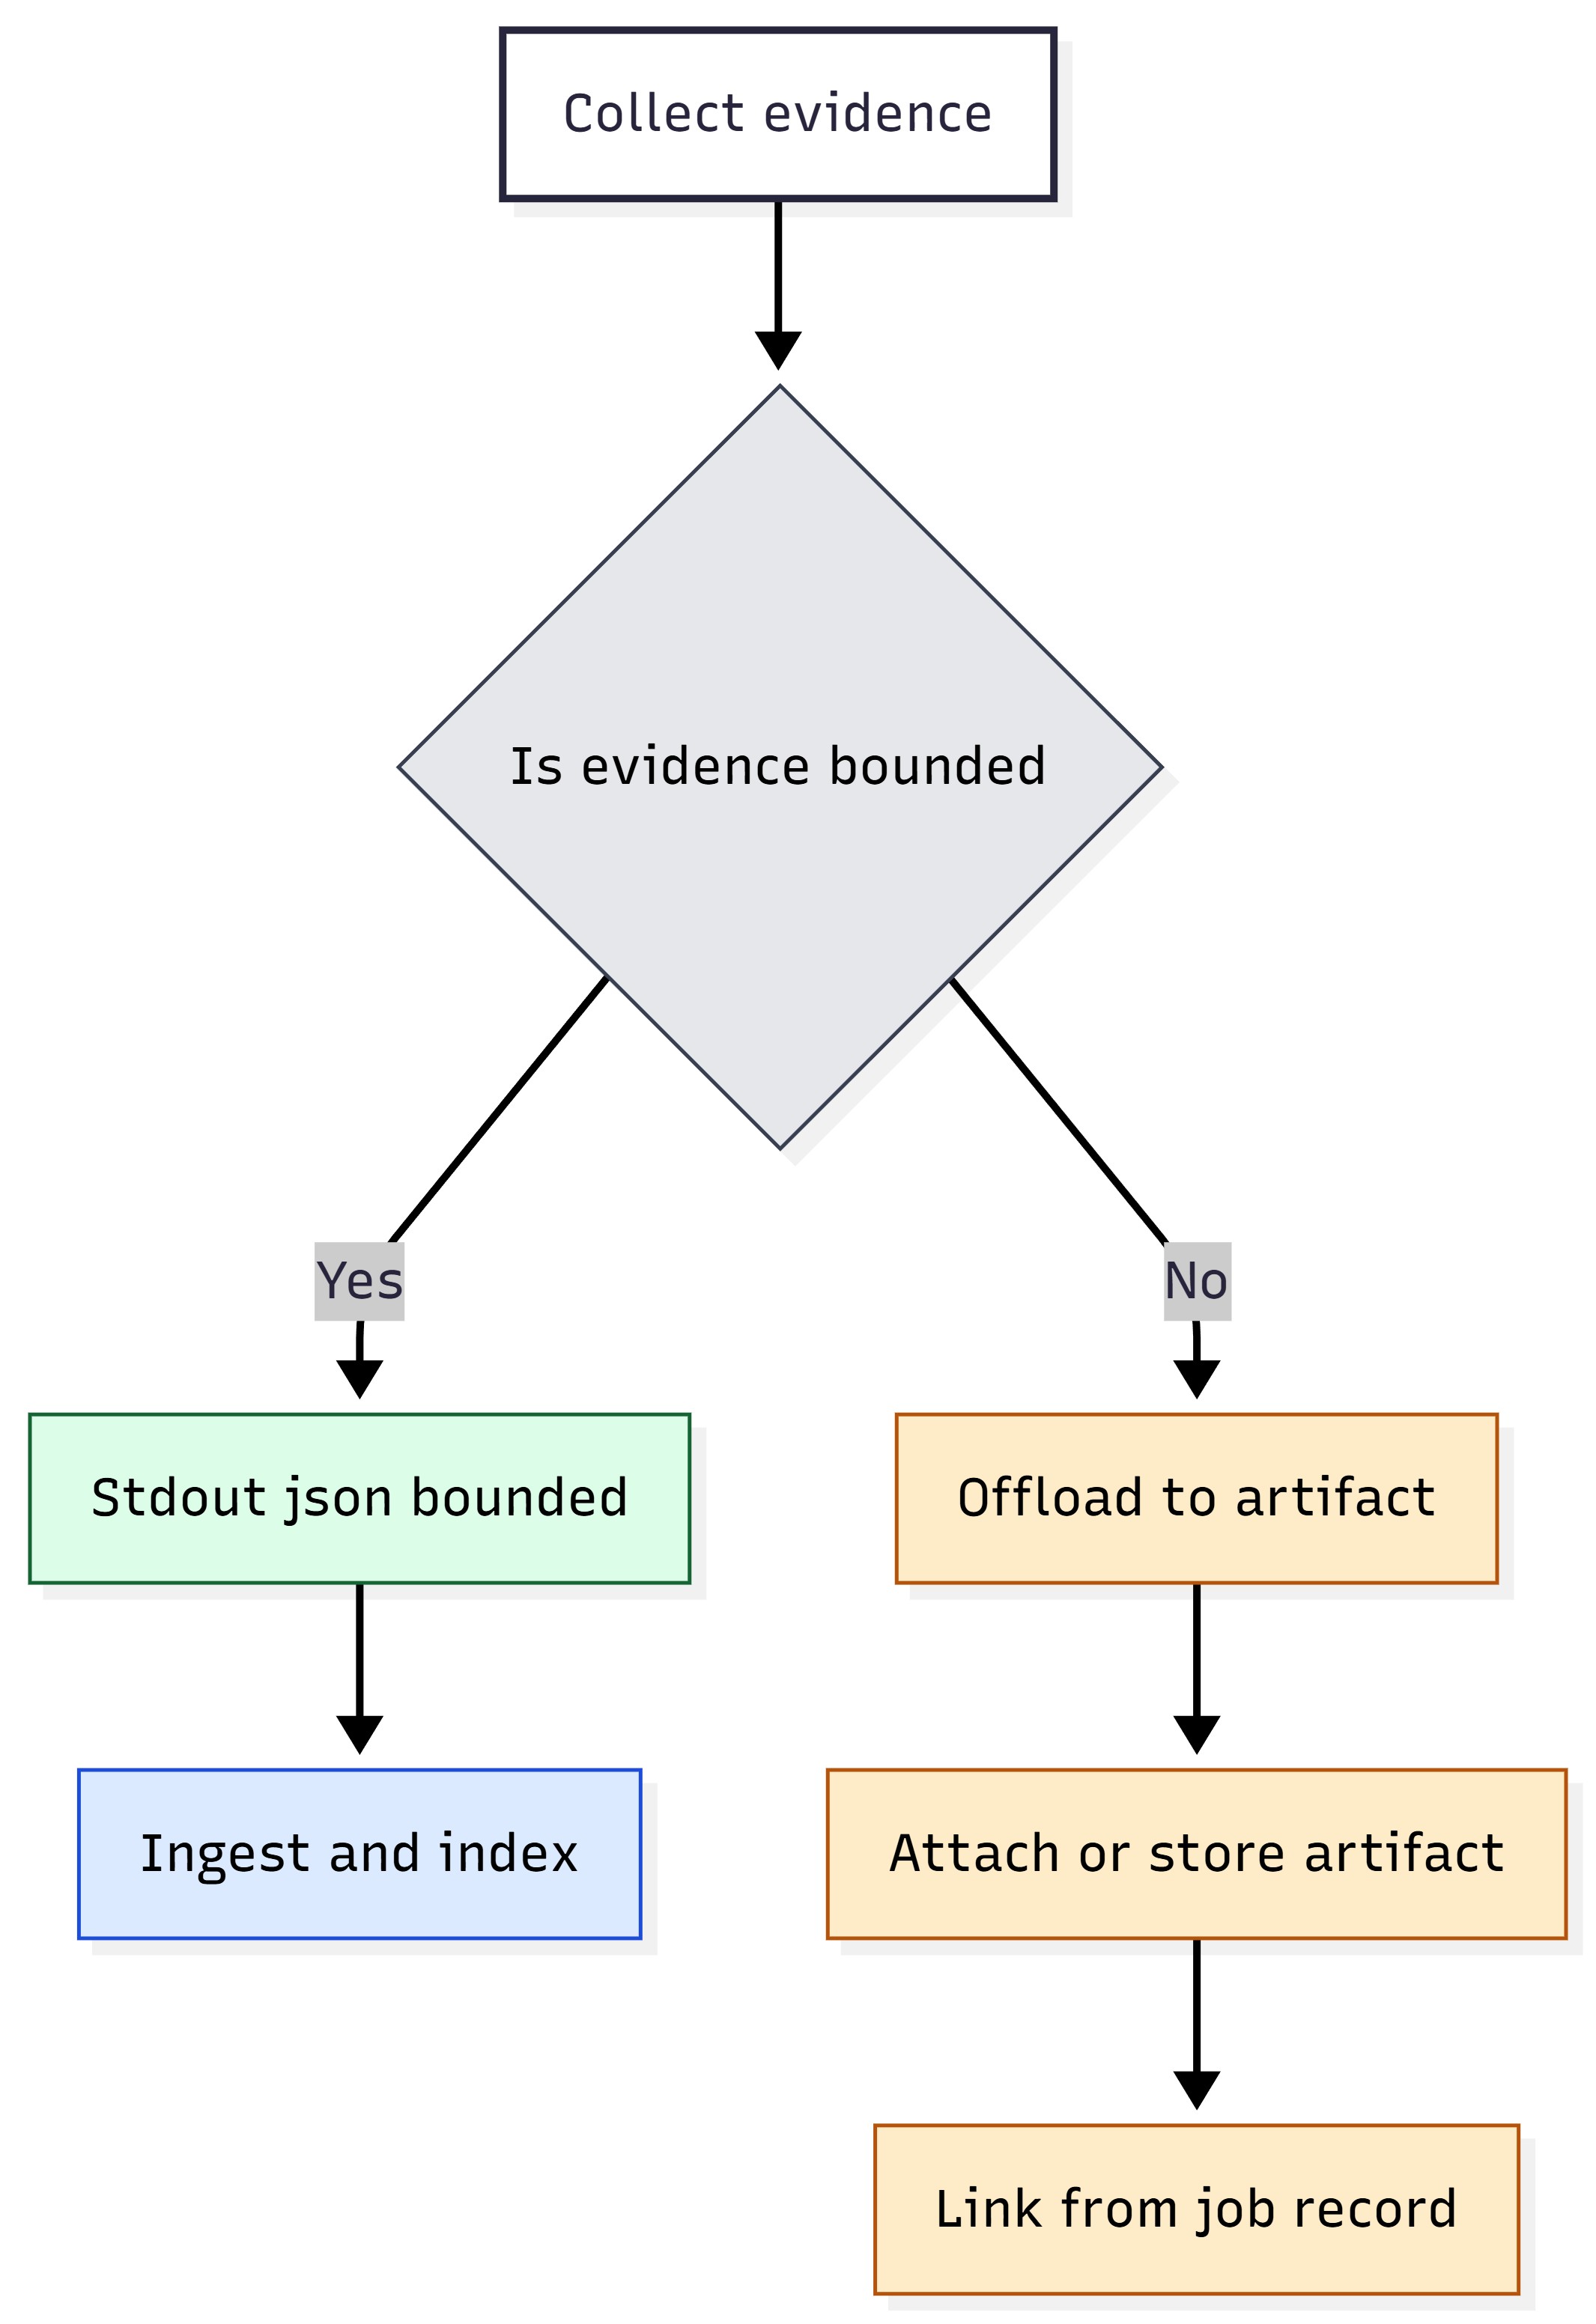
Figure 20: Evidence minimization — bounded stdout JSON vs artifact offload.
Platform Wrapper Patterns and Packaging Examples#
This section shows examples of how to package the guide’s SSH + stdout-JSON tooling model inside common enterprise platforms.
Key takeaways: Consider the same model as found in JSON-first, agentless SSH execution model and Artifact Strategy (execute → capture stdout JSON → optionally pull artifacts). Use collectors (safe, frequent) vs controllers (gated, validated).
Common Packaging Principles (Applies to All Platforms)#
Output Sizing#
Consider the same principle as in Artifact Strategy: keep stdout bounded and use artifacts for large evidence. Most platforms impose stdout or result-size limits. Packaging should treat:
stdout JSON as the authoritative small record
Large bundles (diagnostics tarball, large logs, or full inventories) as attachments or artifacts
Output Type |
Packaging Guidance |
|---|---|
stdout JSON |
Bounded summary, stable envelope, safe to index and ingest |
stderr |
Keep for debugging. Do not rely on it for structured data. |
Artifacts |
Use for large evidence. Attach or store and return pointers in JSON. |
Recommendation
If a platform truncates outputs, treat the truncation as a correctness failure. Reduce stdout size or switch the payload to an artifact generator that returns only a pointer on stdout.
Ansible Playbook Examples (Agentless SSH-Native)#
Ansible aligns naturally with this information because it is SSH-native and can fetch files. These examples focus on:
Running the installed tools on each host
Capturing JSON results per host
Optionally fetching artifacts
Inventory Assumption |
Conceptual Guidance |
|---|---|
Host grouping |
Use groups for rings or waves (such as pilot, wave1, wave2, or broad) |
Connection |
SSH keys and non-interactive execution; bastion if required |
Privilege |
Use become for controllers; keep collectors unprivileged when possible |
Outputs |
Write stdout JSON per-host; collect centrally; parse off-box |
Example: Provisioning Baseline (Conceptual)#
— name: Provisioning baseline (collectors) hosts: dgx_spark gather_facts: no vars:
dgx_tool_dir: /path/to/tools # set per Part 4 tasks: - name: Collect identity/build
shell: “sudo {{ dgx_tool_dir }}/identity.json” register: identity_out changed_when: false
name: Collect hardware/firmware/driver/software inventories shell: “sudo {{ dgx_tool_dir }}/inventory.json” register: inv_out changed_when: false
name: Write results (stdout JSON) per-host copy:
content: “{{ identity_out.stdout }}n” dest: “./out/{{ inventory_hostname }}_identity.json” - name: Write inventory JSON per-host copy:
content: “{{ inv_out.stdout }}n”
dest: “./out/{{ inventory_hostname }}_inventory.json”
Example: Monitoring Snapshot#
— name: Monitoring snapshot (collectors) hosts: dgx_spark gather_facts: no vars:
dgx_tool_dir: /path/to/tools # set per Part 4 tasks: - name: Health check
shell: “sudo {{ dgx_tool_dir }}/spark_diagctl.py “ register: health_out changed_when: false
name: Reset reason
shell: “sudo {{ dgx_tool_dir }}/reset_reason.json” register: reset_out changed_when: false
name: Save JSON outputs copy:
content: “{{ health_out.stdout }}n” dest: “./out/{{ inventory_hostname }}_health.json”
name: Save reset reason JSON copy:
content: “{{ reset_out.stdout }}n”
dest: “./out/{{ inventory_hostname }}_reset_reason.json”
Example: Incident Response L2#
— name: Incident response L2 (artifact bundle) hosts: dgx_spark gather_facts: no vars:
dgx_tool_dir: /path/to/tools # set per Part 4 tasks:
name: Trigger diagnostics bundle
shell: “sudo {{ dgx_tool_dir }}/diag_collect.json” register: diag_out
name: Save diagnostics JSON copy:
content: “{{ diag_out.stdout }}n”
dest: “./out/{{ inventory_hostname }}_diag_collect.json”
name: Fetch artifact (conceptual) # Replace with a real fetch that reads the artifact pointer from JSON fetch:
src: “/path/on/device/to/artifact.tar.gz”
dest: “./artifacts/{{ inventory_hostname }}_artifact.tar.gz” flat: yes
Ubuntu Pro and Landscape Client Enrollment#
Complete these steps before using the Landscape reference scripts in Canonical Landscape reference scripts (8) or the job examples in Canonical Landscape script examples. Download and extract Enterprise Lifecycle Integration Scripts package (ZIP) if you have not already done so.
For the most up-to-date information, see Landscape installation and set-up - Landscape documentation.
Scope: These steps target Landscape SaaS enrollment through Ubuntu Pro
(sudo pro enable landscape with Self-hosted server? set to No).
Self-hosted Landscape deployments can differ; follow Canonical’s
documentation for those environments.
Landscape SaaS enrollment requires Ubuntu Pro. The following steps enable Ubuntu Pro services and enroll a DGX Spark as a Landscape client.
Register for Ubuntu One.
Go to Ubuntu Pro and register for an Ubuntu One account.
Create a Landscape account.
Open a browser.
Navigate to https://landscape.canonical.com.
Sign in using Ubuntu One.
Create a new organization or join an existing one.
Record your account name (organization name). You need this value during client enrollment.
Attach Ubuntu Pro on the DGX Spark.
Landscape SaaS enrollment requires Ubuntu Pro. On the DGX Spark, check status:
sudo pro status
If the system is not attached, run:
sudo pro attach <YOUR_UBUNTU_PRO_TOKEN>
Obtain the token from https://ubuntu.com/pro, then verify attachment:
sudo pro status
You should see Attached: yes.
Enable Landscape (interactive mode).
Run:
sudo pro enable landscape
When prompted, enter:
Self-hosted server?: No
Computer title: for example,
dgx-spark-01Account name: your Landscape organization name
This process installs, configures, and starts the Landscape client.
Approve the machine in the Landscape portal.
Return to the Landscape web portal.
Navigate to Pending Machines.
Select the DGX Spark system.
Click Accept.
The system appears in your managed machines list.
Verify client operation.
sudo systemctl status landscape-client
You should see Active: active (running).
If needed, check the logs:
sudo tail -n 50 /var/log/landscape/client.log
After enrollment, you can use Landscape to:
Apply tags (for example, DGX, Spark, AI-node)
Execute remote scripts
Schedule updates
Monitor package and security status
Create access groups
Define update and compliance policies
Canonical Landscape Script Examples#
Complete Ubuntu Pro and Landscape client enrollment before running these jobs.
Script paths below are relative to the root of the extracted Enterprise Lifecycle Integration Scripts package (ZIP).
Canonical Landscape is included because the repository provides reference scripts that illustrate platform job integration. They are not meant to replace production tools. They demonstrate:
Integrating health and security checks into Canonical Landscape jobs
Producing bounded stdout results
Writing evidence to disk for later retrieval
Reference script locations (from Tool locations and reference code map):
attestable_conformance_regulatory/landscape_signing_verification/
resilience_recovery_rollback/landscape_verified_boot_integrity/
resilience_recovery_rollback/landscape_recovery_backup_levels/
resilience_recovery_rollback/landscape_factory_reset_reprovision/
resilience_recovery_rollback/landscape_health_watchdogs/
network_enterprise_connectivity/landscape_collect_package/
network_enterprise_connectivity/landscape_retrieve_logs_stdout/
security_posture_vuln_response/landscape_encryption_at_rest/
For example, the following is an APT signing verification (conceptual)
# Landscape job (conceptual)
# - run signing verification
# - emit bounded PASS/FAIL/UNKNOWN on stdout # - write evidence to a directory for retrieval
run_signing_verification emit_stdout_summary write_evidence_dir
Example: Verified Boot Integrity#
# Landscape job (conceptual)
# - check verified boot signals
# - emit bounded summary
# - store evidence for later retrieval
check_verified_boot emit_stdout_summary write_evidence_dir
Example: Factory Reset with Reprovision#
# Landscape job (conceptual)
# - customer-gated reset workflow # - emit
retirement/reset certificate JSON on stdout # -
store evidence and logs
validate_gate_conditions perform_reset emit_stdout_certificate write_evidence_dir
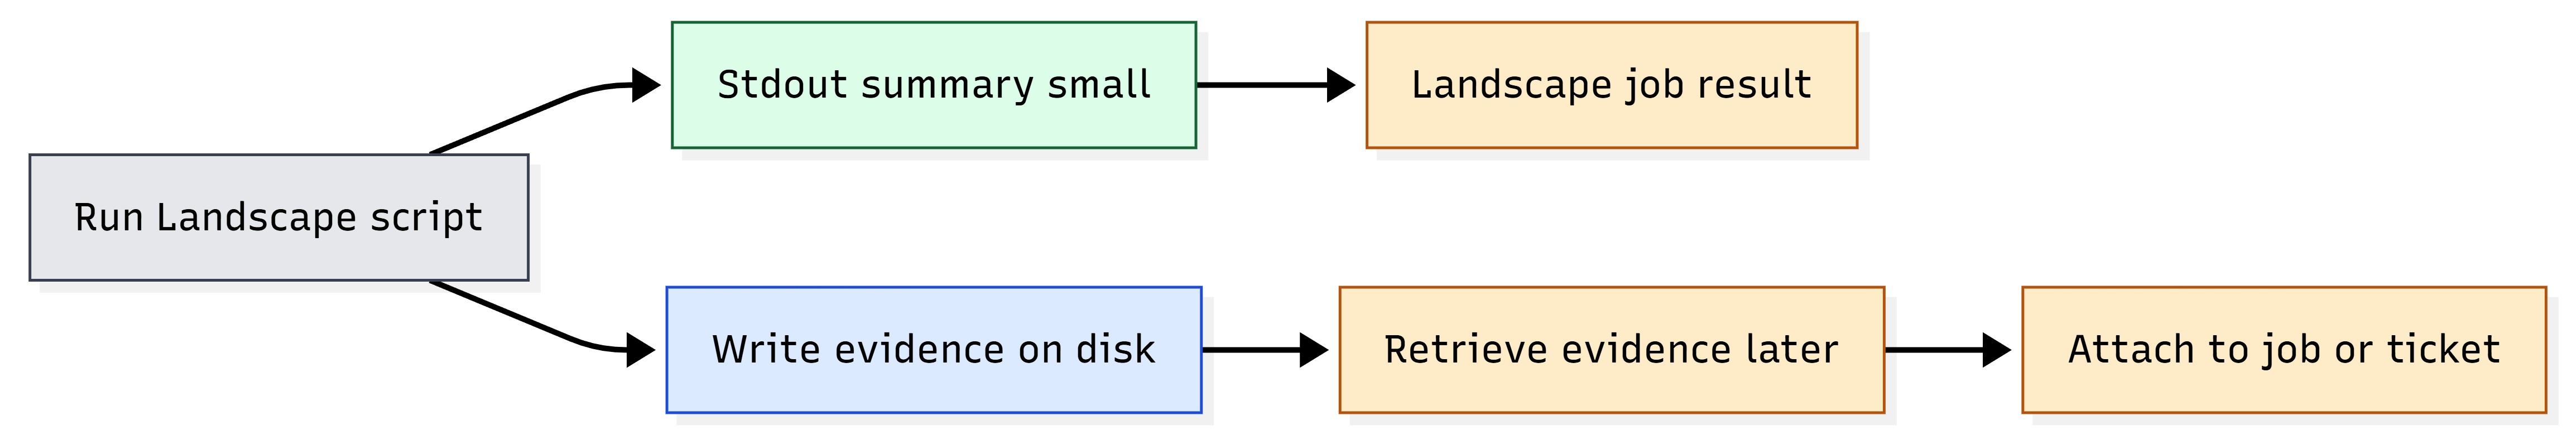
Figure 21: Landscape constraints — stdout summary vs evidence-on-disk retrieval pattern.
Tanium Package Patterns#
Tanium often implements operations through:
Packages or modules that run scripts
Results captured in question outputs or package logs
Attachments handled through platform mechanisms
These patterns show:
Packaging lifecycle SSH payloads as Tanium packages
Storing stdout JSON as package output (small)
Storing large bundles as attachments
Tanium Concept |
Documentation Mapping |
|---|---|
Package |
Wrapper payload that runs SSH tools and captures stdout JSON |
Question and result |
Ingested JSON summary for reporting and filtering |
Package logs |
stderr and troubleshooting context |
Attachments |
Artifacts (bundles) referenced by JSON pointers |
Pattern: Provisioning Baseline Package (Conceptual)#
# Tanium package (conceptual)
# - run baseline collectors over SSH
# - store stdout JSON per-host
run_ssh_identity run_ssh_inventory store_json_outputs
Pattern: Monitoring Snapshot Package (Conceptual)#
# Tanium package (conceptual)
# - run health/reset reason
# - store minimal JSON
run_ssh_health run_ssh_reset_reason store_json_outputs
Notes for Puppet and Chef (Drift and Scheduled Execution)#
Puppet and Chef are well-suited for:
Periodic execution of collectors (inventory or monitoring)
Enforcing baseline presence of tooling
Scheduled drift detection against known-good baselines
They are not typically used for interactive incident response bundles but can trigger them if desired.
Use Case |
Usage |
|---|---|
Tooling presence |
Ensure the tool directory and dependencies exist on endpoints |
Scheduled collectors |
Run bounded collectors on a cadence. Forward JSON off-box. |
Drift detection |
Compare baseline summaries to current summaries and flag divergence |
Controllers |
Use sparingly. Prefer change-window orchestration platforms for risky actions. |
Incident bundles |
Possible, but generally better triggered by incident orchestration flows |