Debugging Operator
Visual Studio Code (VSCode) supports Remote Debugging through Python extension.
Using the feature, bundled segmentation operators are configured to support debugging while developing/testing operators locally.
(sdk folder)/clara-reference-app/Operators/ai includes debug_app_docker.sh script to support debugging AI operator with VSCode.
            USAGE: ./debug_app_docker.sh [-p <number>] [app_name] [model_name]

  -p <number>           Remote debug port number to use (default: 3000)
  -h                    Help message

Args
  app_name   - application name (e.g., app_livertumor)
  model_name - model name (e.g., segmentation_liver_v1)

Examples
  ./debug_app_docker.sh                                                              # Livertumor AI (default)
  ./debug_app_docker.sh app_braintumor segmentation_mri_brain_tumors_br16_t1c2tc_v1  # Braintumor AI
  ./debug_app_docker.sh app_vnet                                                     # Organ Segmentation AI
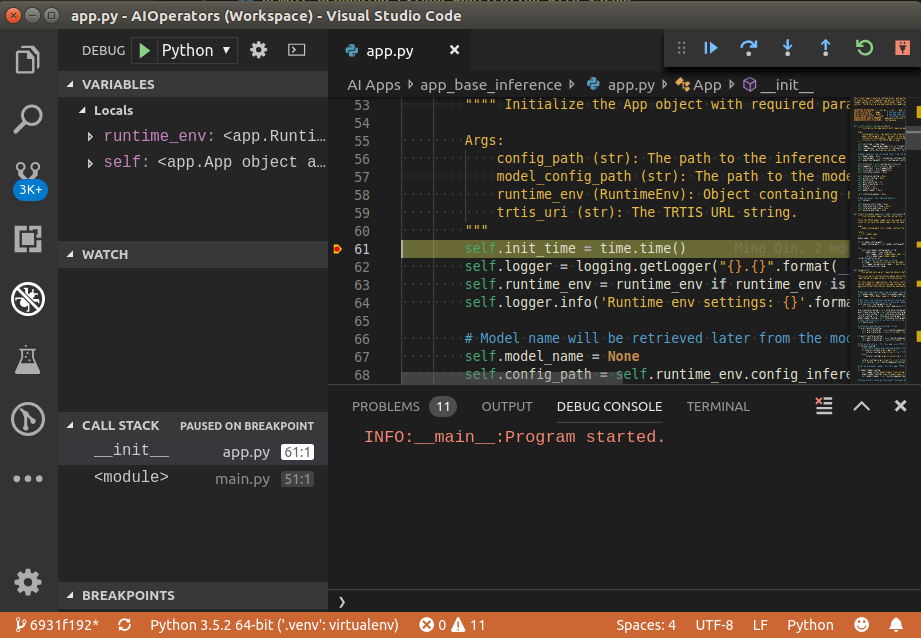
Executing ./debug_app_docker.sh would launch a VSCode window that app.py file is open. Breakpoints can be toggled by clicking on the editor margin or using F9 on the current line (see https://code.visualstudio.com/docs/editor/debugging#_breakpoints).

Since launch.json file (in .vscode subfolder) is already configured, you can start your debug session with F5. Please see Debug actions for more information.
Pressing Ctrl + C in the terminal or closing the VSCode window would terminate the app and dependent Docker containers/network.