GenAI-Perf Compare Subcommand#
There are two approaches for the users to use the compare subcommand to create
plots across multiple runs. First is to directly pass the profile export files
with --files option
Running initially with --files option#
If the user does not have a YAML configuration file,
they can run the compare subcommand with the --files option to generate a
set of default plots as well as a pre-filled YAML config file for the plots.
genai-perf compare --files profile1.json profile2.json profile3.json
This will generate the default plots and compare across the three runs.
GenAI-Perf will also generate an initial YAML configuration file config.yaml
that is pre-filled with plot configurations as following:
plot1:
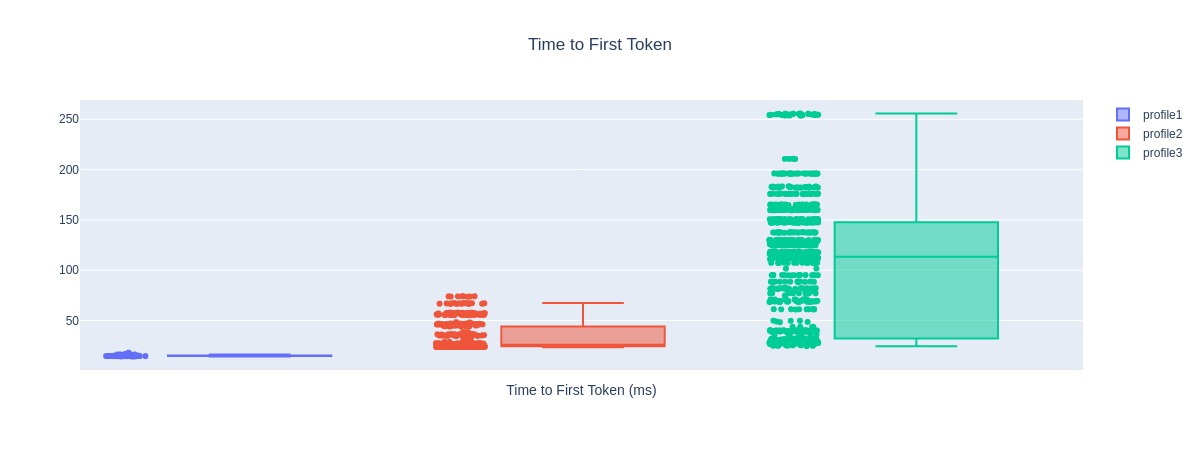
  title: Time to First Token
  x_metric: ''
  y_metric: time_to_first_tokens
  x_label: Time to First Token (ms)
  y_label: ''
  width: 1200
  height: 700
  type: box
  paths:
  - profile1.json
  - profile2.json
  - profile3.json
  output: compare
plot2:
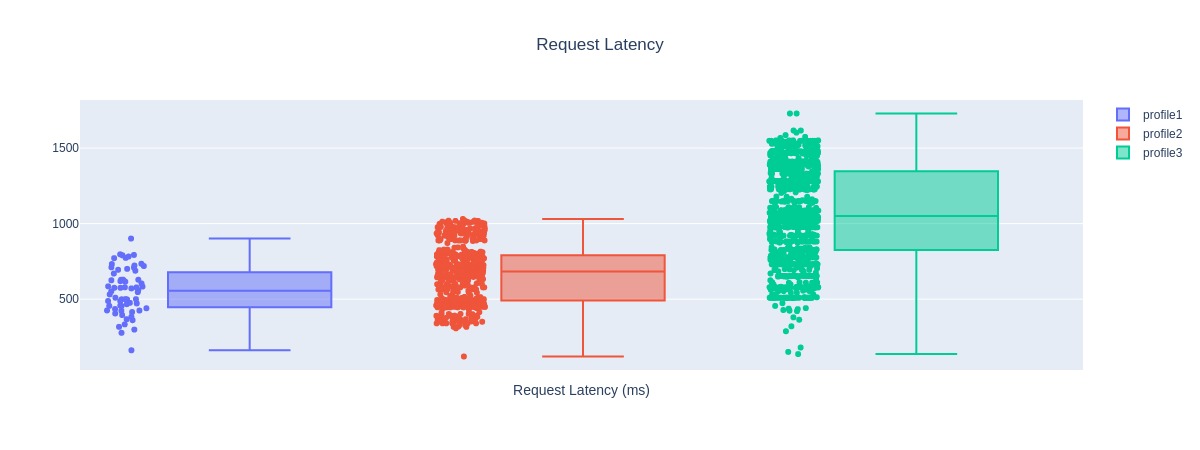
  title: Request Latency
  x_metric: ''
  y_metric: request_latencies
  x_label: Request Latency (ms)
  y_label: ''
  width: 1200
  height: 700
  type: box
  paths:
  - profile1.json
  - profile2.json
  - profile3.json
  output: compare
plot3:
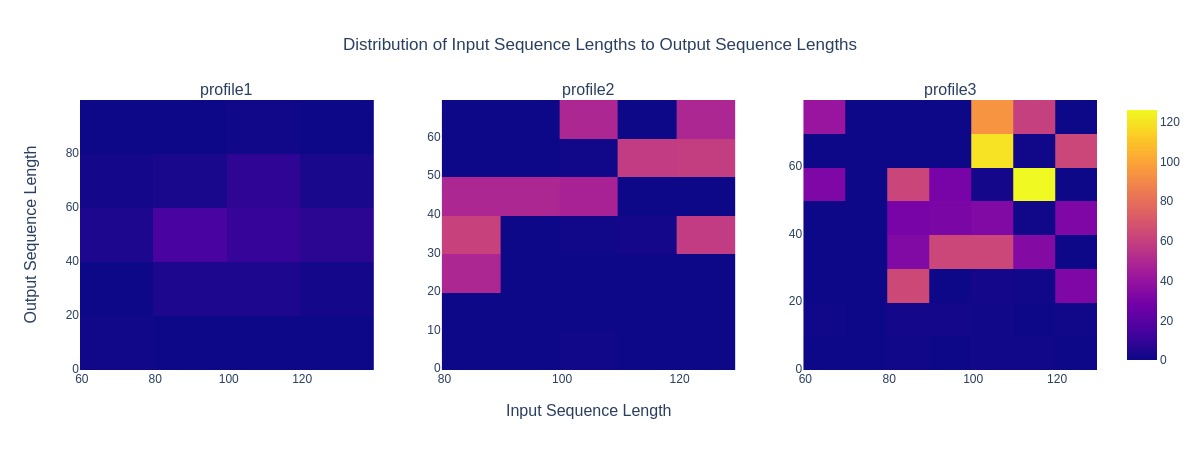
  title: Distribution of Input Sequence Lengths to Output Sequence Lengths
  x_metric: input_sequence_lengths
  y_metric: output_sequence_lengths
  x_label: Input Sequence Length
  y_label: Output Sequence Length
  width: 1200
  height: 450
  type: heatmap
  paths:
  - profile1.json
  - profile2.json
  - profile3.json
  output: compare
plot4:
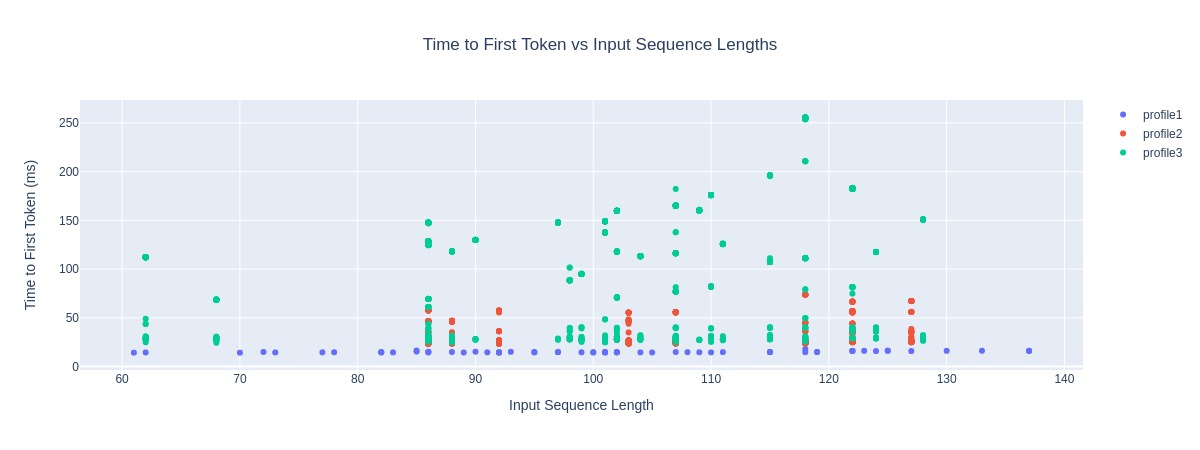
  title: Time to First Token vs Input Sequence Lengths
  x_metric: input_sequence_lengths
  y_metric: time_to_first_tokens
  x_label: Input Sequence Length
  y_label: Time to First Token (ms)
  width: 1200
  height: 700
  type: scatter
  paths:
  - profile1.json
  - profile2.json
  - profile3.json
  output: compare
plot5:
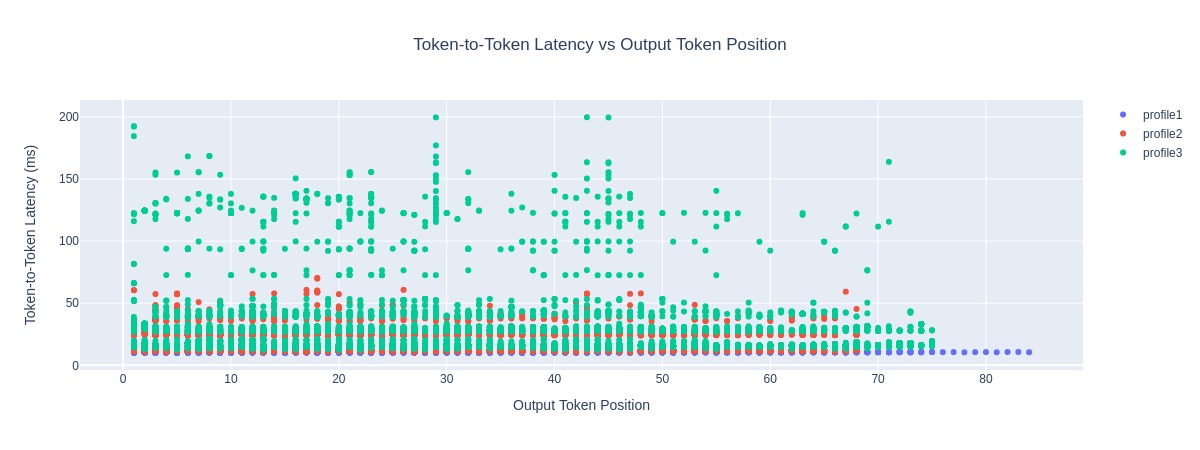
  title: Token-to-Token Latency vs Output Token Position
  x_metric: token_positions
  y_metric: inter_token_latencies
  x_label: Output Token Position
  y_label: Token-to-Token Latency (ms)
  width: 1200
  height: 700
  type: scatter
  paths:
  - profile1.json
  - profile2.json
  - profile3.json
  output: compare
Once the user has the YAML configuration file,
they can repeat the process of editing the config file and running with
--config option to re-generate the plots iteratively.
# edit
vi config.yaml

# re-generate the plots
genai-perf compare --config config.yaml
Running directly with --config option#
If the user would like to create a custom plot (other than the default ones provided), they can build their own YAML configuration file that contains the information about the plots they would like to generate. For instance, if the user would like to see how the inter token latencies change by the number of output tokens, which is not part of the default plots, they could add the following YAML block to the file:
plot1:
  title: Inter Token Latency vs Output Tokens
  x_metric: num_output_tokens
  y_metric: inter_token_latencies
  x_label: Num Output Tokens
  y_label: Avg ITL (ms)
  width: 1200
  height: 450
  type: scatter
  paths:
    - <path-to-profile-export-file>
    - <path-to-profile-export-file>
  output: compare
After adding the lines, the user can run the following command to generate the
plots specified in the configuration file (in this case, config.yaml):
genai-perf compare --config config.yaml
The user can check the generated plots under the output directory:
compare/
├── inter_token_latency_vs_output_tokens.jpeg
└── ...
YAML Schema#
Here are more details about the YAML configuration file and its stricture. The general YAML schema for the plot configuration looks as following:
plot1:
  title: [str]
  x_metric: [str]
  y_metric: [str]
  x_label: [str]
  y_label: [str]
  width: [int]
  height: [int]
  type: [scatter,box,heatmap]
  paths:
    - [str]
    - ...
  output: [str]

plot2:
  title: [str]
  x_metric: [str]
  y_metric: [str]
  x_label: [str]
  y_label: [str]
  width: [int]
  height: [int]
  type: [scatter,box,heatmap]
  paths:
    - [str]
    - ...
  output: [str]

# add more plots
The user can add as many plots they would like to generate by adding the plot
blocks in the configuration file (they have a key pattern of plot<#>,
but that is not required and the user can set it to any arbitrary string).
For each plot block, the user can specify the following configurations:
title: The title of the plot.x_metric: The name of the metric to be used on the x-axis.y_metric: The name of the metric to be used on the y-axis.x_label: The x-axis label (or description)y_label: The y-axis label (or description)width: The width of the entire plotheight: The height of the entire plottype: The type of the plot. It must be one of the three:scatter,box, orheatmap.paths: List of paths to the profile export files to compare.output: The path to the output directory to store all the plots and YAML configuration file.
[!Note] User MUST provide at least one valid path to the profile export file.
Example Plots#
Here are the list of sample plots that gets created by default from running the
compare subcommand:
Distribution of Input Sequence Lengths to Output Sequence Lengths#
Request Latency Analysis#
Time to First Token Analysis#
Time to First Token vs. Input Sequence Lengths#
Token-to-Token Latency vs. Output Token Position#
