Video Pipeline Latency Tool
The Holoscan Developer Kits excel as a high-performance computing platform by combining high-bandwidth video I/O components and the compute capabilities of an NVIDIA GPU to meet the needs of the most demanding video processing and inference applications.
For many video processing applications located at the edge–especially those designed to augment medical instruments and aid live medical procedures–minimizing the latency added between image capture and display, often referred to as the end-to-end latency, is of the utmost importance.
While it is generally easy to measure the individual processing time of an isolated compute or inference algorithm by simply measuring the time that it takes for a single frame (or a sequence of frames) to be processed, it is not always so easy to measure the complete end-to-end latency when the video capture and display is incorporated as this usually involves external capture hardware (e.g. cameras and other sensors) and displays.
In order to establish a baseline measurement of the minimal end-to-end latency that can be achieved with the Holoscan Developer Kits and various video I/O hardware and software components, the Holoscan SDK includes a sample latency measurement tool.
Hardware
The latency measurement tool requires the use of a Holoscan Developer Kit in dGPU mode, and operates by having an output component generate a sequence of known video frames that are then transferred back to an input component using a physical loopback cable.
Testing the latency of any of the HDMI modes that output from the GPU requires a DisplayPort to HDMI adapter or cable (see Example Configurations, below). Note that this cable must support the mode that is being tested — for example, the UHD mode will only be available if the cable is advertised to support “4K Ultra HD (3840 x 2160) at 60 Hz”.
Testing the latency of an optional AJA Video Systems device requires a supported AJA SDI or HDMI capture device (see AJA Video Systems for the list of supported devices), along with the HDMI or SDI cable that is required for the configuration that is being tested (see Example Configurations, below).
Software
The following additional software components are required and are installed either by the Holoscan SDK installation or in the Installation steps below:
CUDA 11.1 or newer (https://developer.nvidia.com/cuda-toolkit)
CMake 3.10 or newer (https://cmake.org/)
GLFW 3.2 or newer (https://www.glfw.org/)
GStreamer 1.14 or newer (https://gstreamer.freedesktop.org/)
GTK 3.22 or newer (https://www.gtk.org/)
pkg-config 0.29 or newer (https://www.freedesktop.org/wiki/Software/pkg-config/)
The following is optional to enable DeepStream support (for RDMA support from the GStreamer Producer):
DeepStream 5.1 or newer (https://developer.nvidia.com/deepstream-sdk)
The following is optional to enable AJA Video Systems support:
AJA NTV2 SDK 16.1 or newer (See AJA Video Systems for details on installing the AJA NTV2 SDK and drivers).
Downloading the Source
The Video Pipeline Latency Tool can be found in the loopback-latency
folder of the Holoscan Performance Tools GitHub repository, which is
cloned with the following:
$ git clone https://github.com/nvidia-holoscan/holoscan-perf-tools.git
Installing Software Requirements
CUDA is installed automatically during the dGPU setup. The rest of the software requirements are installed with the following:
            $ sudo apt-get update && sudo apt-get install -y \
    cmake \
    libglfw3-dev \
    libgstreamer1.0-dev \
    libgstreamer-plugins-base1.0-dev \
    libgtk-3-dev \
    pkg-config
Building
Start by creating a build folder within the loopback-latency
directory:
            $ cd clara-holoscan-perf-tools/loopback-latency
$ mkdir build
$ cd build
CMake is then used to build the tool and output the loopback-latency
binary to the current directory:
            $ cmake ..
$ make -j
If the error No CMAKE_CUDA_COMPILER could be found is
encountered, make sure that the nvcc executable can be found by
adding the CUDA runtime location to your PATH variable:
$ export PATH=$PATH:/usr/local/cuda/bin
Enabling DeepStream Support
DeepStream support enables RDMA when using the GStreamer Producer. To enable DeepStream support, the DEEPSTREAM_SDK path
must be appended to the cmake command with the location of the
DeepStream SDK. For example, when building against DeepStream 5.1, replace the
cmake command above with the following:
$ cmake -DDEEPSTREAM_SDK=/opt/nvidia/deepstream/deepstream-5.1 ..
Enabling AJA Support
To enable AJA support, the NTV2_SDK path must be appended to the
cmake command with the location of the NTV2 SDK in which both the
headers and compiled libraries (i.e. libajantv2) exist. For example, if
the NTV2 SDK is in /home/nvidia/ntv2, replace the cmake command
above with the following:
$ cmake -DNTV2_SDK=/home/nvidia/ntv2 ..
When testing a configuration that outputs from the GPU, the tool
currently only supports a display-less environment in which the loopback
cable is the only cable attached to the GPU. Because of this, any tests that
output from the GPU must be performed using a remote connection such as SSH
from another machine. When this is the case, make sure that the
DISPLAY environment variable is set to the ID of the X11 display you
are using (e.g. in ~/.bashrc):
export DISPLAY=:0
It is also required that the system is logged into the desktop and that the system does not sleep or lock when the latency tool is being used. This can be done by temporarily attaching a display to the system to do the following:
Open the Ubuntu System Settings
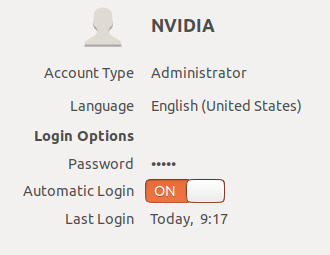
Open User Accounts, click Unlock at the top right, and enable Automatic Login:
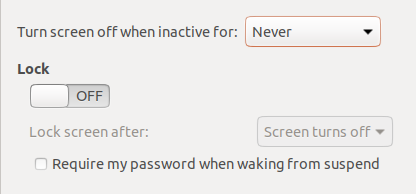
Return to All Settings (top left), open Brightness & Lock, and disable sleep and lock as pictured:
Make sure that the display is detached again after making these changes.
See the Producers section for more details about GPU-based producers (i.e. OpenGL and GStreamer).
GPU To Onboard HDMI Capture Card
In this configuration, a DisplayPort to HDMI cable is connected from the GPU to the onboard HDMI capture card. This configuration supports the OpenGL and GStreamer producers, and the V4L2 and GStreamer consumers.
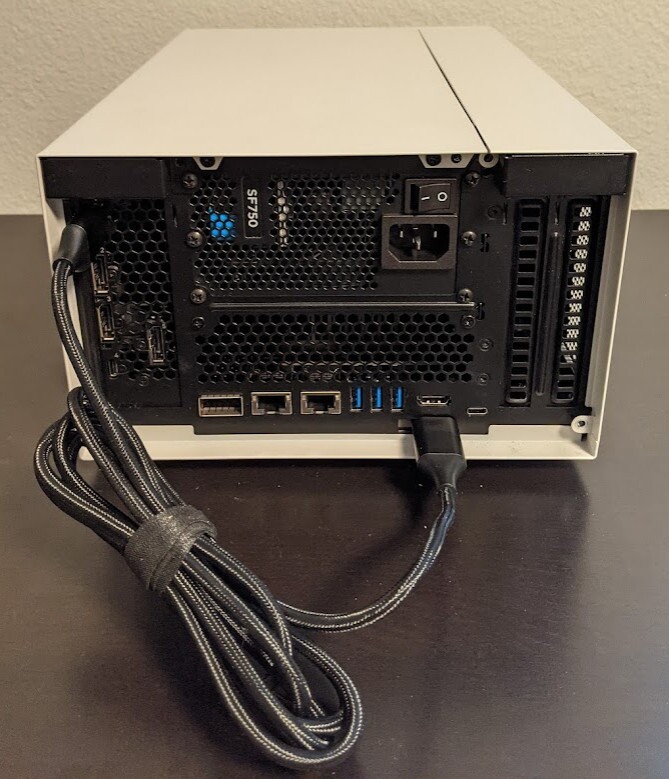
Fig. 24 DP-to-HDMI Cable Between GPU and Onboard HDMI Capture Card
For example, an OpenGL producer to V4L2 consumer can be measured using this configuration and the following command:
$ ./loopback-latency -p gl -c v4l2
GPU to AJA HDMI Capture Card
In this configuration, a DisplayPort to HDMI cable is connected from the GPU to an HDMI input channel on an AJA capture card. This configuration supports the OpenGL and GStreamer producers, and the AJA consumer using an AJA HDMI capture card.
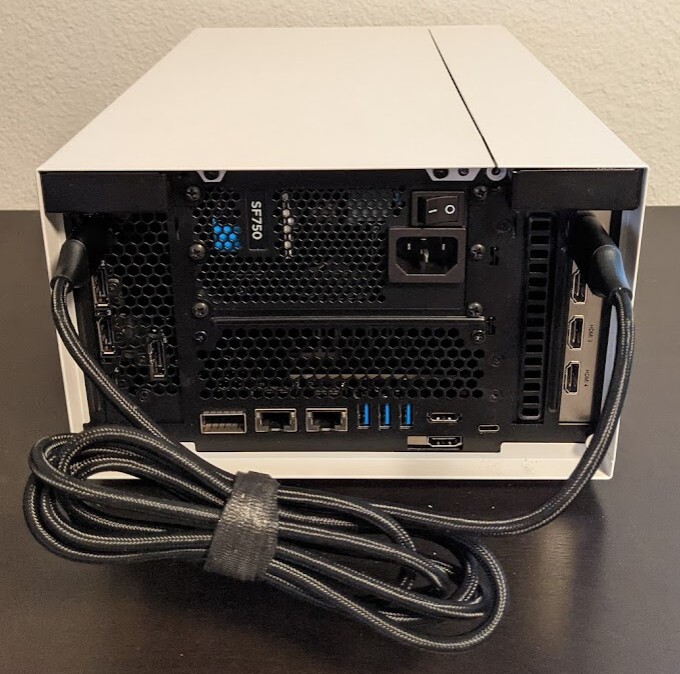
Fig. 25 DP-to-HDMI Cable Between GPU and AJA KONA HDMI Capture Card (Channel 1)
For example, an OpenGL producer to AJA consumer can be measured using this configuration and the following command:
$ ./loopback-latency -p gl -c aja -c.device 0 -c.channel 1
AJA SDI to AJA SDI
In this configuration, an SDI cable is attached between either two channels on the same device or between two separate devices (pictured is a loopback between two channels of a single device). This configuration must use the AJA producer and AJA consumer.
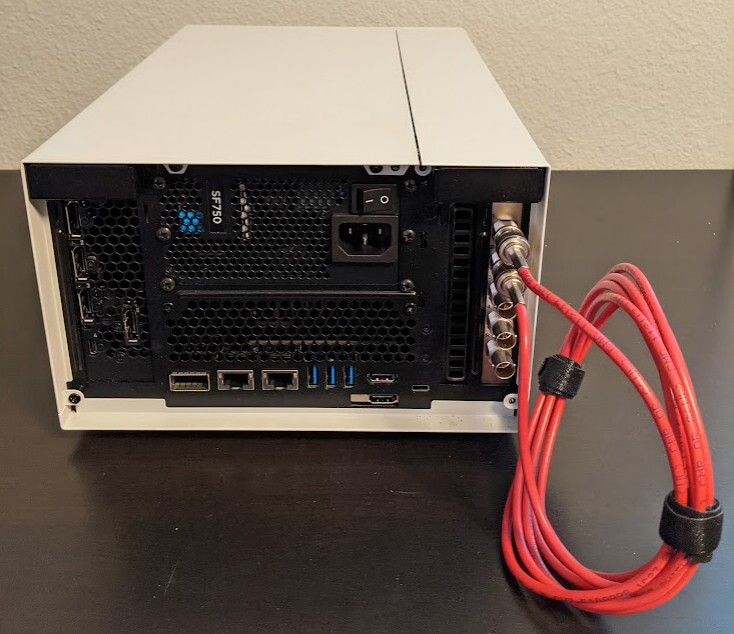
Fig. 26 SDI Cable Between Channel 1 and 2 of a Single AJA Corvid 44 Capture Card
For example, the following can be used to measure the pictured configuration
using a single device with a loopback between channels 1 and 2. Note that
the tool defaults to use channel 1 for the producer and channel 2 for the
consumer, so the channel parameters can be omitted.
$ ./loopback-latency -p aja -c aja
If instead there are two AJA devices being connected, the following can be used to measure a configuration in which they are both connected to channel 1:
$ ./loopback-latency -p aja -p.device 0 -p.channel 1 -c aja -c.device 1 -c.channel 1
The latency measurement tool operates by having a producer component generate a sequence of known video frames that are output and then transferred back to an input consumer component using a physical loopback cable. Timestamps are compared throughout the life of the frame to measure the overall latency that the frame sees during this process, and these results are summarized when all of the frames have been received and the measurement completes. See Producers, Consumers, and Example Configurations for more details.
Frame Measurements
Each frame that is generated by the tool goes through the following steps in order, each of which has its time measured and then reported when all frames complete.
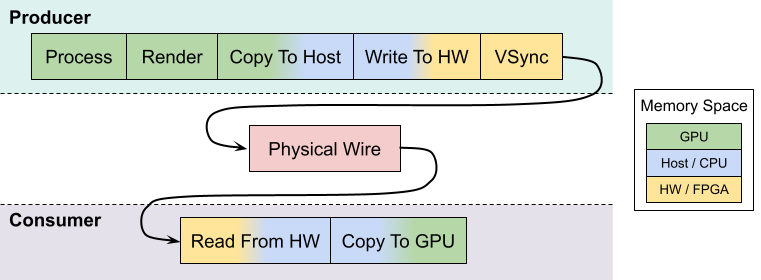
Fig. 27 Latency Tool Frame Lifespan (RDMA Disabled)
CUDA Processing
In order to simulate a real-world GPU workload, the tool first runs a CUDA kernel for a user-specified amount of loops (defaults to zero). This step is described below in Simulating GPU Workload.
Render on GPU
After optionally simulating a GPU workload, every producer then generates its frames using the GPU, either by a common CUDA kernel or by another method that is available to the producer’s API (such as the OpenGL producer).
This step is expected to be very fast (<100us), but higher times may be seen if overall system load is high.
Copy To Host
Once the frame has been generated on the GPU, it may be necessary to copy the frame to host memory in order for the frame to be output by the producer component (for example, an AJA producer with RDMA disabled).
If a host copy is not required (i.e. RDMA is enabled for the producer), this time should be zero.
Write to HW
Some producer components require frames to be copied to peripheral memory before they can be output (for example, an AJA producer requires frames to be copied to the external frame stores on the AJA device). This copy may originate from host memory if RDMA is disabled for the producer, or from GPU memory if RDMA is enabled.
If this copy is not required, e.g. the producer outputs directly from the GPU, this time should be zero.
VSync Wait
Once the frame is ready to be output, the producer hardware must wait for the next VSync interval before the frame can be output.
The sum of this VSync wait and all of the preceding steps is expected to be near a multiple of the frame interval. For example, if the frame rate is 60Hz then the sum of the times for steps 1 through 5 should be near a multiple of 16666us.
Wire Time
The wire time is the amount of time that it takes for the frame to transfer across the physical loopback cable. This should be near the time for a single frame interval.
Read From HW
Once the frame has been transferred across the wire and is available to the consumer, some consumer components require frames to be copied from peripheral memory into host (RDMA disabled) or GPU (RDMA enable) memory. For example, an AJA consumer requires frames to be copied from the external frame store of the AJA device.
If this copy is not required, e.g. the consumer component writes received frames directly to host/GPU memory, this time should be zero.
Copy to GPU
If the consumer received the frame into host memory, the final step required for processing the frame with the GPU is to copy the frame into GPU memory.
If RDMA is enabled for the consumer and the frame was previously written directly to GPU memory, this time should be zero.
Note that if RDMA is enabled on the producer and consumer sides then the GPU/host copy steps above, 3 and 8 respectively, are effectively removed since RDMA will copy directly between the video HW and the GPU. The following shows the same diagram as above but with RDMA enabled for both the producer and consumer.
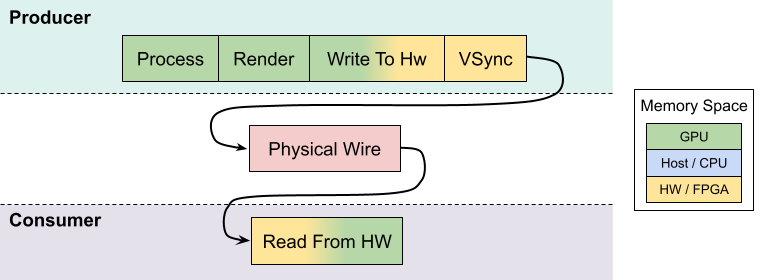
Fig. 28 Latency Tool Frame Lifespan (RDMA Enabled)
Interpreting The Results
The following shows example output of the above measurements from the tool when testing a 4K stream at 60Hz from an AJA producer to an AJA consumer, both with RDMA disabled, and no GPU/CUDA workload simulation. Note that all time values are given in microseconds.
$ ./loopback-latency -p aja -p.rdma 0 -c aja -c.rdma 0 -f 4k
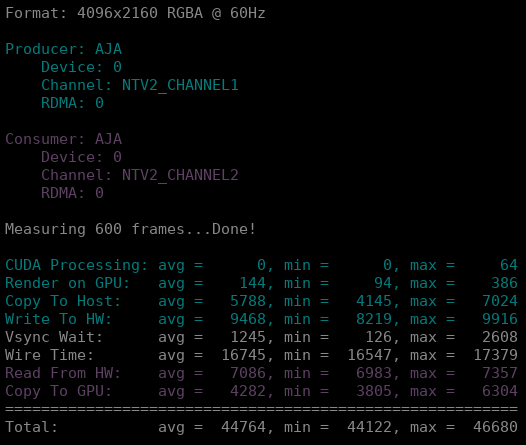
While this tool measures the producer times followed by the consumer times, the expectation for real-world video processing applications is that this order would be reversed. That is to say, the expectation for a real-world application is that it would capture, process, and output frames in the following order (with the component responsible for measuring that time within this tool given in parentheses):
Read from HW (consumer)
Copy to GPU (consumer)
Process Frame (producer)
Render Results to GPU (producer)
Copy to Host (producer)
Write to HW (producer)

Fig. 29 Real Application Frame Lifespan
To illustrate this, the tool sums and displays the total producer and consumer times, then provides the Estimated Application Times as the total sum of all of these steps (i.e. steps 1 through 6, above).
(continued from above)
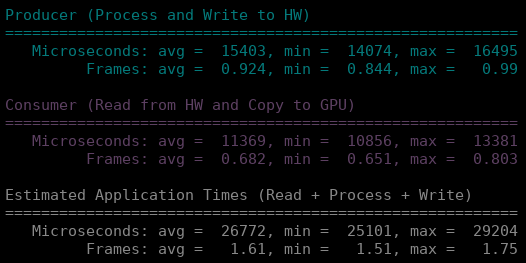
Once a real-world application captures, processes, and outputs a frame, it would still be required that this final output waits for the next VSync interval before it is actually sent across the physical wire to the display hardware. Using this assumption, the tool then estimates one final value for the Final Estimated Latencies by doing the following:
Take the Estimated Application Time (from above)
Round it up to the next VSync interval
Add the physical wire time (i.e. a frame interval)

Fig. 30 Final Estimated Latency with VSync and Physical Wire Time
Continuing this example using a frame interval of 16666us (60Hz), this means that the average Final Estimated Latency is determined by:
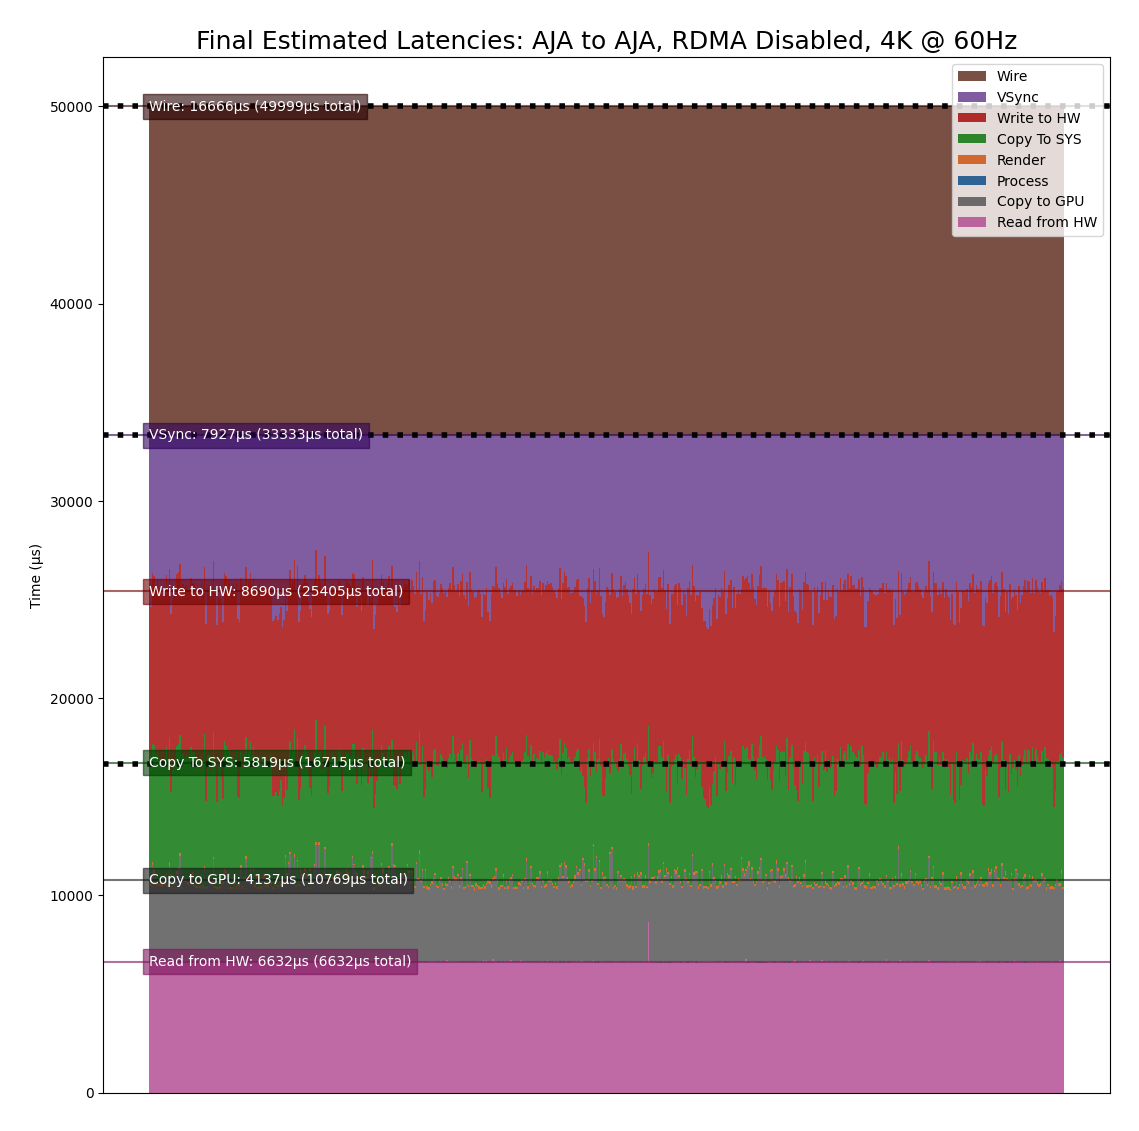
Average application time = 26772
Round up to next VSync interval = 33332
Add physical wire time (+16666) = 49998
These times are also reported as a multiple of frame intervals.
(continued from above)

Using this example, we should then expect that the total end-to-end latency that is seen by running this pipeline using these components and configuration is 3 frame intervals (49998us).
Reducing Latency With RMDA
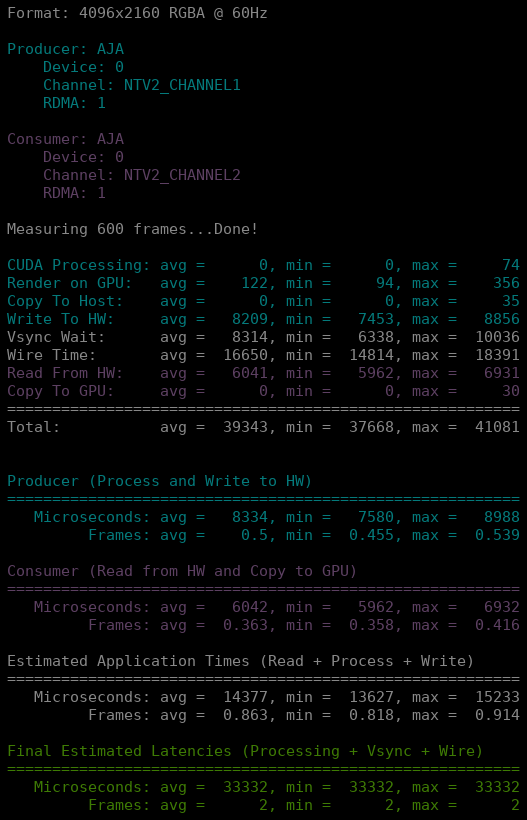
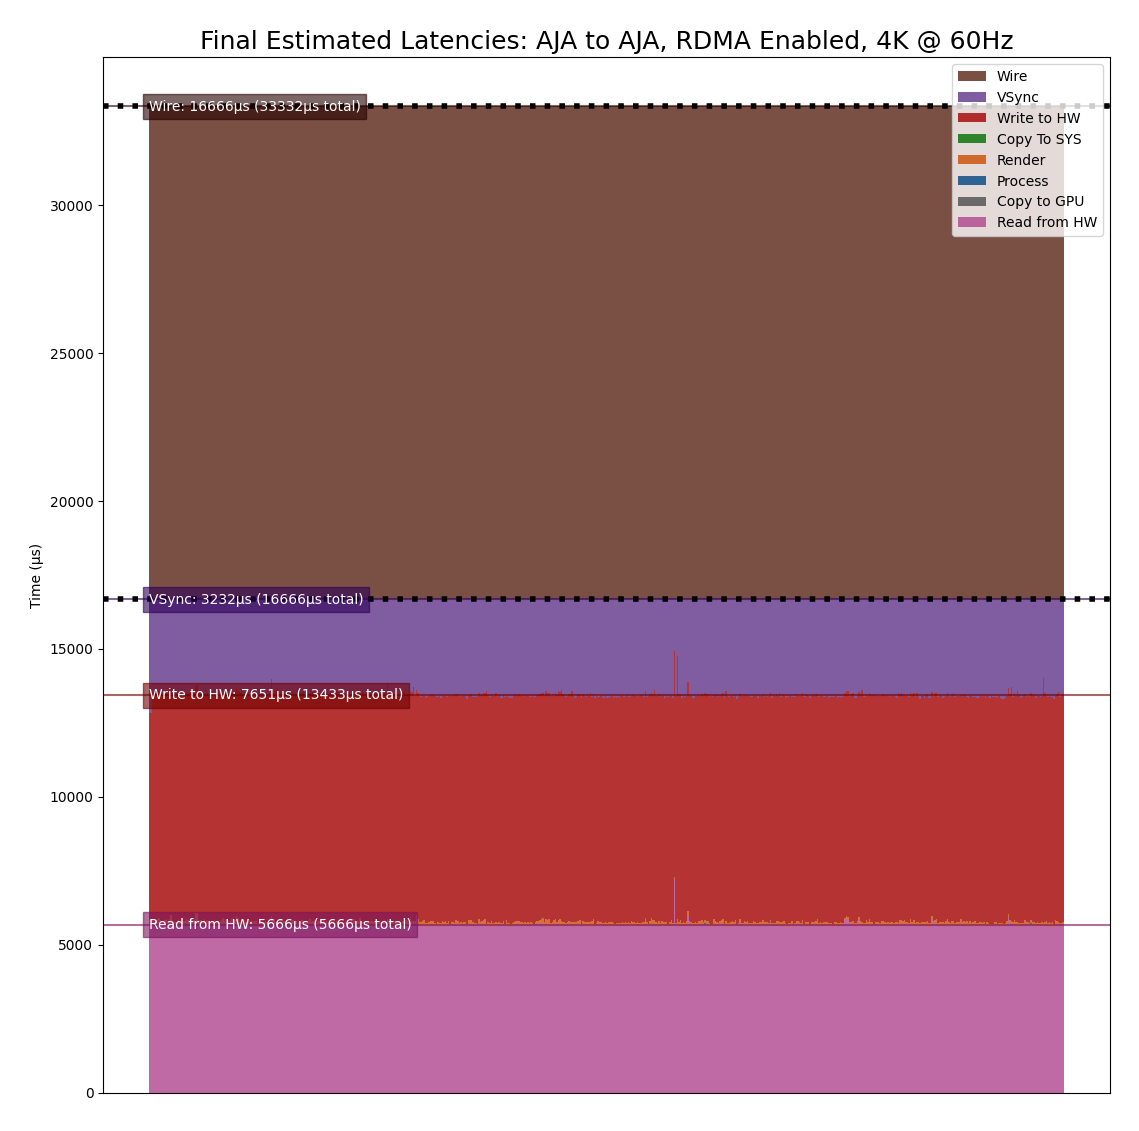
The previous example uses an AJA producer and consumer for a 4K @ 60Hz stream, however RDMA was disabled for both components. Because of this, the additional copies between the GPU and host memory added more than 10000us of latency to the pipeline, causing the application to exceed one frame interval of processing time per frame and therefore a total frame latency of 3 frames. If RDMA is enabled, these GPU and host copies can be avoided so the processing latency is reduced by more than 10000us. More importantly, however, this also allows the total processing time to fit within a single frame interval so that the total end-to-end latency can be reduced to just 2 frames.

Fig. 31 Reducing Latency With RDMA
The following shows the above example repeated with RDMA enabled.
$ ./loopback-latency -p aja -p.rdma 1 -c aja -c.rdma 1 -f 4k
Simulating GPU Workload
By default the tool measures what is essentially a pass-through video pipeline; that is, no processing of the video frames is performed by the system. While this is useful for measuring the minimum latency that can be achieved by the video input and output components, it’s not very indicative of a real-world use case in which the GPU is used for compute-intensive processing operations on the video frames between the input and output — for example, an object detection algorithm that applies an overlay to the output frames.
While it may be relatively simple to measure the runtime latency of the processing algorithms that are to be applied to the video frames — by simply measuring the runtime of running the algorithm on a single or stream of frames — this may not be indicative of the effects that such processing might have on the overall system load, which may further increase the latency of the video input and output components.
In order to estimate the total latency when an additional GPU workload is added
to the system, the latency tool has an -s {count} option that can be
used to run an arbitrary CUDA loop the specified number of times before the
producer actually generates a frame. The expected usage for this option is as
follows:
The per-frame runtime of the actual GPU processing algorithm is measured outside of the latency measurement tool.
The latency tool is repeatedly run with just the
-s {count}option, adjusting the{count}parameter until the time that it takes to run the simulated loop approximately matches the actual processing time that was measured in the previous step.$ ./loopback-latency -s 2000
The latency tool is run with the full producer (
-p) and consumer (-c) options used for the video I/O, along with the-s {count}option using the loop count that was determined in the previous step.NoteThe following example shows that approximately half of the frames received by the consumer were duplicate/repeated frames. This is due to the fact that the additional processing latency of the producer causes it to exceed a single frame interval, and so the producer is only able to output a new frame every second frame interval.
$ ./loopback-latency -p aja -c aja -s 2000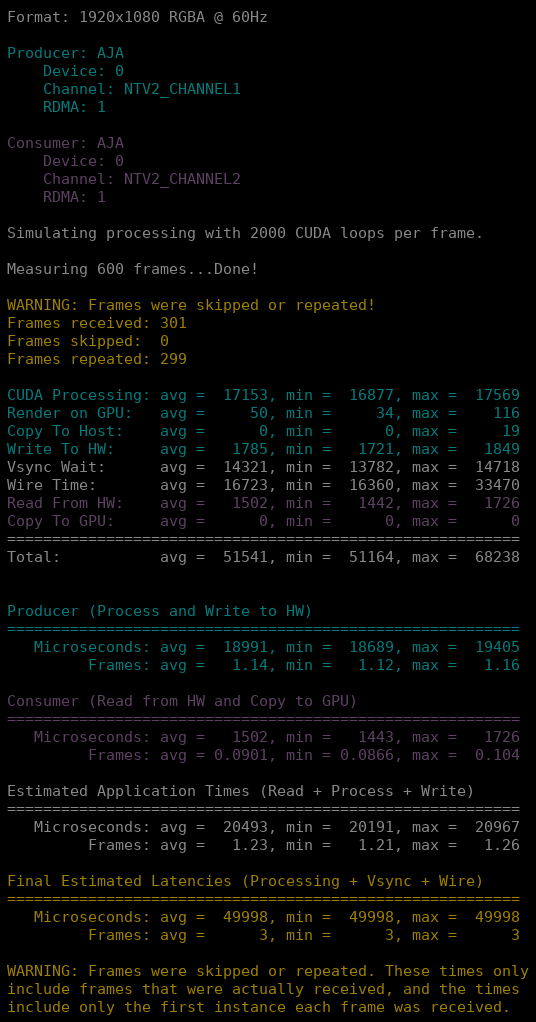
To get the most accurate estimation of the latency that would be seen
by a real world application, the best thing to do would be to run the actual
frame processing algorithm used by the application during the latency
measurement. This could be done by modifying the SimulateProcessing
function in the latency tool source code.
The latency tool includes a -o {file} option that can be used to output
a CSV file with all of the measured times for every frame. This file can then be
used with the graph_results.py script that is included with the tool in
order to generate a graph of the measurements.
For example, if the latencies are measured using:
$ ./loopback-latency -p aja -c aja -o latencies.csv
The graph can then be generated using the following, which will open a window on the desktop to display the graph:
$ ./graph_results.py --file latencies.csv
The graph can also be output to a PNG image file instead of opening a window on
the desktop by providing the --png {file} option to the script. The
following shows an example graph for an AJA to AJA measurement of a 4K @ 60Hz
stream with RDMA disabled (as shown as an example in Interpreting The
Results, above).
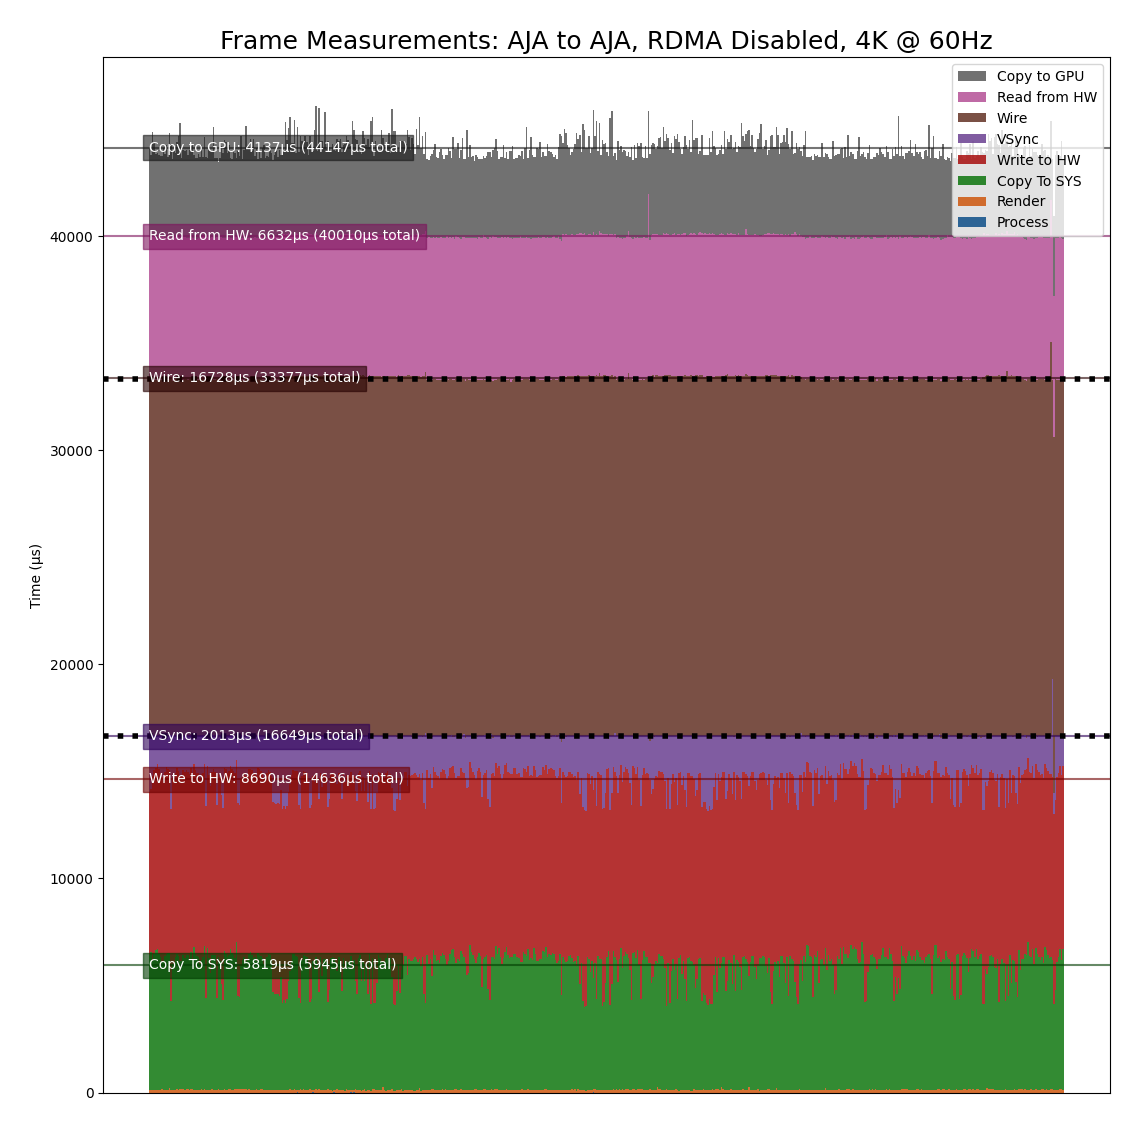
Note that this is showing the times for 600 frames, from left to right, with the life of each frame beginning at the bottom and ending at the top. The dotted black lines represent frame VSync intervals (every 16666us).
The above example graphs the times directly as measured by the tool. To instead
generate a graph for the Final Estimated Latencies as described above in
Interpreting The Results, the --estimate flag can be provided to the
script. As is done by the latency tool when it reports the estimated latencies,
this reorders the producer and consumer steps then adds a VSync interval
followed by the physical wire latency.
The following graphs the Final Estimated Latencies using the same data file as the graph above. Note that this shows a total of 3 frames of expected latency.
For the sake of comparison, the following graph shows the same test but with RDMA enabled. Note that the Copy To GPU and Copy To SYS times are now zero due to the use of RDMA, and this now shows just 2 frames of expected latency.
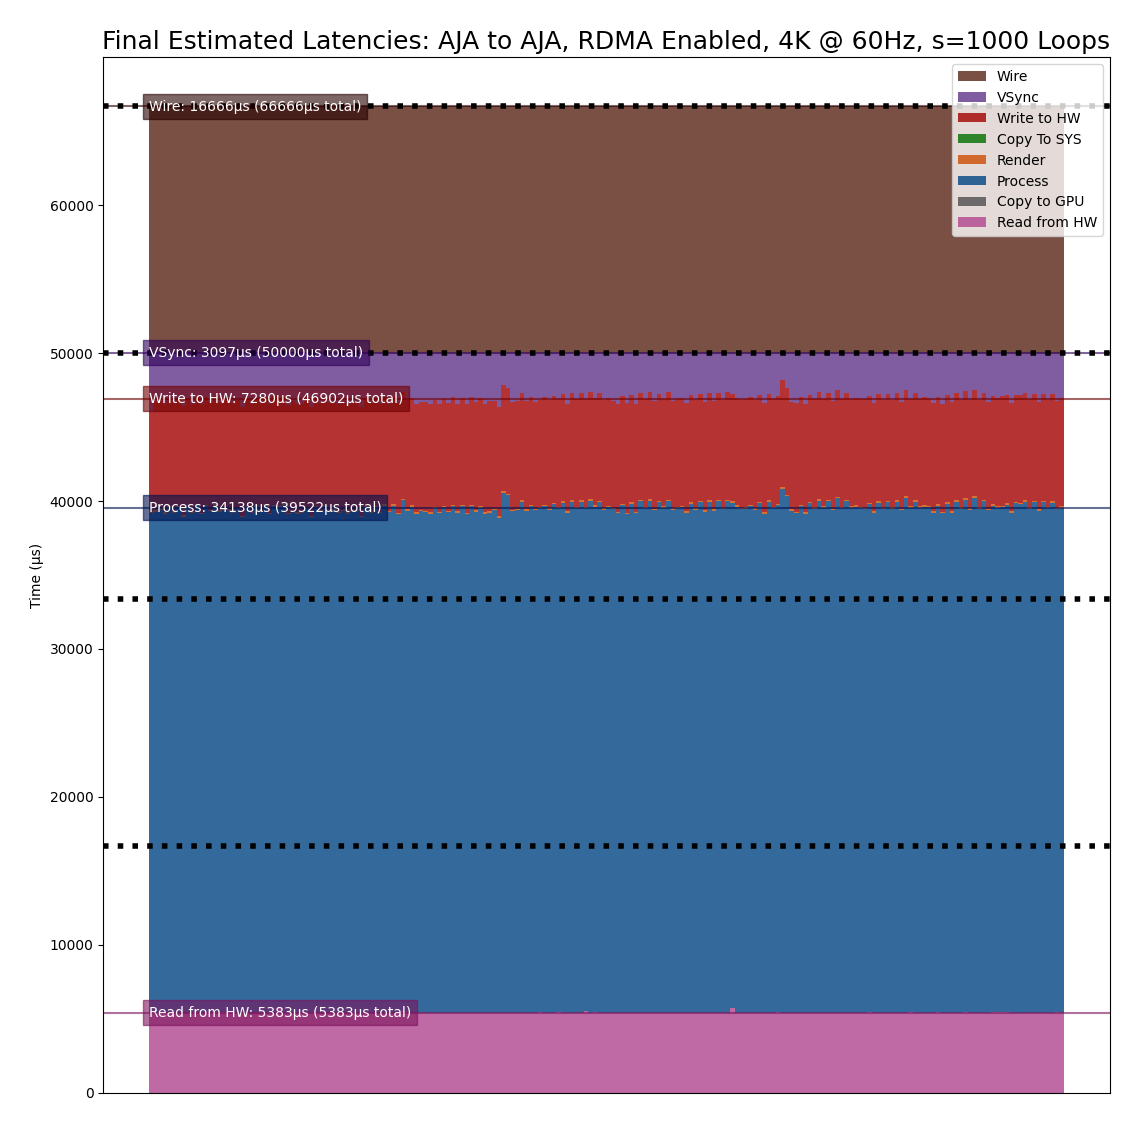
As a final example, the following graph duplicates the above test with RDMA
enabled, but adds roughly 34ms of additional GPU processing time
(-s 1000) to the pipeline to produce a final estimated latency of 4
frames.
There are currently 3 producer types supported by the Holoscan latency tool. See the following sections for a description of each supported producer.
OpenGL GPU Direct Rendering (HDMI)
This producer (gl) uses OpenGL to render frames directly on the GPU for
output via the HDMI connectors on the GPU. This is currently expected to be the
lowest latency path for GPU video output.
OpenGL Producer Notes:
The video generated by this producer is rendered full-screen to the primary display. As of this version, this component has only been tested in a display-less environment in which the loop-back HDMI cable is the only cable attached to the GPU (and thus is the primary display). It may also be required to use the
xrandrtool to configure the HDMI output — the tool will provide thexrandrcommands needed if this is the case.Since OpenGL renders directly to the GPU, the
p.rdmaflag is not supported and RDMA is always considered to be enabled for this producer.
GStreamer GPU Rendering (HDMI)
This producer (gst) uses the nveglglessink GStreamer component
that is included with Holopack in order to render frames that originate from
a GStreamer pipeline to the HDMI connectors on the GPU.
GStreamer Producer Notes:
The tool must be built with DeepStream support in order for this producer to support RDMA (see Enabling DeepStream Support for details).
The video generated by this producer is rendered full-screen to the primary display. As of this version, this component has only been tested in a display-less environment in which the loop-back HDMI cable is the only cable attached to the GPU (and thus is the primary display). It may also be required to use the
xrandrtool to configure the HDMI output — the tool will provide thexrandrcommands needed if this is the case.Since the output of the generated frames is handled internally by the
nveglglessinkplugin, the timing of when the frames are output from the GPU are not known. Because of this, the Wire Time that is reported by this producer includes all of the time that the frame spends between being passed to thenveglglessinkand when it is finally received by the consumer.
AJA Video Systems (SDI)
This producer (aja) outputs video frames from an AJA Video Systems
device that supports video playback.
AJA Producer Notes:
The latency tool must be built with AJA Video Systems support in order for this producer to be available (see Building for details).
The following parameters can be used to configure the AJA device and channel that are used to output the frames:
-p.device {index}Integer specifying the device index (i.e. 0 or 1). Defaults to 0.
-p.channel {channel}Integer specifying the channel number, starting at 1 (i.e. 1 specifies NTV2_CHANNEL_1). Defaults to 1.
The
p.rdmaflag can be used to enable (1) or disable (0) the use of RDMA with the producer. If RDMA is to be used, the AJA drivers loaded on the system must also support RDMA.The only AJA device that have currently been verified to work with this producer is the Corvid 44 12G BNC (SDI).
There are currently 3 consumer types supported by the Holoscan latency tool. See the following sections for a description of each supported consumer.
V4L2 (Onboard HDMI Capture Card)
This consumer (v4l2) uses the V4L2 API directly in order to capture
frames using the HDMI capture card that is onboard the Holoscan Developer Kits.
V4L2 Consumer Notes:
The onboard HDMI capture card is locked to a specific frame resolution and and frame rate (1080p @ 60Hz), and so
1080is the only supported format when using this consumer.The
-c.device {device}parameter can be used to specify the path to the device that is being used to capture the frames (defaults to/dev/video0).The V4L2 API does not support RDMA, and so the
c.rdmaoption is ignored.
GStreamer (Onboard HDMI Capture Card)
This consumer (gst) also captures frames from the onboard HDMI capture
card, but uses the v4l2src GStreamer plugin that wraps the V4L2 API to
support capturing frames for using within a GStreamer pipeline.
GStreamer Consumer Notes:
The onboard HDMI capture card is locked to a specific frame resolution and and frame rate (1080p @ 60Hz), and so
1080is the only supported format when using this consumer.The
-c.device {device}parameter can be used to specify the path to the device that is being used to capture the frames (defaults to/dev/video0).The
v4l2srcGStreamer plugin does not support RDMA, and so thec.rdmaoption is ignored.
AJA Video Systems (SDI and HDMI)
This consumer (aja) captures video frames from an AJA Video Systems
device that supports video capture. This can be either an SDI or an HDMI video
capture card.
AJA Consumer Notes:
The latency tool must be built with AJA Video Systems support in order for this producer to be available (see Building for details).
The following parameters can be used to configure the AJA device and channel that are used to capture the frames:
-c.device {index}Integer specifying the device index (i.e. 0 or 1). Defaults to 0.
-c.channel {channel}Integer specifying the channel number, starting at 1 (i.e. 1 specifies NTV2_CHANNEL_1). Defaults to 2.
The
c.rdmaflag can be used to enable (1) or disable (0) the use of RDMA with the consumer. If RDMA is to be used, the AJA drivers loaded on the system must also support RDMA.The only AJA devices that have currently been verified to work with this consumer are the KONA HDMI (for HDMI) and Corvid 44 12G BNC (for SDI).
If any of the loopback-latency commands described above fail with
errors, the following steps may help resolve the issue.
Problem: The following error is output:
ERROR: Failed to get a handle to the display (is the DISPLAY environment variable set?)
Solution: Ensure that the
DISPLAYenvironment variable is set with the ID of the X11 display you are using; e.g. for display ID0:$ export DISPLAY=:0
If the error persists, try changing the display ID; e.g. replacing
0with1:$ export DISPLAY=:1
It might also be convenient to set this variable in your
~/.bashrcfile so that it is set automatically whenever you login.Problem: An error like the following is output:
            ERROR: The requested format (1920x1080 @ 60Hz) does not match
       the current display mode (1024x768 @ 60Hz)
       Please set the display mode with the xrandr tool using
       the following command:

           $ xrandr --output DP-5 --mode 1920x1080 --panning 1920x1080 --rate 60
But using the
xrandrcommand provided produces an error:$ xrandr --output DP-5 --mode 1920x1080 --panning 1920x1080 --rate 60 xrandr: cannot find mode 1920x1080
Solution: Try the following:
Ensure that no other displays are connected to the GPU.
Check the output of an
xrandrcommand to see that the requested format is supported. The following shows an example of what the onboard HDMI capture card should support. Note that each row of the supported modes shows the resolution on the left followed by all of the supported frame rates for that resolution to the right.$ xrandr Screen 0: minimum 8 x 8, current 1920 x 1080, maximum 32767 x 32767 DP-0 disconnected (normal left inverted right x axis y axis) DP-1 disconnected (normal left inverted right x axis y axis) DP-2 disconnected (normal left inverted right x axis y axis) DP-3 disconnected (normal left inverted right x axis y axis) DP-4 disconnected (normal left inverted right x axis y axis) DP-5 connected primary 1920x1080+0+0 (normal left inverted right x axis y axis) 1872mm x 1053mm 1920x1080 60.00*+ 59.94 50.00 29.97 25.00 23.98 1680x1050 59.95 1600x900 60.00 1440x900 59.89 1366x768 59.79 1280x1024 75.02 60.02 1280x800 59.81 1280x720 60.00 59.94 50.00 1152x864 75.00 1024x768 75.03 70.07 60.00 800x600 75.00 72.19 60.32 720x576 50.00 720x480 59.94 640x480 75.00 72.81 59.94 DP-6 disconnected (normal left inverted right x axis y axis) DP-7 disconnected (normal left inverted right x axis y axis) USB-C-0 disconnected (normal left inverted right x axis y axis)
If a UHD or 4K mode is being requested, ensure that the DisplayPort to HDMI cable that is being used supports that mode.
If the
xrandroutput still does not show the mode that is being requested but it should be supported by the cable and capture device, try rebooting the device.
Problem: One of the following errors is output:
ERROR: Select timeout on /dev/video0
ERROR: Failed to get the monitor mode (is the display cable attached?)
ERROR: Could not find frame color (0,0,0) in producer records.
These errors mean that either the capture device is not receiving frames, or the frames are empty (the producer will never output black frames,
(0,0,0)).Solution: Check the output of
xrandrto ensure that the loopback cable is connected and the capture device is recognized as a display. If the following is output, showing no displays attached, this could mean that the loopback cable is either not connected properly or is faulty. Try connecting the cable again and/or replacing the cable.$ xrandr Screen 0: minimum 8 x 8, current 1920 x 1080, maximum 32767 x 32767 DP-0 disconnected (normal left inverted right x axis y axis) DP-1 disconnected (normal left inverted right x axis y axis) DP-2 disconnected (normal left inverted right x axis y axis) DP-3 disconnected (normal left inverted right x axis y axis) DP-4 disconnected (normal left inverted right x axis y axis) DP-5 disconnected primary 1920x1080+0+0 (normal left inverted right x axis y axis) 0mm x 0mm DP-6 disconnected (normal left inverted right x axis y axis) DP-7 disconnected (normal left inverted right x axis y axis)
Problem: An error like the following is output:
ERROR: Could not find frame color (27,28,26) in producer records.
Colors near this particular value
(27,28,26)are displayed on the Ubuntu lock screen, which prevents the latency tool from rendering frames properly. Note that the color value may differ slightly from(27,28,26).Solution:
Follow the steps provided in the note at the top of the Example Configurations section to enable automatic login and disable the Ubuntu lock screen.