Using Nsight Systems with PVA#
NVIDIA Nsight Systems can be used to analyze performance of PVA kernels. It is a visual performance analysis tool that collects performance metrics and helps you analyze your application and identify the potential performance bottlenecks.
Set up#
Install a suitable version of NVIDIA Nsight Systems on the target. Consult DRIVE OS or JetPack documentation for more information. On some platforms, Nsight Systems may come pre-installed on the target’s operating system. For complete documentation on Nsight Systems, refer to https://docs.nvidia.com/nsight-systems/InstallationGuide/index.html
Note
Displaying Soc Metrics (detailed hardware performance counters) may require a limited distribution release of Nsight Systems. Contact NVIDIA for more information.
Enable stats collection on target:
Linux:
echo Y | sudo tee /sys/kernel/debug/pva0/stats_enabled # Y:enable collection, N:disable collection
echo 2 | sudo tee /sys/kernel/debug/pva0/profiling_level # 0:Off, 1:Basic, 2:All (including queues, prepare and post)
QNX:
echo 1 > /dev/nvpvadebugfs/pva0/vpu_stats_enabled
Profile a PVA application on the target using CLI#
Follow the instructions at VPU Application Signing to ensure the successful execution of your PVA application.
Set path environment variables
export PVA_LIBRARY_PATH=<path to cuPVA runtime libraries>
export NSYS_PATH=<path to Nsight Systems installation directory>
export PVA_APP_PATH=<path to target app you would like to profile>
Run the following command to collect the performance metrics. A
report*.nsys-repfile is generated under the working directory. Please make sure that the working directory has write permission.Linux:
sudo -E LD_LIBRARY_PATH=${PVA_LIBRARY_PATH}:${NSYS_PATH}/target-linux-tegra-armv8 ${NSYS_PATH}/target-linux-tegra-armv8/nsys profile --accelerator-trace=tegra-accelerators --soc-metrics=true ${PVA_APP_PATH}/<your_cupva_app>
QNX:
LD_LIBRARY_PATH=${LD_LIBRARY_PATH}:${PVA_LIBRARY_PATH}:${NSYS_PATH}/target-qnx-armv8 ${NSYS_PATH}/target-qnx-armv8/nsys profile --accelerator-trace=tegra-accelerators --soc-metrics=true ${PVA_APP_PATH}/<your_cupva_app>
Copy the report file to your Linux or Windows host system.
Analyze the report#
Launch the GUI
Open the
.nsys-repreport file:File -> Open and navigate to your local directory storing the report file and open it
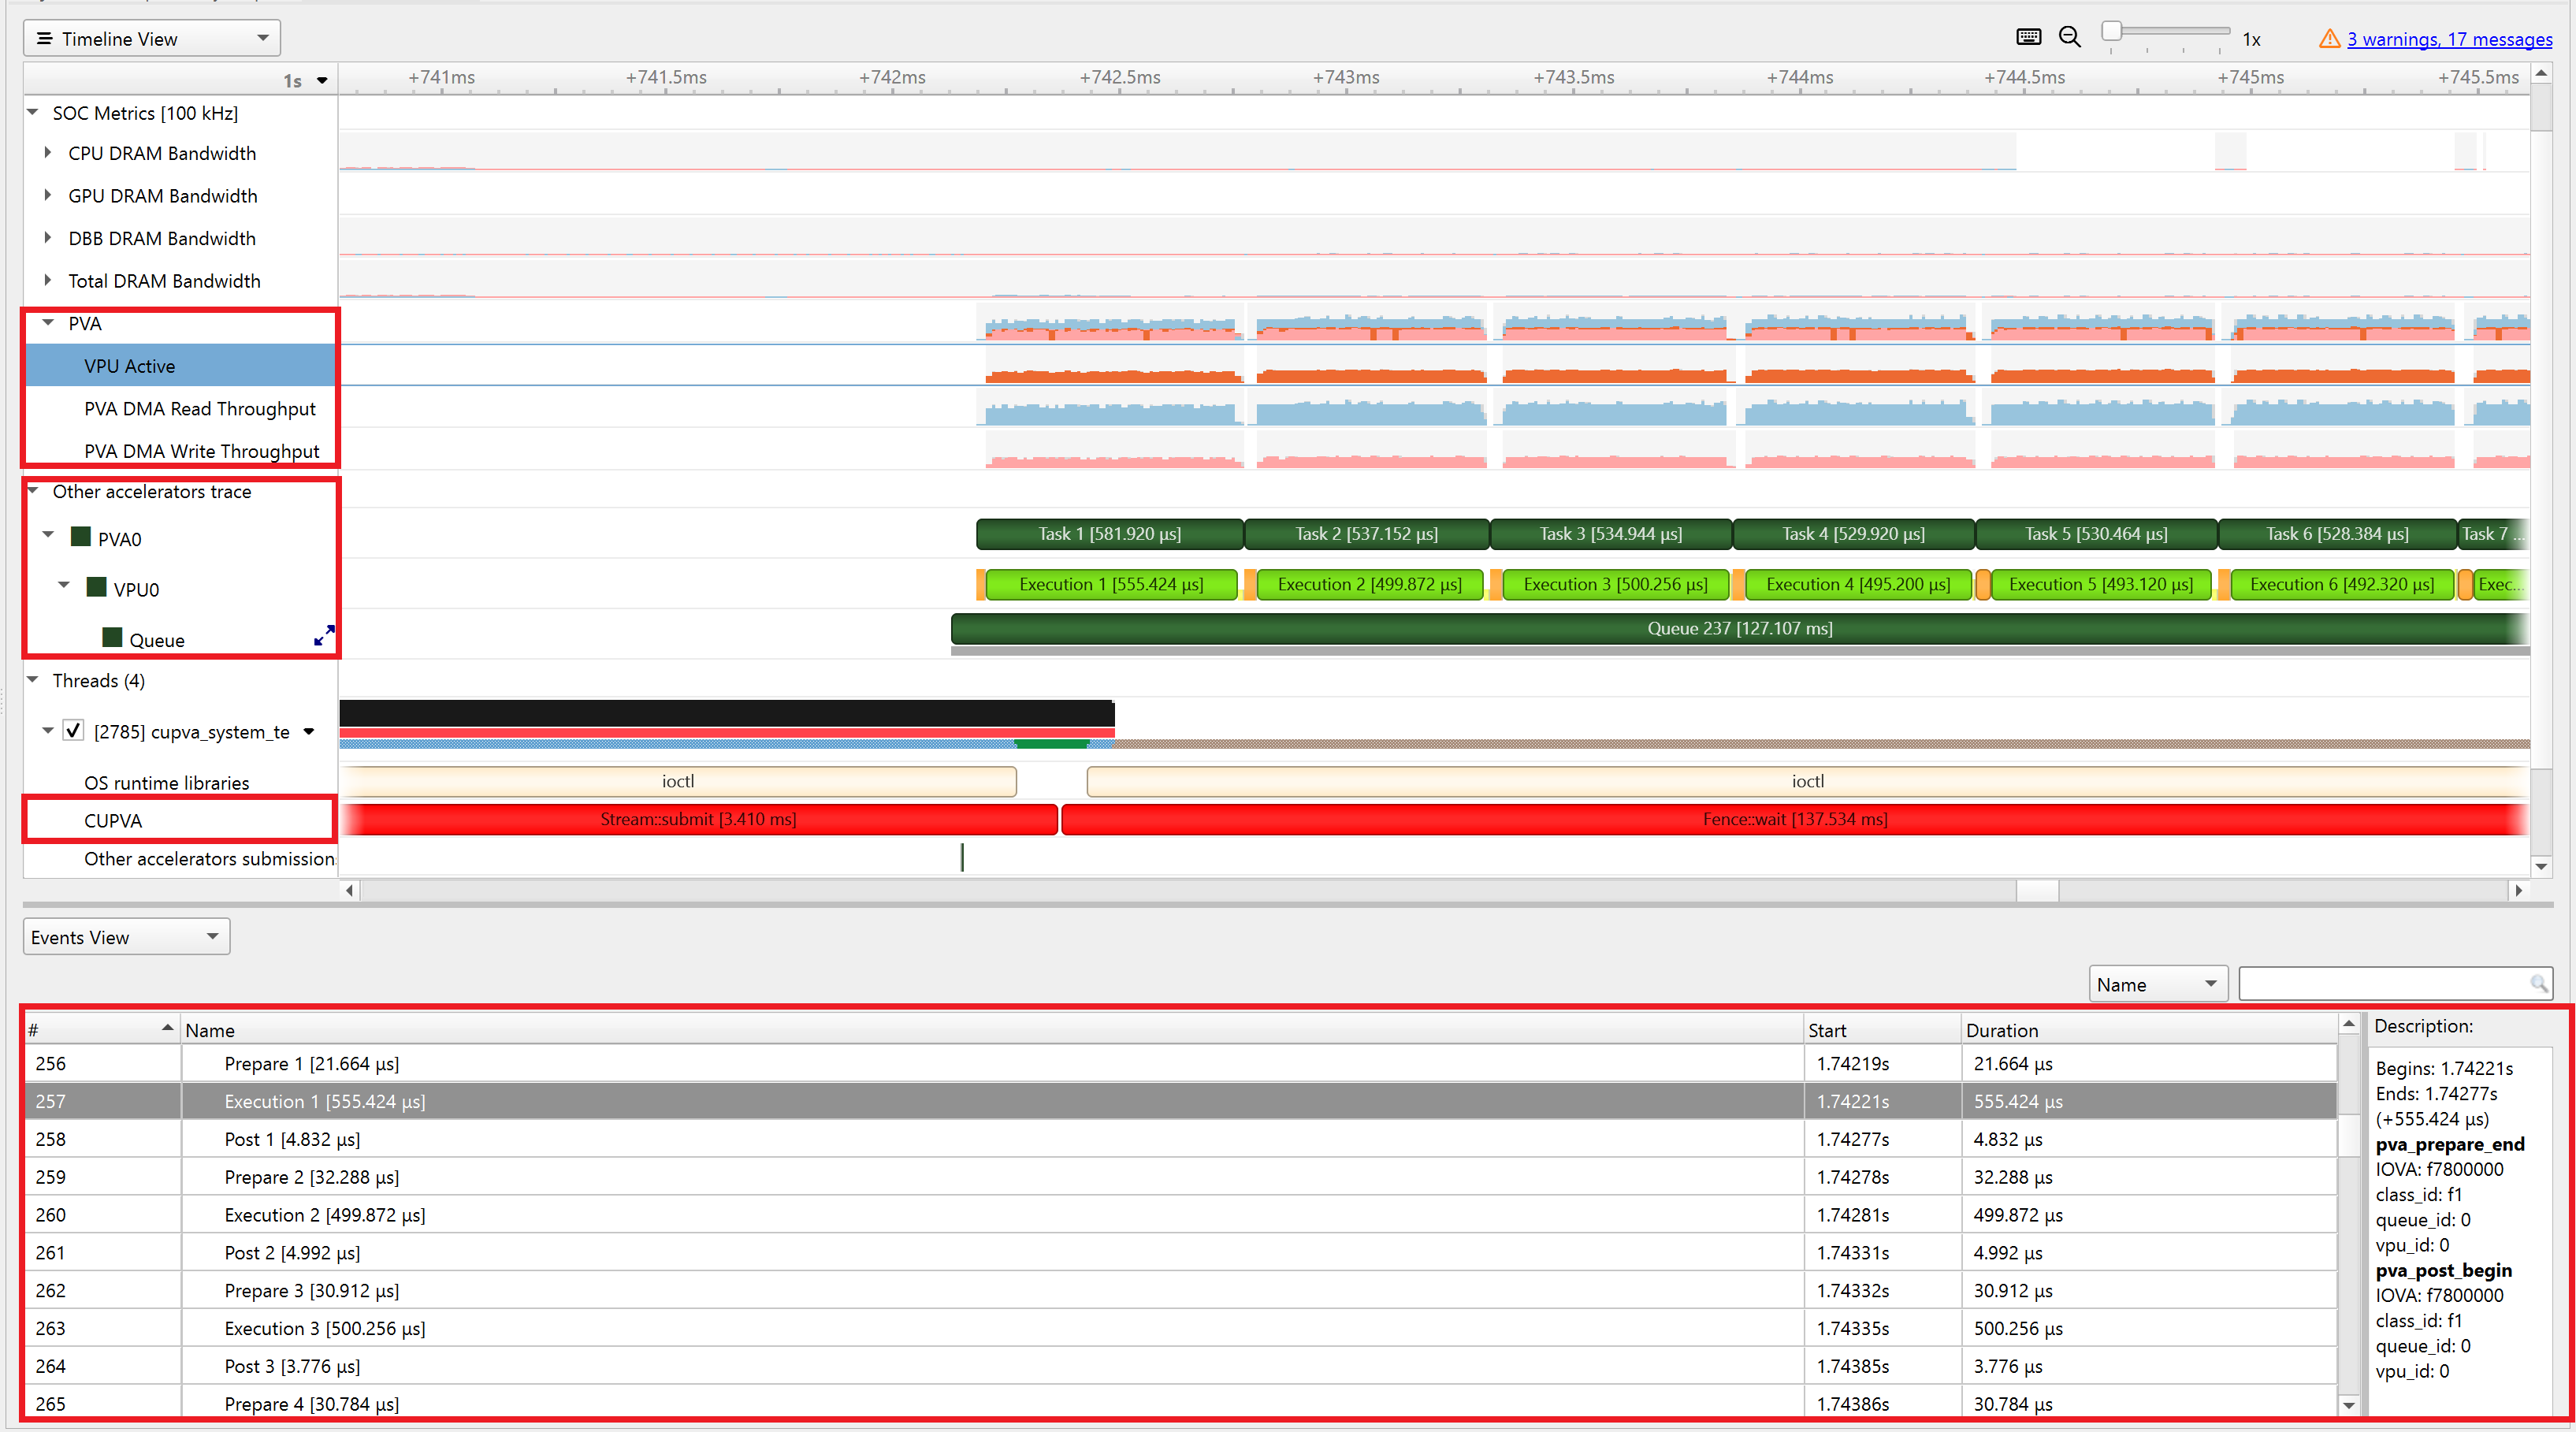
Nsight GUI visualizes the events during the analysis session in the
Timeline View. The overall VPU utilization and DMA throughput info can be viewed in thePVAsection of SOC Metrics, and detailed timing information for all submitted VPU tasks is in theOther accelerators tracesection. The detailed VPU task events can be listed in theEvents Viewsection by right-clicking on the VPU row and selecting theShow Events View. Timing of the cuPVA command submission and fence wait host-side APIs are shown in the cuPVA row of theThreadssection.