On-chip Debugging#
VPU applications may be debugged on-chip using the ChessDE debugger.
Note
Using ChessDE for debugging requires a valid Synopsys license for the relevant VPU architecture.
Starting JTALK server#
To use ChessDE with on-chip debugging, a JTALK server must be started. JTALK is the debugging protocol supported by ChessDE. There are multiple supported options to start the JTALK server:
Debug over IP (DoIP) launches a JTALK server which connects to the target over IP.
Cable based debugging launches a JTALK server which connects to the target over a JTAG cable. Both DSTREAM and FTDI JTAG cables are supported in this mode.
Refer to one of the above links for configuring and launching the JTALK server.
Note
All on-chip debugging methods require the target platform have JTAG support enabled. On secure targets, this requires specifying certain parameters prior to flashing via a BCT file. Refer to the DRIVE OS PDK Developer Guide or the Jetson Developer Guide for more information, under the section titled “Enabling JTAG Support on Secure Targets.”
ChessDE#
ChessDE is a fully featured graphical debugging environment.
Launching ChessDE#
Before launching ChessDE for on-chip debugging, ensure that a JTALK server is running.
ChessDE can be launched and connected to the JTALK server using the system wide pva-sdk-2.7-chessde command.
Use --help option to see the list of options that can be set. Note that ChessDE does not need to be running on the same machine as the JTALK server, see jtalk-ip option for more information.
pva-sdk-2.7-chessde --help
Each instance of ChessDE may be connected to at most one VPU core. Additionally, no VPU cores should have more than one instance of ChessDE connected at any time.
Note
Make sure to set required environment variables before running pva-sdk-2.7-chessde as below:
export PVA_GEN2_ASIP_PATH=<PATH_TO_ASIP_PROGRAMMER>
export PVA_GEN3_ASIP_PATH=<PATH_TO_ASIP_PROGRAMMER>
export LM_LICENSE_FILE=<PATH_TO_LICENSE_FILE>
# Alternatively to LM_LICENSE_FILE, SNPSLMD_LICENSE_FILE can be set:
export SNPSLMD_LICENSE_FILE=<TCP_PORT>@<LICENSE_SERVER>
Starting a Debug Session#
Follow the steps below to start debugging the VPU application using ChessDE.
Open the project:
File -> Open -> Project and navigate to your project's *.prx file in your local build output directory and open it.
Example for an Orin device:
\<YOUR BUILD OUTPUT DIR\>/mat_add/mat_add_dev__gen2.prxConfigure debug:
Debug -> Download programs -> None (attach mode)
Select debugger:
Debug -> Select debugger -> vpu_client
Start debugging:
Debug -> Start debugging or F5 or Green Bug on the toolbar. When prompted to select a core ID, select Core ``0`` or the appropriate core. You may want to modify your host scheduling code prior to debugging to ensure that the core ID for your VPU application is deterministic.
Run the application you want to debug on the target device.
Wait for the program code to open on the ChessDE and program to stop at the software breakpoint.
Using ChessDE#
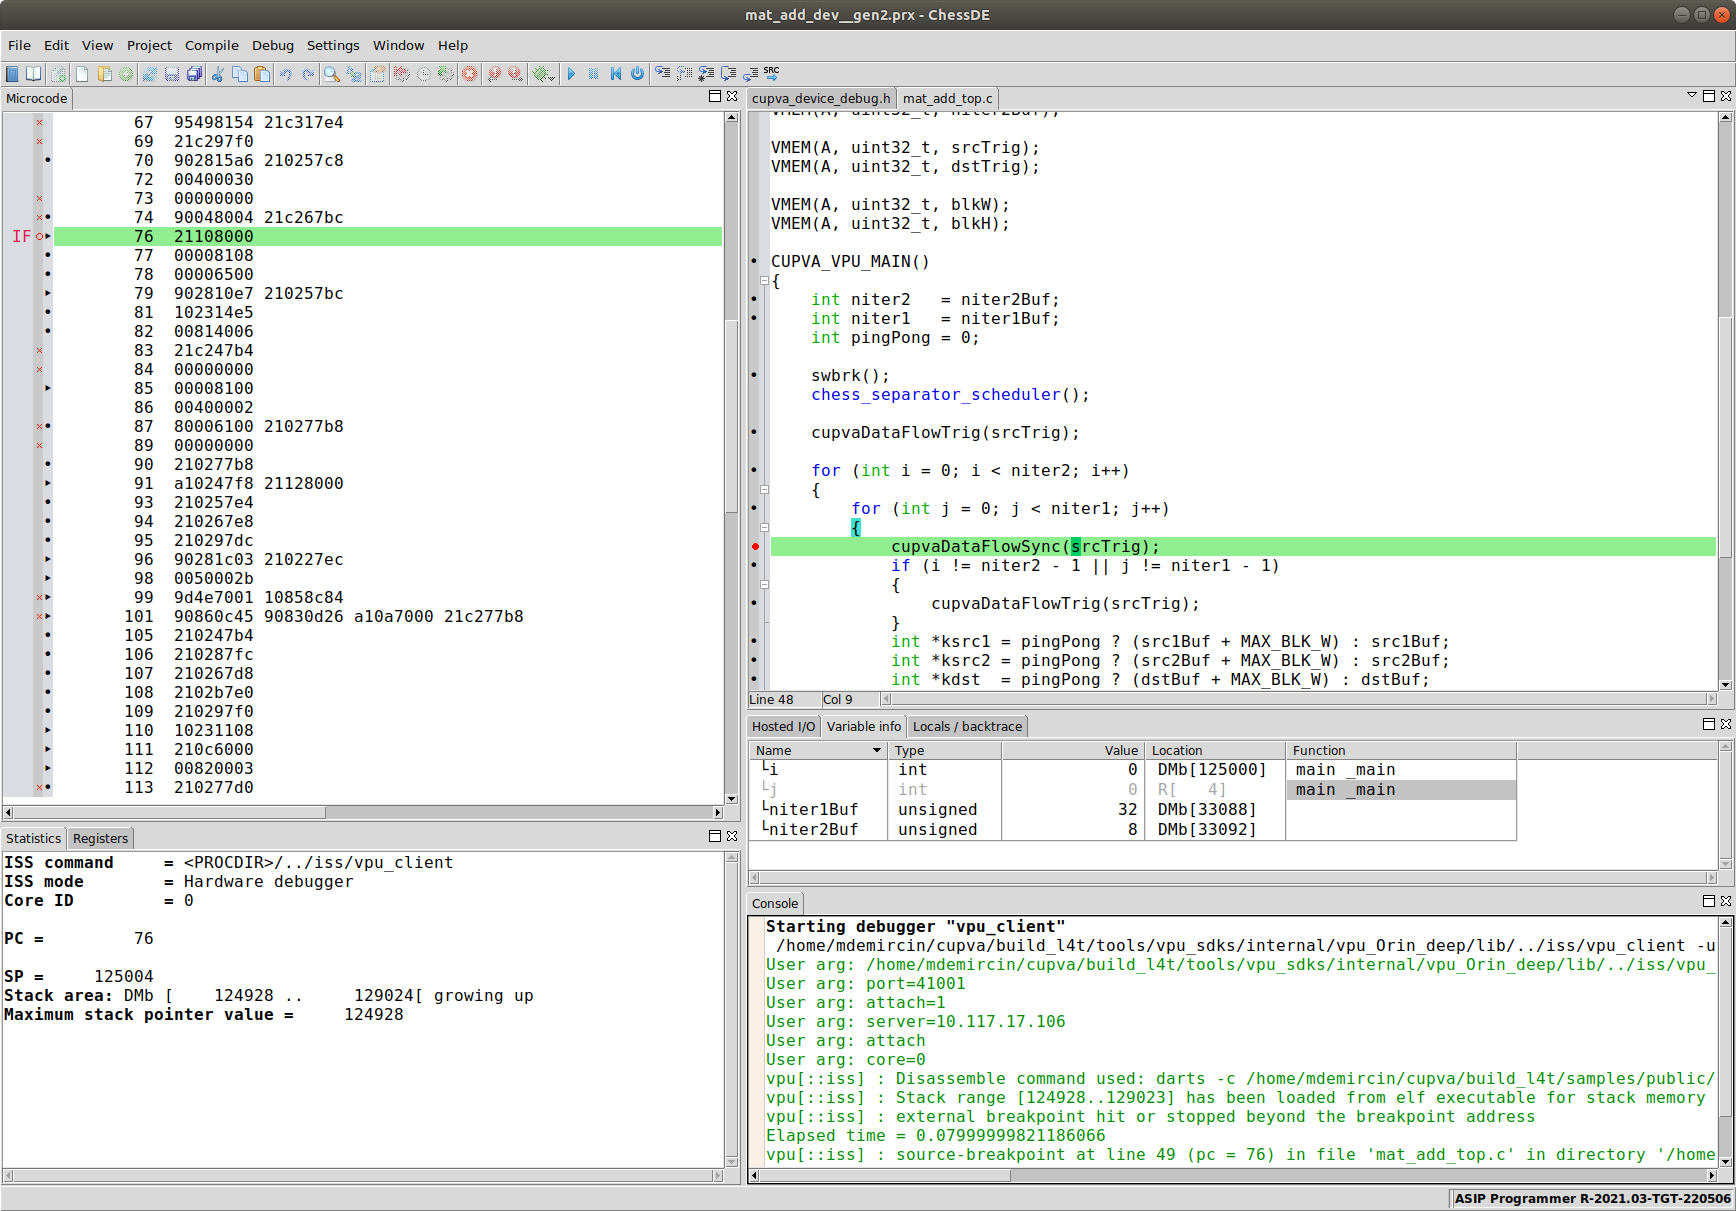
After starting a debugging session, you should see a window similar to the screenshot below.
From here, you can add breakpoints, inspect memories, step through code, inspect registers and more. For full information on using ChessDE, refer to the appropriate third party software documentation. Some tips are provided below on making productive use of ChessDE with PVA’s VPU.
1. Breakpoints default to hardware breakpoints#
Debugging with ChessDE supports up to 24 hardware breakpoints/watchpoints. PVA SDK generated PRX files configure hardware breakpoints as default to be used when double-clicking in ChessDE. If more than 24 breakpoints are required, users may right-click, select “configure breakpoint,” and choose a software breakpoint. Note that software breakpoint support depends on operating system configuration.
2. Many symbolic debugging features are not reliable for optimized code#
In optimized builds, variables are often either optimized out or code may be re-ordered in unexpected ways. This makes it difficult to always inspect symbolic values. To mitigate this, consider modifying flags to ChessDE to reduce optimization levels. This is not always effective as reducing optimization may prevent a program from compiling, primarily due to inefficient register usage. In such cases, it is beneficial to rely primarily on the disassembly window and register values rather than symbolic values in C code.
3. Vector registers are displayed in assembly numerically#
In VPU disassembly, registers are displayed numerically. For example, V0:V1 is the first double vector. However, in ChessDE, such registers are displayed by reference to register files, which are alphabetical. Since V0 maps to VA[0] and V1 maps to VB[0], to correctly view the value of V0:V1 user must inspect the first vector in VA and the first vector in VB.
4. Hiding register views can improve debugging performance#
It takes some time for the debugger to read the full state of all registers. If the registers are not visible in the GUI, this update step is skipped.