Basic VPU Debugging in ChessDE (via DOIP)#
This tutorial introduces how to use the ChessDE IDE to debug VPU programs on target hardware. The following topics are covered:
Connecting ChessDE IDE to the target (via DOIP)
View application data in ChessDE Memory View (VMEM)
View scalar & vector variables values in ChessDE
Set breakpoints and single step through VPU code in ChessDE
This tutorial’s code, taken from Lesson 8, produces an incorrect output image. We debug this code on target hardware using the ChessDE IDE to demonstrate some basic debugging features for the VPU.
Connect ChessDE IDE to Target HW#
We are connecting the ChessDE debugger to the target hardware via ethernet (DOIP). To
enable this, we must first include the cupva_device_debug.h header in our source code.
#include <cupva_device_debug.h>
To facilitate connection of ChessDE to the target, we must insert a software breakpoint into the source code, as shown below:
swbrk();
The ChessDE debugger is connected to the target once the code is run and halts on this SW breakpoint. When the code has halted on the SW breakpoint, your target console output is as follows:
ubuntu@jetson:~$ ./debugging_cpp -a assets
Using asset directory: assets
Read 393216 bytes from assets/low-contrast-kodim08-768x512-grayscale.data
Once your code has reached this point connect the ChessDE debugger to your target via the following steps.
Open two terminals on your host machine, one for starting the DOIP server, and the other for launching ChessDE.
Launch the DOIP server with the following command:
pva-sdk-2.7-doip -p=GEN2Launch the ChessDE gui with the following command:
pva-sdk-2.7-chessde -p=GEN2
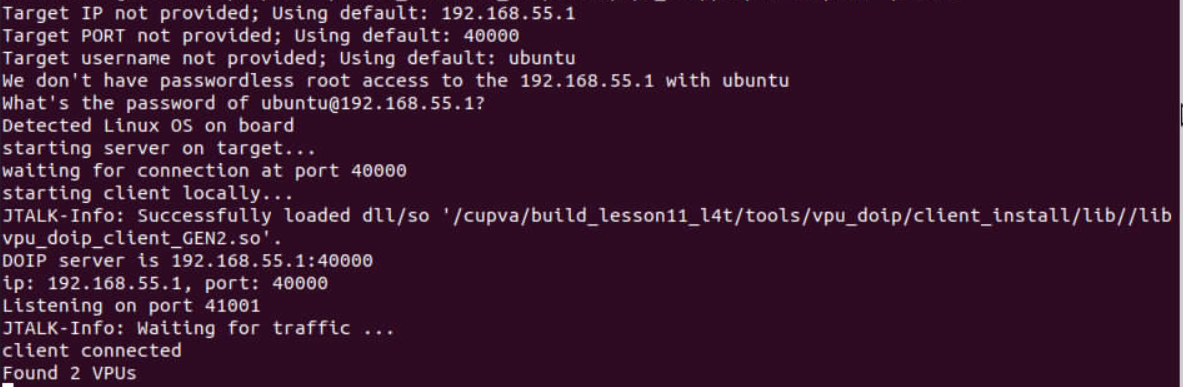
After running the DOIP script you should see in the console output that it has detected your target HW and found the VPU cores, as shown in the following image.
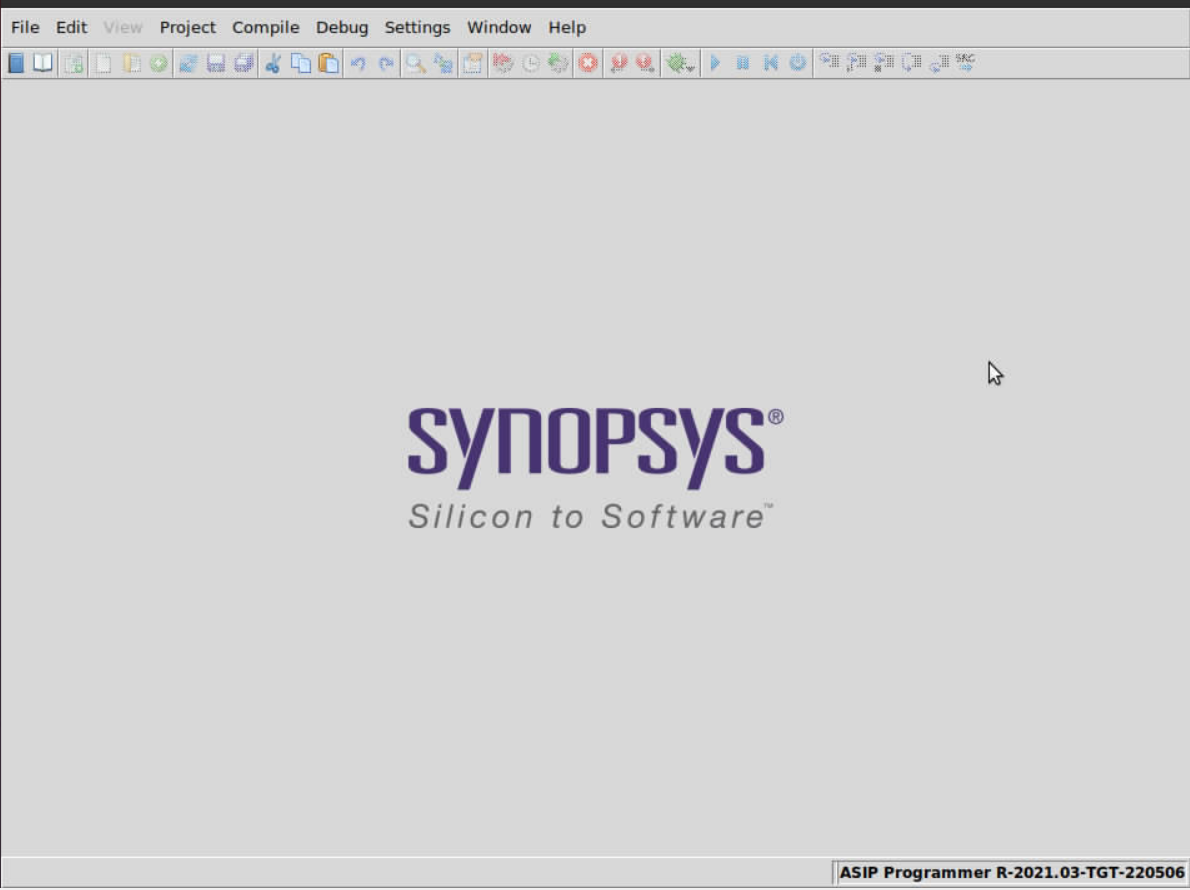
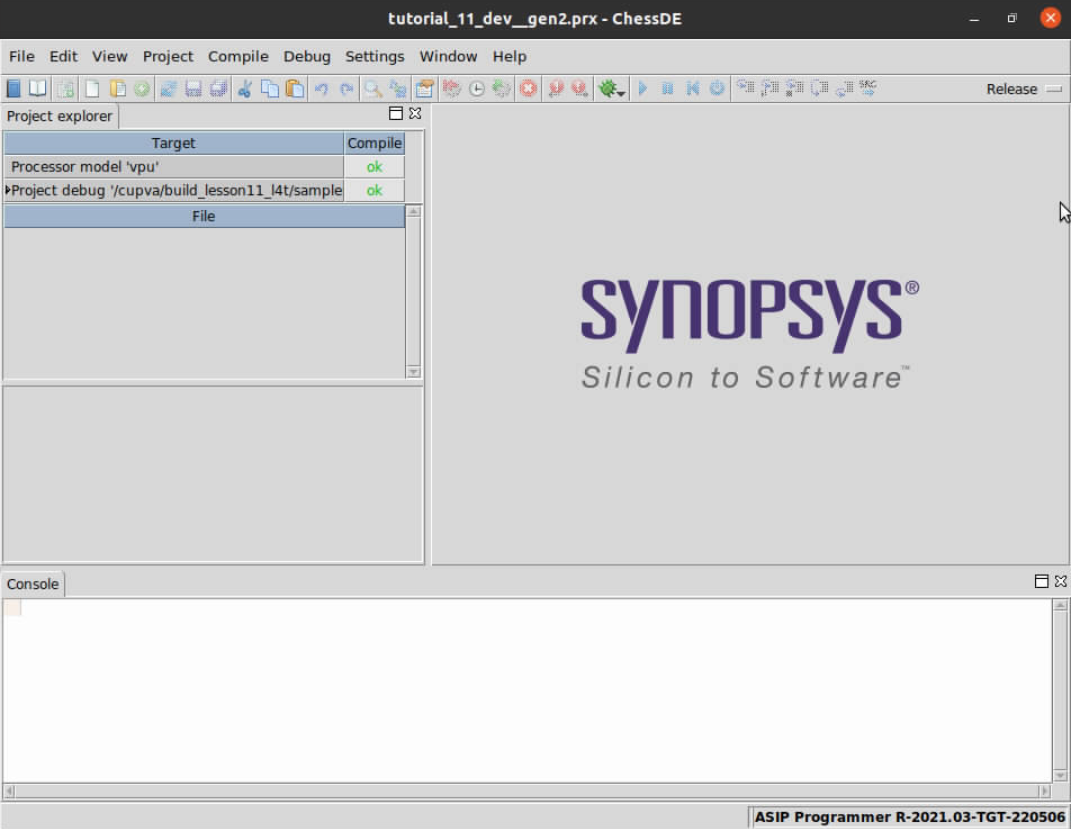
After running the ChessDE launch script, the ChessDE gui is launched as seen below:
In ChessDE, we open the VPU Debugging Tutorial project that is running on the target.
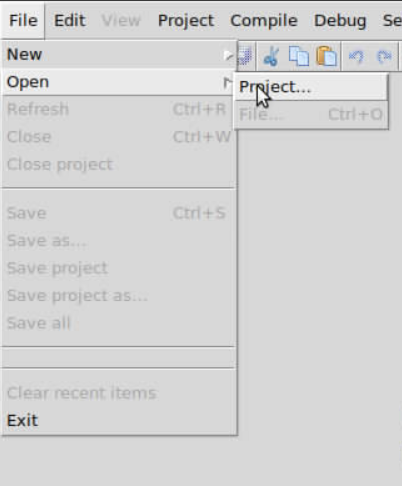
The project file is located at: <your build dir>/samples/public/tutorial/debugging/vpu/debugging_dev__gen2.prx
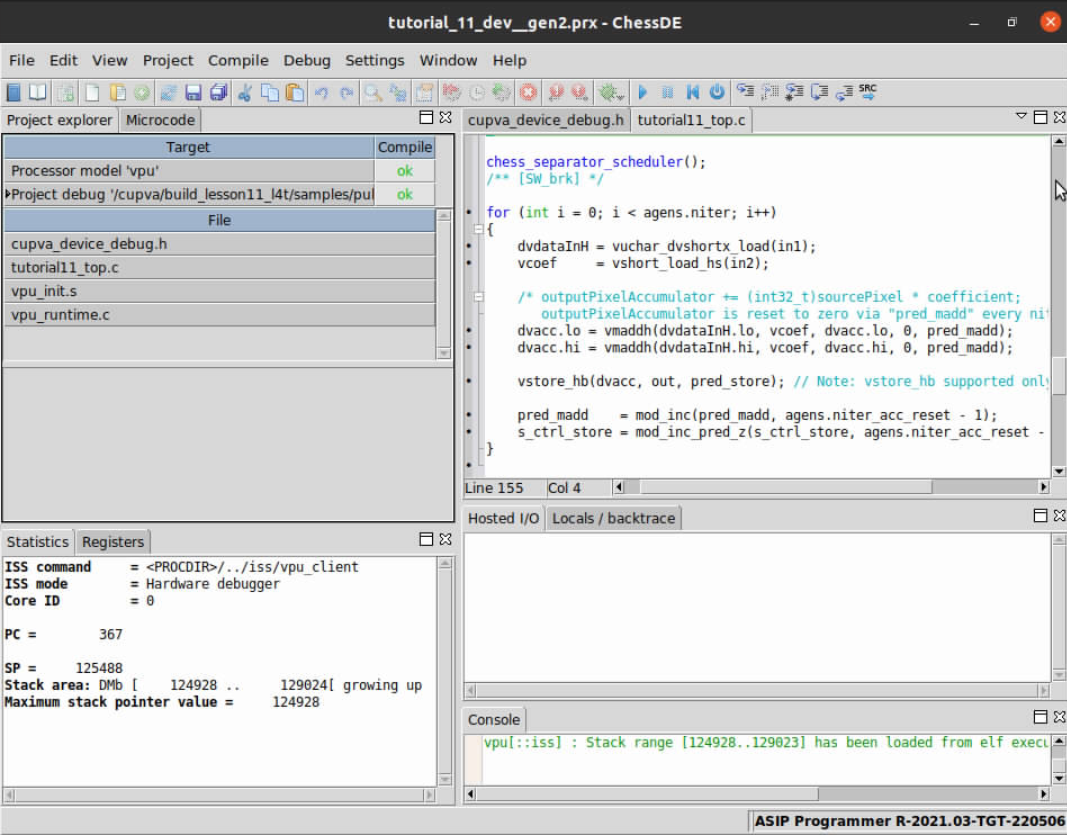
Upon successful opening of the project your ChessDE interface appears as follows:
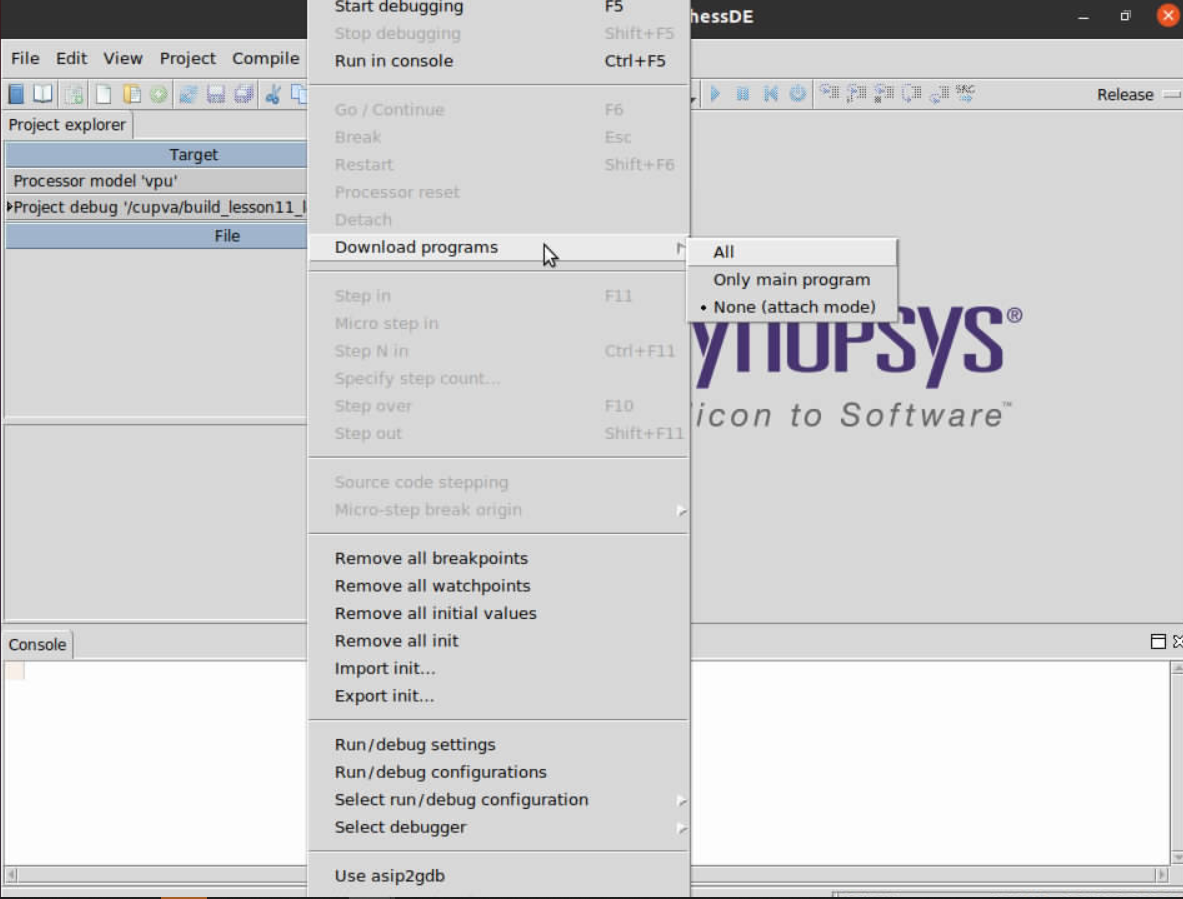
In ChessDE, set Debug-> Download programs -> None (attach mode).
Click on the arrow to the right of the green debug icon and select vpu_client.
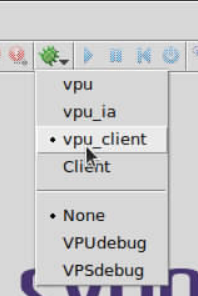
You are then be prompted to select a core ID. Your selection is likely to be Core 0.
Wait for a few moments while the ChessDE interface finishes loading, then your
ChessDE screen appears as follows:
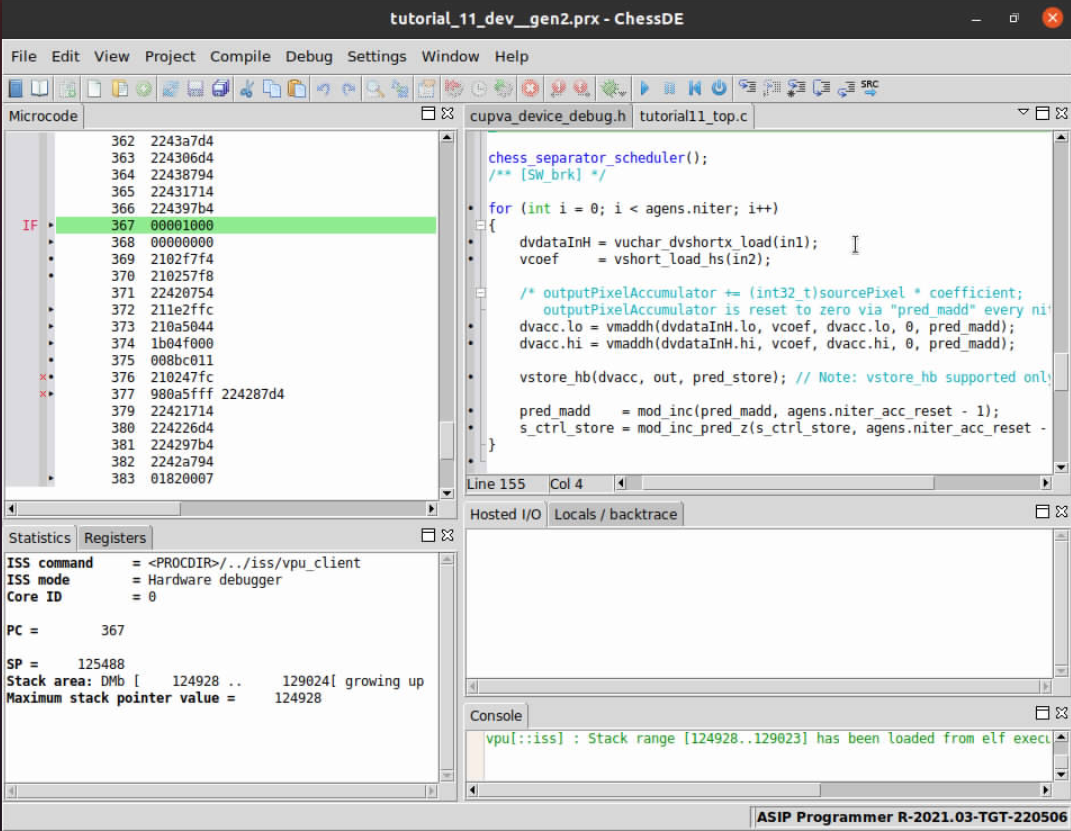
See all the source files from your project that are available for viewing by opening the Project Explorer pane.
Select View->Project Explorer to make sure the pane is visible.
You are now able to click on any of the project’s source files and set additional breakpoints. Furthermore, from within the ChessDE GUI, you are able to access panes for viewing VPU registers, assembly code, local variables, and target connections.
Basic VPU Debugging#
Now that the project files are open in ChessDE and we have successfully connected to the target we start debugging the code to find the root cause of the issue. A first step you might take to understand what is going on during program executation is to check input memories to confirm if the correct input/output data resides in the VPU’s internal memory (VMEM).
Viewing VPU Memories#
This program uses three sections of VPU memory to store input and output data from a processed image tile. They are identified by the following variable names:
VMEM(A, uint8_t, inputTileBufferVMEM,
     RDF_CIRCULAR(uint8_t, TILE_WIDTH, TILE_HEIGHT, KERNEL_RADIUS_HOR, KERNEL_RADIUS_VER));
VMEM(C, int16_t, kernel, KERNEL_WIDTH *KERNEL_HEIGHT);
VMEM(B, uint8_t, outputTileBufferVMEM, RDF_DOUBLE(uint8_t, TILE_WIDTH, TILE_HEIGHT));
To view these memory contents in ChessDE, start by adding these buffer pointers to the “Variable info” pane via the following steps:
In the
debugging_top.csource window double-click oninputTileBufferVMEMto highlight the text.Right-click on the highlighted text and select “Add variable info” in the drop-down menu (Repeat these two steps for the
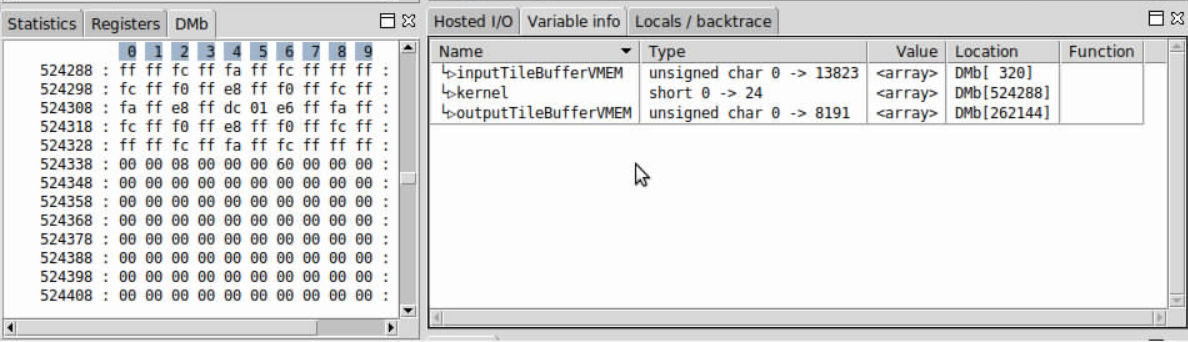
outputTileBufferandkernelvariables).The “Variable info” pane is now visible in the gui. In the “Variable info” pane, take note of the memory addresses in the “DMb Location” column and open a memory pane by going to “View->Internal memories->DMb”.
In the DMb memory pane scroll to the address of the “kernel” coefficients and you see the filter coefficients are in the correct location in memory (Note: doing the same for the
inputTileBufferVMEMshows that the first image tile was transferred to the correct location in VMEM as triggered by the DMA engine).
The following screenshot shows the memory contents of the coefficient buffer (the view
is in hexadecimal format, which is set by right-clicking in the DMb pane and selecting
Data format->Hexadecimal).
Set a Breakpoint#
Since it has been verified that the input data is loaded correctly for the first tile we try viewing the contents of the scalar and vector registers for intermediate computations to see if data is being loaded and processed correctly. We set an additional breakpoint in the VPU code at a point in the code execution that gives us visibility into the values of the intermediate calculations.
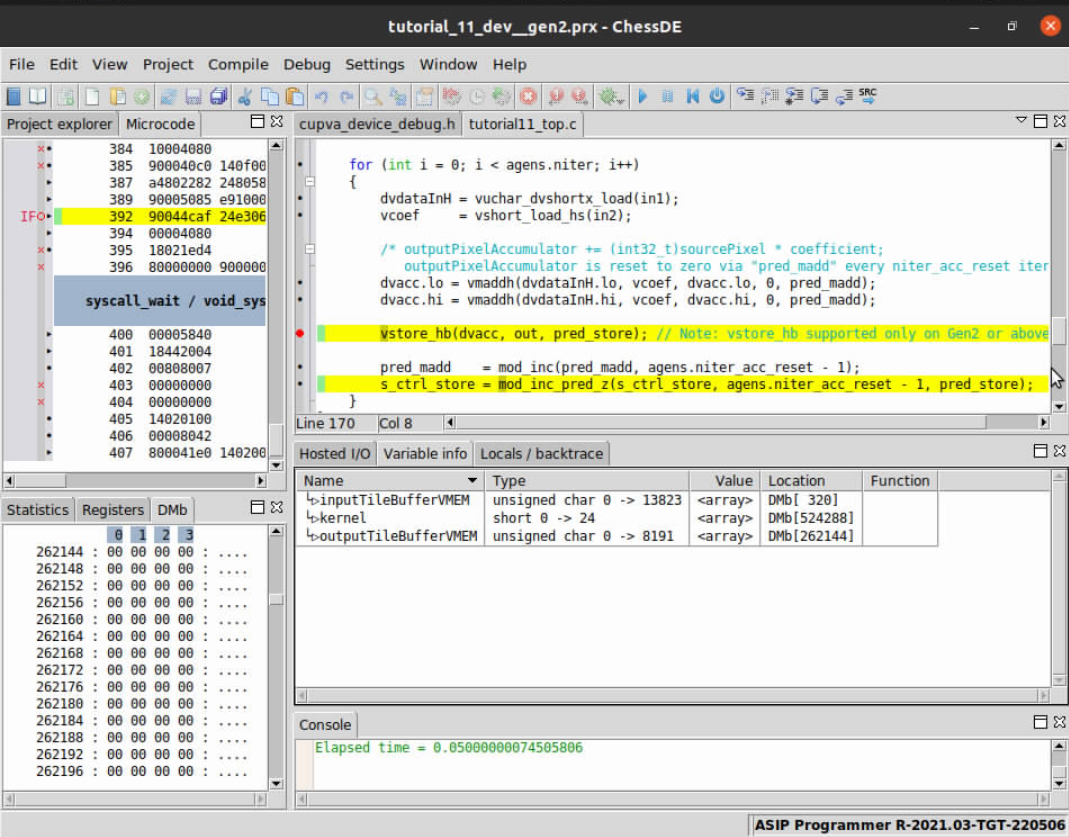
Set a breakpoint at the “vstore” line of the debugging_top.c file by double-clicking
in the area directly to the left of the beginning of the line. You see a red dot
once the breakpoint is set. The breakpoint is set at the “vstore” instruction so that
we can use the debugger to see what the values of the vector load and multipy-add are at
each iteration of the loop. Run the code and observe the debugger halting at this breakpoint.
Viewing Vector & Scalar Registers#
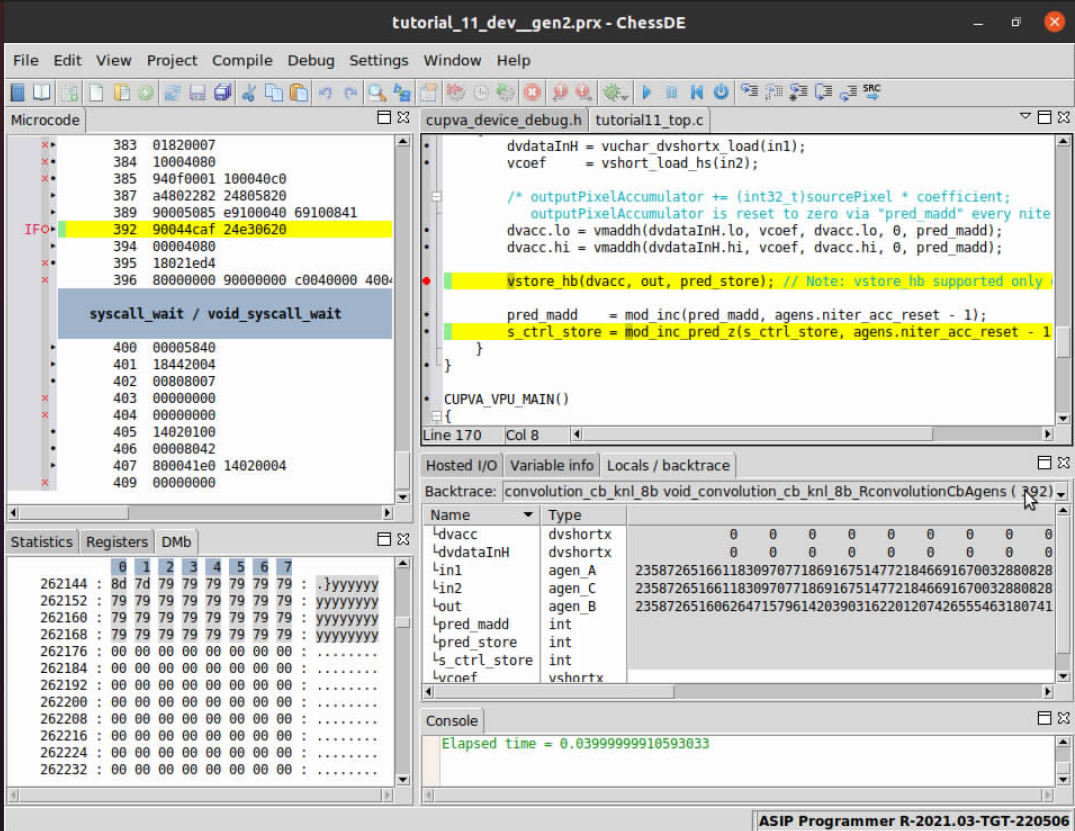
Once the breakpoint is hit the contents of the input and accumulation vectors can be viewed via the “Locals/backtrace” pane, as seen in the following image:
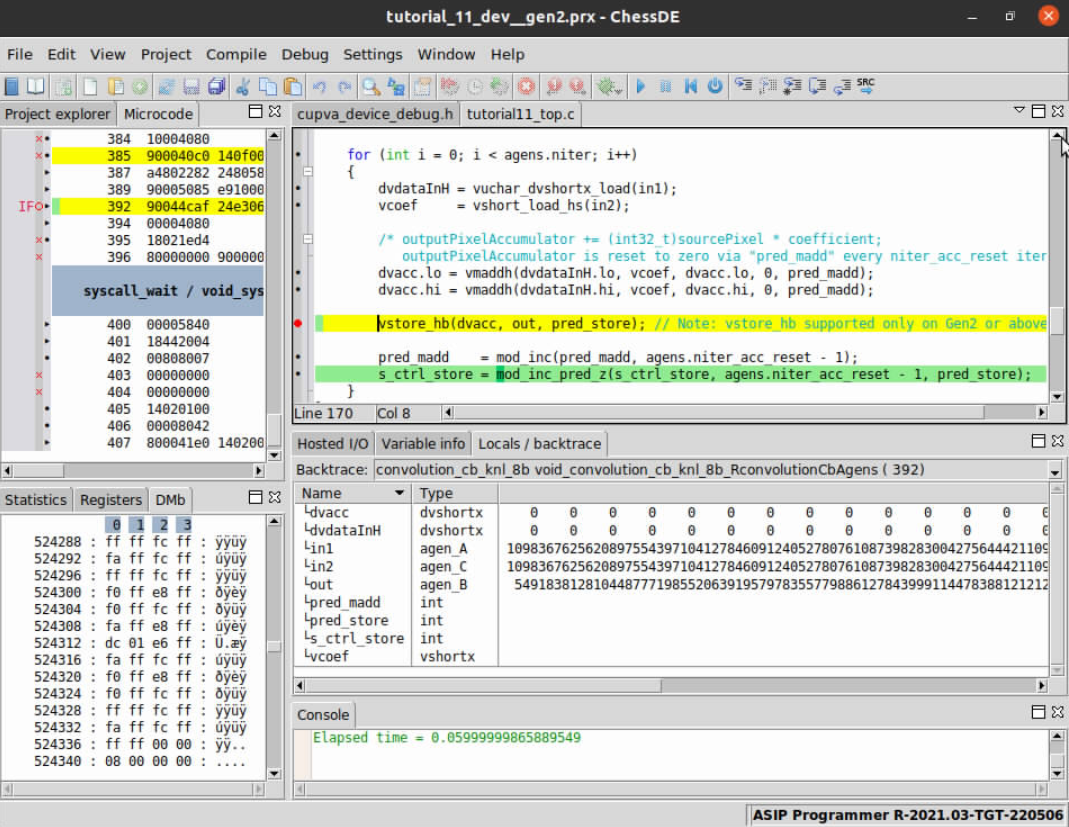
This image shows the contents of the vector register for the first iteration of the
filter inner loop. Since we are working in SIMD, the dvdataInH input vector contains a
horizontal stripe of 32 input pixels. For simplicity, we focus on viewing only the
first pixel in the stripe (contained in SIMD lane 0) and track its calculation as we
step through the code.
Stepping Through VPU Code#
We track the calculation of the first pixel output to see if we can discover where things might be going wrong. Single-step through the VPU code by clicking the single-step icon and watching the local variables update in the “Locals/backtrace” pane. Below is a trace of the expected intermediate outputs for the very first pixel in the image to be filtered, up-to/prior to the round/sat store operation (vstore).
[kx,ky]  [InPix]    [coeff]    [acc]
[0,0]    0          -1         0
[1,0]    0          -4         0
[2,0]    0          -6         0
[3,0]    0          -4         0
[4,0]    0          -1         0
[0,1]    0          -4         0
[1,1]    0          -16        0
[2,1]    0          -24        0
[3,1]    0          -16        0
[4,1]    0          -4         0
[0,2]    0          -6         0
[1,2]    0          -24        0
[2,2]    93         476        44268
[3,2]    93         -26        41850
[4,2]    93         -6         41292
[0,3]    0          -4         41292
[1,3]    0          -16        41292
[2,3]    93         -24        39060
[3,3]    93         -16        37572
[4,3]    93         -4         37200
[0,4]    0          -1         37200
[1,4]    0          -4         37200
[2,4]    93         -6         36642
[3,4]    93         -4         36270
[4,4]    93         -1         36177

Output in memory is for this pixel is expected to be:
"(36177 + (1 << 7)) >> (1 << 8) = 141"  (via rounding + saturation store operation)
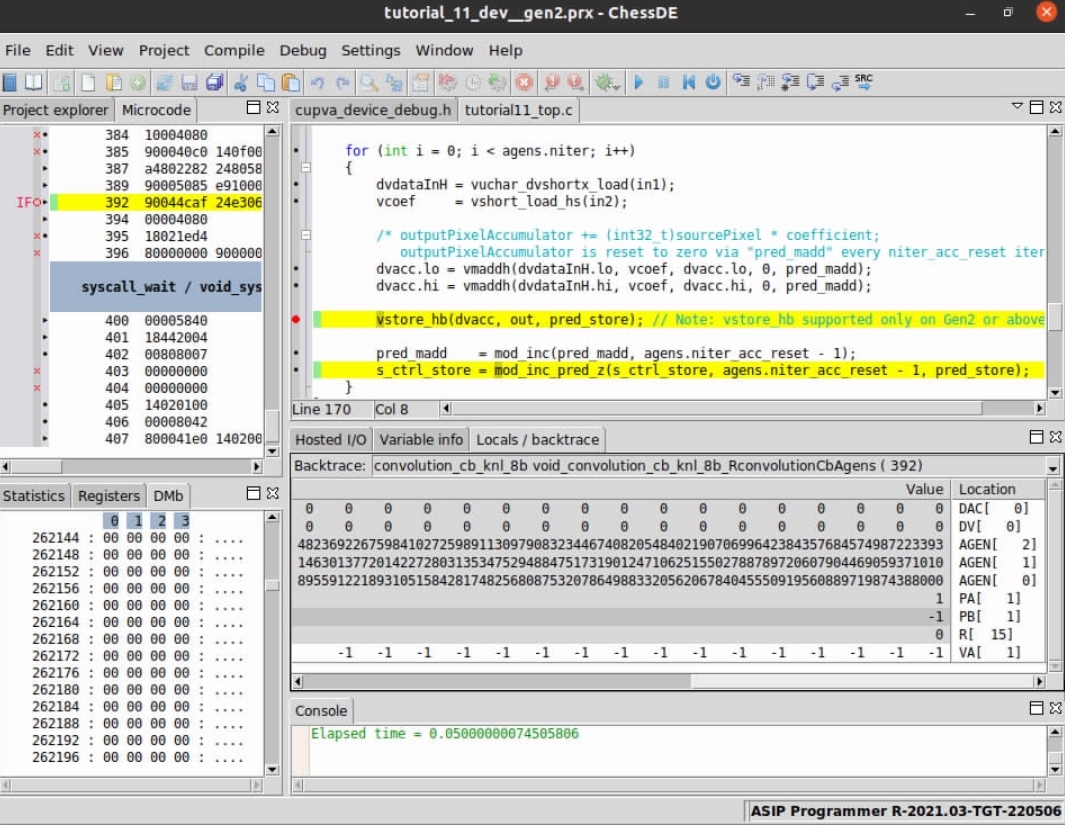
Below is a snapshot of the register contents at the very last iteration of the filter inner loop for the first tile. When stepping through all 25 iterations of the kernel inner loop we can see that all of the intermediate accumulation values are lining up as expected.
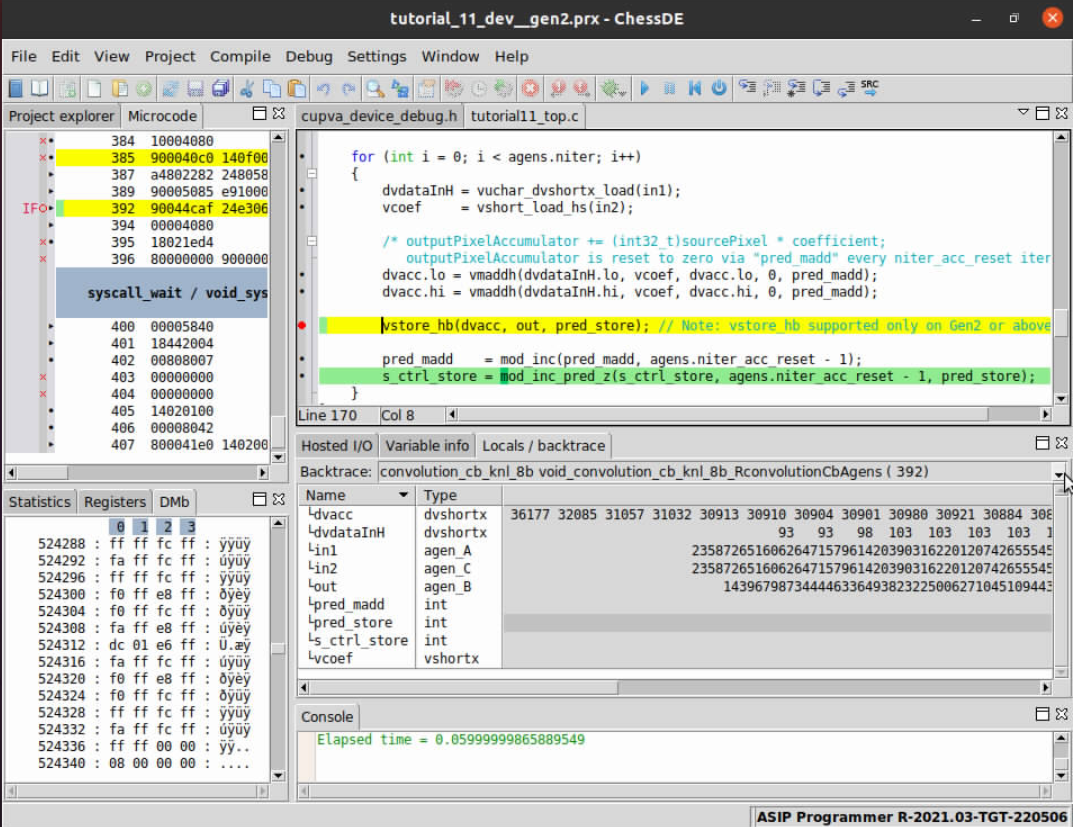
However, if we step after the store operation and examine the memory view at outputTileBuffer we see that the
stored output values are zero, which is incorrect.
This means that the store is not happening at the correct iteration since we have confirmed that all the intermediate calculations leading up to the store match what’s expected.
Notice in the following view that
the pred_store value (PB[ 1]) is tripped at the beginning of the filter’s inner loop iteration and not at the end.
This is because the value of s_ctrl_store is not initialized properly to 1.
Set s_ctrl_store to its correct initialization of 1, recompile and reload the
updated code to the target. Restart ChessDE and the DOIP server using the steps
discussed at the beginning of this tutorial. Run the code up to when the first
filtered pixel outputs are produced and view the contents of outputTileBuffer
and it can be seen in the memory window that the correct filter outputs are being
produced now.