VSS Observability#
This guide provides step-by-step instructions for running the VSS (Video Summarization Service) pipeline with health evaluation enabled to collect performance metrics and logs.
Overview#
The VSS pipeline provides comprehensive performance monitoring through two complementary systems that collect detailed metrics, logs, and diagnostic information during video processing:
VIA Health Report
Collects comprehensive performance metrics and diagnostic files including:
Component-level latency measurements and timing breakdowns
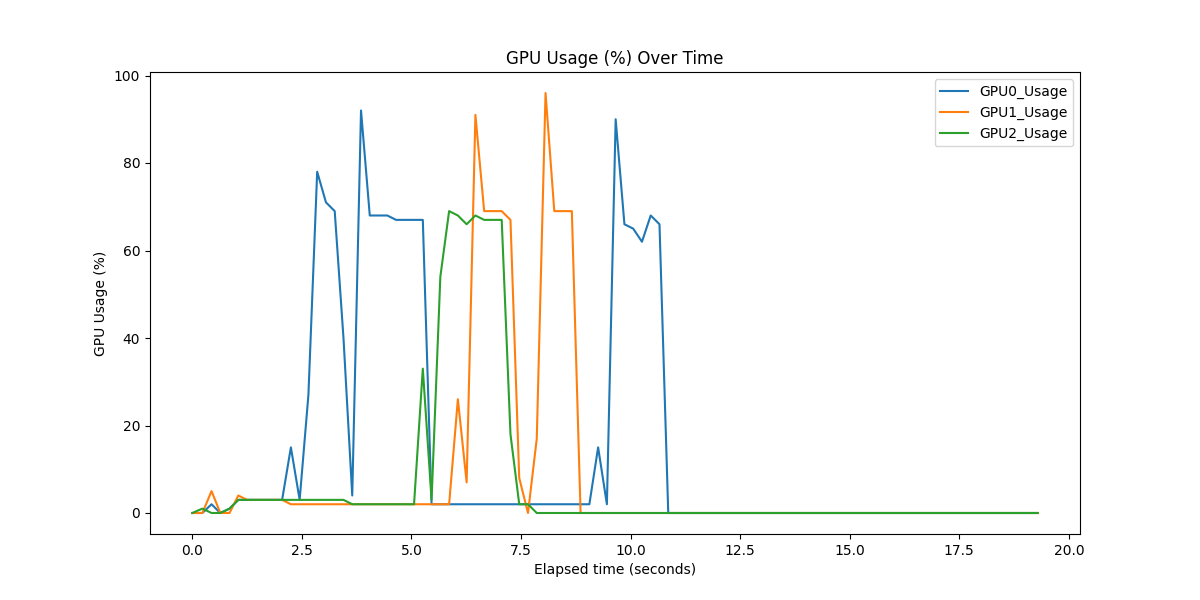
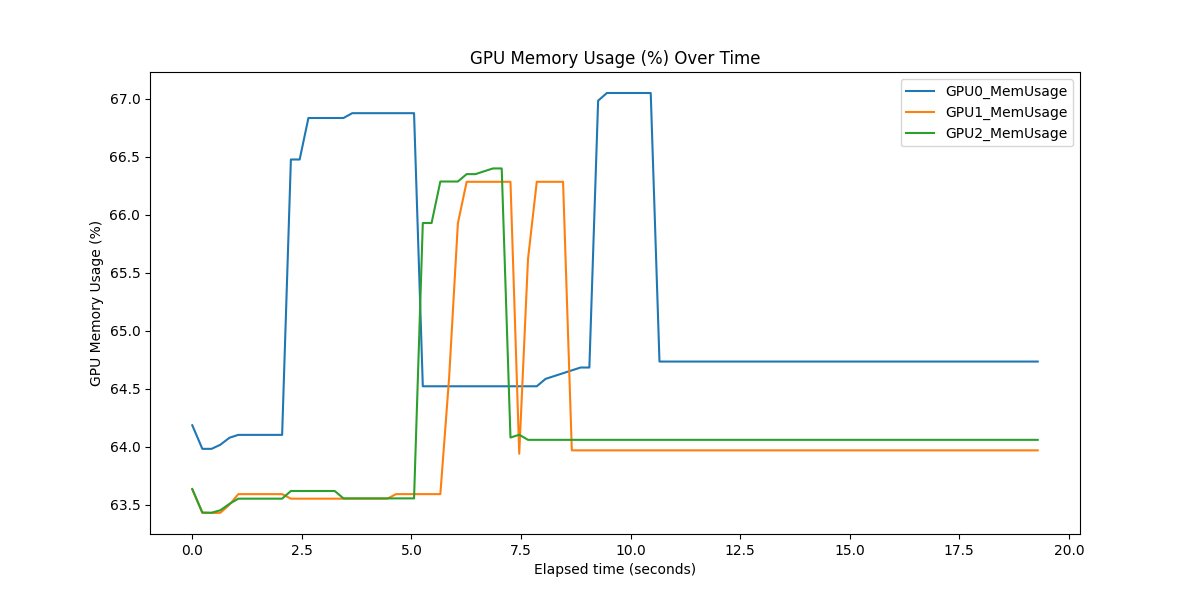
GPU usage and memory consumption over time with visualizations
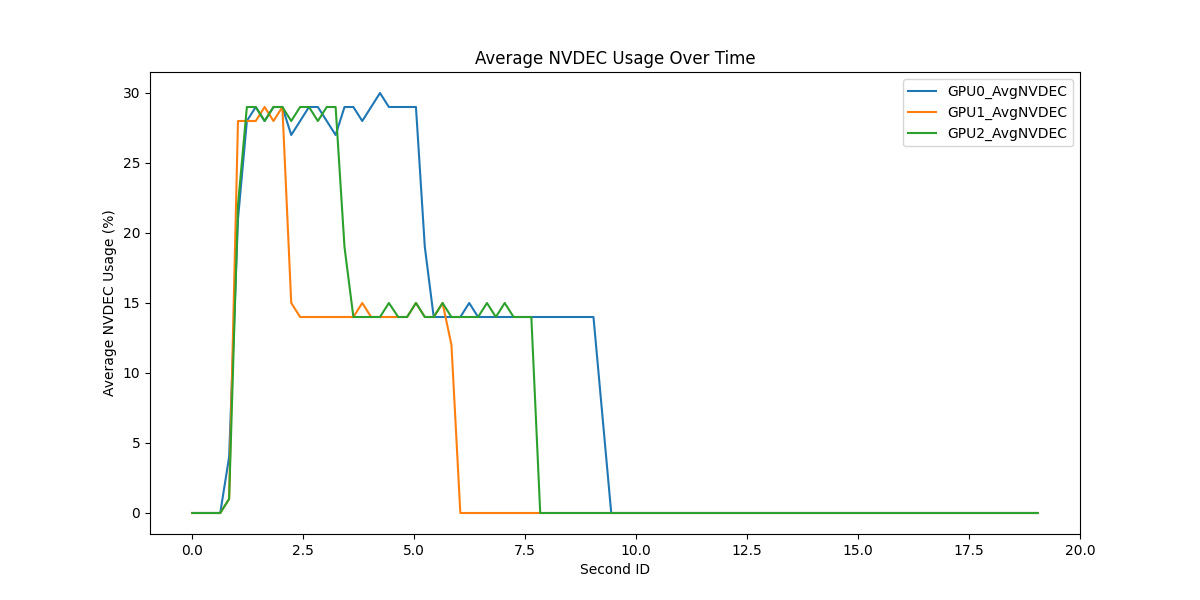
NVDEC usage for video decode operations
VLM processing outputs and summaries for debugging
System configuration and pipeline state information
Generated plots and CSV files for analysis
OpenTelemetry (OTEL) Tracing
Provides distributed tracing with granular latency & timing information for:
Context-aware RAG pipeline operations (document processing, graph operations, vector retrieval)
VLM (Vision-Language Model) pipeline visual processing and inference
Individual component execution times and dependencies
Request flow visualization through Jaeger UI
Cross-service timing correlation and bottleneck identification
Both systems can be used independently or together for comprehensive performance analysis.
Instructions for OTEL Tracing and Monitoring#
1. Set Up and Test Deployment of VSS Blueprint#
Refer to the VSS Pipeline Deployment Guide for instructions on using Docker Compose to deploy the VSS pipeline.
2. (Optional) Set Up Services for Jaeger UI#
To run VSS with a UI to graph OpenTelemetry traces, you can run with the Docker Compose profile perf-profiling. This is not required if you simply want to collect the logs and traces in static files.
As an example, for local deployments use the Local Deployments Compose File before running VSS as described in Deploy VSS section of the Deployment Guide.
To use this profile and and the UI, also make a new file in the same directory as your compose.yaml file called otel-collector-config.yaml and add the following:
receivers:
otlp:
   protocols:
      grpc:
      endpoint: 0.0.0.0:4317
      http:
      endpoint: 0.0.0.0:4318

processors:
batch:

exporters:
# Export to console for immediate viewing
debug:
   verbosity: detailed

# Export traces to Jaeger via OTLP gRPC
otlp/jaeger:
   endpoint: jaeger:4317
   tls:
      insecure: true

service:
pipelines:
   traces:
      receivers: [otlp]
      processors: [batch]
      exporters: [debug, otlp/jaeger]

   metrics:
      receivers: [otlp]
      processors: [batch]
      exporters: [debug]
Adjust ports as necessary.
3. Enable Evaluation Environment Variables#
Users can enable VSS health evaluation reports and OTEL tracing.
Enable VSS Health evaluation reports (log files written to the container):
export ENABLE_VIA_HEALTH_EVAL=true # required for health evaluation report and performance metrics
Enable VSS OTEL tracing:
export VIA_ENABLE_OTEL=true
export VIA_CTX_RAG_ENABLE_OTEL=true
export VIA_OTEL_EXPORTER=otlp # if you want to view OTEL traces in the Jaeger UI, otherwise set 'console'
export VIA_OTEL_ENDPOINT=http://otel-collector:4318 # if exporter is set to 'otlp'
To run compose with the perf-profiling services for the Jaeger UI and otel-collector, set the following environment variable:
export COMPOSE_PROFILES=perf-profiling
See For Helm Deployments section below to set these when using Helm.
3. Run VSS#
Start your VSS Docker container/server, and do a warm-up run to ensure the system is properly initialized
Upload your target video or image
Execute the
summarize()function that you want to profile (through the UI or API)
4. (Optional) Viewing Traces#
Access the Jaeger UI while VSS is running to view the collected traces if otlp was the selected exporter:
# Jaeger UI is available at:
http://localhost:16686
Traces will also be dumped with the other health evaluation logs regardless of whether you set up the Jaeger UI, see Collecting VIA Health Reports and Log Files section on how to access them below.
Key Traces to Monitor#
These traces should be available to monitor:
Trace Name |
Description |
|---|---|
VIA Pipeline End-to-End |
Complete request processing time |
VLM Pipeline Latency |
Total time for vision-language model processing |
Total Decode Latency |
Aggregate video decode time across chunks |
Decode - Chunk X |
Individual chunk decode times for bottleneck identification |
Total VLM Latency |
Aggregate VLM processing time |
VLM NIM Inference - Chunk X |
Per-chunk VLM inference times |
Context Aware RAG Latency |
Total RAG processing time |
context_manager/add_doc |
RAG Document addition operations |
ASR NIM Inference - Chunk X |
Per-chunk ASR inference times (if ASR is enabled) |
Collecting VIA Health Reports and Log Files#
Enable VIA Health Evaluation#
To collect the health evaluation reports and log files, ensure you set this environment variable before running the VSS pipeline.
export ENABLE_VIA_HEALTH_EVAL=true
Collect Health Report and Logs#
After running summarization queries while the container is running, collect the generated log files. The system generates files in the following location within the container:
/tmp/via-logs/files_requestid_*
Each request generates files with a unique request ID format like: 6236eeb8-be1b-4cb4-8d43-2d2d18f04613
Follow these steps to copy log files from the Docker container directly into an organized folder structure on your host system:
# Step 1: Find your container name/ID
docker ps

# Step 2: Set your request ID
container_name="<your_vss_container_name>"   # Typically via-engine-local-<your_username>

# Step 3: Make directory on your host system to store logs
mkdir -p ~/vss-performance-logs

# Step 4: Copy entire logs directory from container
docker cp $container_name:/tmp/via-logs ~/vss-performance-logs
The VIA Health Report system collects comprehensive performance metrics, GPU usage data, and diagnostic information when enabled, and writes to the /tmp/via-logs/ directory inside the running VSS container.
Collected Files Descriptions#
The following files are generated for each request with unique request ID <unique_request_id> when ENABLE_VIA_HEALTH_EVAL is enabled:
Configuration and Summary Files:
via_health_summary_<unique_request_id>.json- VSS configuration and component latenciesvlm_testdata_<unique_request_id>.txt- Dense caption output from VLM processingsumm_testdata_<unique_request_id>.txt- Summary output from /summarize API call
GPU Usage Files:
via_gpu_usage_<unique_request_id>.csv- GPU usage and memory values over timevia_plot_gpu_<unique_request_id>.png- GPU usage plot visualizationvia_plot_gpu_mem_<unique_request_id>.png- GPU memory usage plot visualization
Video Decode Files:
via_nvdec_usage_<unique_request_id>.csv- NVDEC usage for video decode over timevia_plot_nvdec_<unique_request_id>.png- NVDEC usage plot visualization
Additional Log Files:
via_engine.log- VSS engine logs pertaining to Ingestion pipelinevia_engine.log.<date>- Rotated VSS engine logs with date suffixvia_ctx_rag.log- VSS CA RAG logs pertaining to Retrieval pipeline
OTEL Traces:
via_otel_traces_<unique_request_id>.json- OTEL traces dumped in JSON formatvia_otel_traces_<unique_request_id>.txt- OTEL traces in text format
Health Summary Metrics#
The via_health_summary_<unique_request_id>.json file contains comprehensive performance metrics:
System Configuration
Metric Name |
Description |
Example Value |
|---|---|---|
num_gpus |
Number of GPUs available |
3 |
gpu_names |
List of GPU model names |
[“NVIDIA H100 PCIe”] |
vlm_model_name |
Vision-language model used |
“cosmos-reason2” |
vlm_batch_size |
VLM processing batch size |
128 |
Video Processing Parameters
Metric Name |
Description |
Example Value |
|---|---|---|
input_video_duration |
Total video length in seconds |
180.0 |
chunk_size |
Duration of each processing chunk |
30 |
chunk_overlap_duration |
Overlap between chunks in seconds |
0 |
num_chunks |
Total number of chunks created |
6.0 |
Timing Metrics (seconds)
Metric Name |
Description |
Example Value |
|---|---|---|
e2e_latency |
Complete end-to-end processing time |
20.33 |
vlm_pipeline_latency |
Total VLM pipeline processing time |
10.46 |
ca_rag_latency |
Context-aware RAG processing time |
9.29 |
decode_latency |
Video decode time across all chunks |
8.94 |
vlm_latency |
Pure VLM inference time |
8.42 |
req_start_time |
Request start timestamp (Unix epoch) |
1751909395.34 |
Token Usage & Processing
Metric Name |
Description |
Example Value |
|---|---|---|
total_vlm_input_tokens |
Total tokens sent to VLM |
12012 |
total_vlm_output_tokens |
Total tokens generated by VLM |
223 |
pending_add_doc_latency |
Time waiting for document additions |
0 |
pending_doc_start_time |
Document processing start time |
0 |
pending_doc_end_time |
Document processing end time |
0 |
Generated Files
Metric Name |
Description |
Example Value |
|---|---|---|
health_graph_paths |
List of generated CSV files |
[“/tmp/via-logs/…csv”] |
health_graph_plot_paths |
List of generated PNG visualization files |
[“/tmp/via-logs/…png”] |
Per-Chunk Detailed Timing
The all_times array contains detailed timing for each chunk:
Metric Name |
Description |
Example Value |
|---|---|---|
chunk_id |
Chunk identifier (0-based) |
0, 1, 2, … |
decode_start/end |
Chunk decode timing timestamps |
1751909395.36/1751909397.38 |
vlm_start/end |
VLM processing timing for chunk |
1751909397.38/1751909398.50 |
add_doc_start/end |
Document addition timing |
1751909398.50/1751909398.50 |
vlm_stats |
Token counts for specific chunk |
{“input_tokens”: 2002, “output_tokens”: 22} |
Sample GPU Usage Plots
Troubleshooting#
Container Access Issues#
Ensure the Docker container is running:
docker psCheck container logs for errors:
docker logs <container_name>Verify container has sufficient disk space for log files
Missing Log Files#
Confirm
ENABLE_VIA_HEALTH_EVAL=truewas set before runningCheck that the summarize() function completed successfully in the console logs
Verify the correct path:
/tmp/via-logs/within the container
Performance Impact#
If health evaluation significantly impacts performance, consider running separate dedicated profiling sessions
Monitor system resources during evaluation-enabled runs
For additional support or questions about VSS pipeline performance evaluation, refer to the main VSS documentation or contact the development team.
For Helm Deployments#
Ensure the following environment variables are set in the overrides file:
vss:
  applicationSpecs:
    vss-deployment:
      containers:
        vss:
          env:
            - name: ENABLE_VIA_HEALTH_EVAL
            value: "true"

            - name: VIA_ENABLE_OTEL
            value: "true" # if you want to have OTEL traces in the logs as well

            - name: VIA_OTEL_EXPORTER
            value: "otlp"

            - name: VIA_OTEL_ENDPOINT
            value: "http://otel-collector:4318"
Note that while the otel-collector and Jaeger services won’t be deployed with Helm, you can set up your own services to use the endpoint.
The health evaluation logs will need to be copied using kubectl or helm commands.