FAQ#
Overview#
This page contains frequently asked questions and answers to those questions. In some cases, steps for debugging and solving issues are provided. Any questions that are not addressed on this page or Known Issues can be brought up on the official forum.
Prerequisite FAQs
Deployment FAQs
Prerequisite FAQs#
Failed to fetch blueprint: 403 Forbidden#
Error |
|
This can occur for multiple reasons, most commonly:
The account does not have VSS EA enablement
The wrong NGC API key was used
To debug this issue, ensure you followed the steps for setting up a new account with EA enablement:
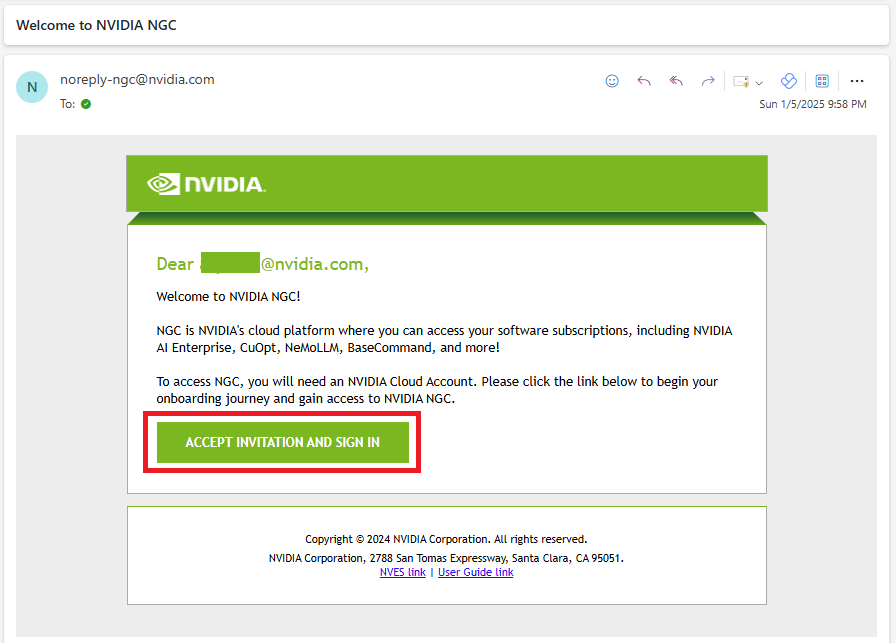
When you were approved into the program, you received two emails: 1) Confirming your acceptance into the VSS EA program and 2) “Welcome to NVIDIA NGC”.
Click on the link in the “Welcome to NVIDIA NGC” email.
Note
If you get an
INVALID_REQUESTstatus when clicking on the link, that means you have already created a new NGC account with enablement and must select that account when logging in.After clicking the link, you are brought to an accounts page where you must select Create New NVIDIA Cloud Account, as this specific Cloud Account will be the one with the VSS EA enablement. Do not click an existing account!
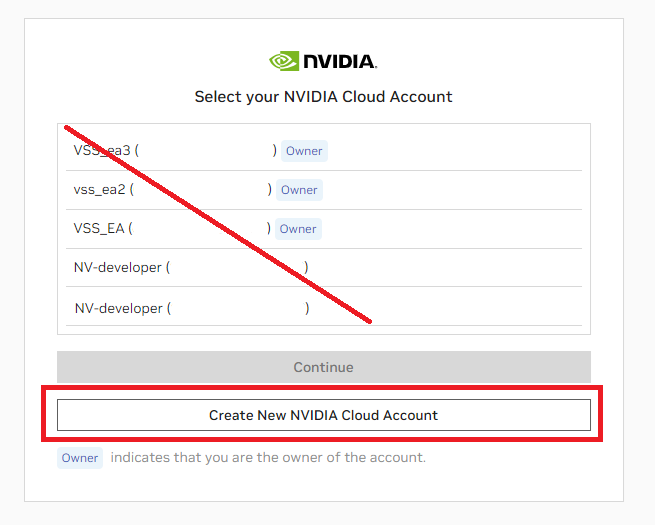
Note
If you click on an existing account with “owner” access, you will get an
INTERNAL_ERROR.Select a distinct name for your cloud account that will be associated with your VSS enablement.
You should now be able to follow the steps to Obtain NGC API Key.
If you followed the above steps and still receive the 403 Forbidden error, check that:
You have the correct Organization and Team selected in the top right.
The selected Organization and Team has the NVIDIA VSS Early Access subscription and it is active ( Organization > Subscriptions )
1-click deploy package deploy-aws-cns.tar.gz untar failure#
Error |
|
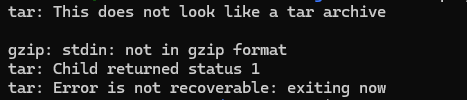
This can occur for multiple reasons, most commonly:
The tar file was not downloaded correctly
The tar file is corrupted
The token used to download the file does not have the necessary permissions
If you do not have access to NGC org: nvidia, teams: blueprint, the download succeeds, but the untar step will fail.
To debug this issue, ensure that you have access to:
NGC org: nvidia
teams: blueprint
Deployment FAQs#
How do I monitor progress of VSS Helm chart deployment?#
Use microk8s kubectl get po -A and microk8s kubectl describe po commands to observe progress of VSS deployment.
Check Default Deployment Topology and Models in Use to observe the names of pods involved in VSS deployment.
You can use microk8s kubectl describe po POD_NAME to individually check status while its initializing for each pod.
The unique Pod name can be found using microk8s kubectl get po -A.
What are some of the common errors users might encounter trying to deploy VSS?#
Insufficient VRAM on deployment GPUs or insufficient CPU RAM.
Check Prerequisites Overview for more info on exact memory requirement.
OpenAI API Key not having GPT-4o model access.
Make sure you have access to GPT-4o model API endpoint at https://platform.openai.com/apps.
Make sure you have enough credits available at Settings > Usage and be educated on rate limits at Settings > Limits. https://platform.openai.com/settings/organization/usage
Incorrect version of NVIDIA Drivers.
Check Prerequisites Overview for more info on exact NVIDIA driver requirement and link to download driver.
GPU operator issues were observed with newer driver versions.
GPU Operator: NVIDIA CUDA validator error: Failed to allocate device vector
sudo microk8s kubectl logs -n gpu-operator-resources nvidia-cuda-validator-* -c cuda-validation
Failed to allocate device vector A (error code system not yet initialized)!
[Vector addition of 50000 elements]
User might need to manually install NVIDIA fabric manager. This is documented in Install the NVIDIA Fabric Manager.
Note
Re-run gpu operator with sudo microk8s enable nvidia force-system-driver
to solve this issue if it persist after installing NVIDIA fabric manager.
Invalid access to NGC.
Make sure you provide valid NGC API Key by setting up secrets as mentioned in Create Required Secrets.
Use microk8s kubectl get po -A and microk8s kubectl describe po commands to observe progress of VSS deployment.
Live (RTSP) stream connect error#
Potential error users can encounter in VSS when trying to connect RTSP stream:
ERROR Could not connect to the RTSP URL or there is no video stream from the RTSP URL.
This can be a network access issue.
The RTSP server might not be accessible from inside the VSS container running in k8s.
To debug and confirm RTSP server is accessible from inside the k8s environment:
Launch a ubuntu pod in k8s OR use VSS container
#this will start a ubuntu container in k8s and exec into
sudo microk8s kubectl run ubuntu-debug --image=ubuntu --restart=Never -i --tty -- /bin/bash
Install ffprobe and ffprobe <rtsp>.
#Then install ffprobe and try connecting to the camera from inside the container
apt-get update
apt-get install -y ffmpeg
ffprobe <camera_rtsp_stream_url>
This command will attempt to connect to the camera and provide information about the stream.
3. If step (2) prints relevant stream information, it confirms necessary permissions and network access to connect to the camera from within the container. Otherwise, check for potential issues like network connectivity, firewall settings including: RTSP URL format, server status, codec support, DNS resolution, container permissions, server load.
Where to obtain VSS logs?#
VSS logs are written to the /tmp/via-logs/ directory inside the running VSS container in the pod: vss-vss-deployment-*.
Refer to VSS Observability for more information on VSS observability.
Why do I obtain VSS deployment pod restart?#
If for any reason VSS pod errors out, it restarts and tries to self correct.
One reason for this is an LLM Exception error showing VSS exceeded max-retries internally trying to connect to the LLM pod.
More details on this in Known Issues.
If this happens, wait for an additional few minutes and observe if a restart fixes the issue.
You can monitor this using sudo watch microk8s kubectl get pod.
Why do I observe “CUDA out of memory” while running summarization?#
This can happen if the GPU does not have enough memory to run the summarization.
The VLM_BATCH_SIZE is automatically determined based on the available GPU memory if it is not explicitly set. Consider setting a lower VLM_BATCH_SIZE manually on the VSS pod to avoid OOM errors.
Live stream preview is not working / Set-of-Marks preview for files or live-streams is not working#
This requires additional proprietary codecs to be installed in the container. Refer to Custom Container Image with Codecs Installed or Installing additional codecs.
Why do I see “Couldn’t Produce Highlights. Try again.” while generating (scenario) highlights?#
This can happen if the LLM fails to return a valid json response. Retry highlight generation again.
Why do I see “Sorry, I don’t see that in the video.” during QnA?#
This can happen if there is not enough context to answer the question. Users need to fine-tune the prompts. Refer to Tuning Prompts for more details. This could also happen if there are a lot of stale video files and the graph. Verify that you deleted the video file, if you are not using it.
Multiple streams are failing due to OSError: [Errno 28] No space left on device#
This happens because the default shared memory size of the VSS pod is 64MB. To fix this, users need to increase the shared memory size of the VSS pod.
This can be set in the overrides file as shown below:
vss:
 applicationSpecs:
   vss-deployment:
     containers:
       vss:
         volumeMounts:
         - name: shm-volume
            mountPath: /dev/shm

     volumes:
     - name: shm-volume
       emptyDir:
         medium: Memory
         sizeLimit: 500Mi
For the Docker Compose deployment, it can be set in the compose.yaml file as shown below:
services:
   via-server:
   shm_size: 500mb
When triggering summarization for a large number of files back to back, I see VSS pod restarts or connection errors.#
This can happen if Guardrails takes longer time to validate the summarization request.
To fix this, users can either increase the VSS pod probe timeouts as shown below or Disable Guardrails if not required.
sudo microk8s helm install ... \
    --set "vss.applicationSpecs.vss-deployment.containers.vss.livenessProbe.timeoutSeconds=5" \
    --set "vss.applicationSpecs.vss-deployment.containers.vss.readinessProbe.timeoutSeconds=5"
When using remote endpoints with GraphRAG, I am seeing the Exception: [429] Too Many Requests error:#
Error |
|
This can happen if the remote endpoint is not able to handle the request. You can update the ca_rag_config.yaml file to limit the number of requests in parallel to the remote endpoint:
functions:
   retriever_function:
      type: graph-retrieval
      params:
         embedding_parallel_count: 50
If the error persists, you can try switching to local endpoints. Refer to Local Deployment for more information on local deployment.
How do I view the per-chunk dense captions generated by the VLM?#
There are a few ways to retrieve the per-chunk dense captions generated by the VLM:
Start VSS with VSS_LOG_LEVEL=DEBUG. This will print the per-chunk dense captions in the VSS logs. Look for
VLM response generated forin the logs.Start VSS with CA-RAG disabled. This will disable all RAG features like summarization, alerts and chat. With this, the
/summarizeAPI will return the per-chunk dense captions instead of the summary. For the Gradio UI, make sure to uncheck the Enable Chat checkbox. For API usage, make sure to use the streaming mode.Start VSS with Health Evaluation enabled. For each summarize request, a file
/tmp/via-logs/vlm_testdata_<request-id>.txtcontaining the per-chunk dense captions will be created inside the VSS container.
How do I setup a sample RTSP stream to test with VSS?#
A sample RTSP stream can be created from a video file using cvlc using the following command:
sudo apt install -y vlc
cvlc --loop <video-file> ":sout=#gather:rtp{sdp=rtsp://:8554/file-stream}" :network-caching=1500 :sout-all :sout-keep
This will start the RTSP stream on rtsp://<NODE_IP>:8554/file-stream.
Note
VLC supports only UDP protocol for RTSP streaming. UDP might not work if the VLC server is started on another node than the VSS pod. It is recommended to start VLC server on the same node as the VSS pod.
When do I need NVIDIA Fabric Manager in the deployment nodes?#
When REQUIRED: NVSwitch-Based Systems
Fabric Manager is essential for systems using NVSwitch hardware to create a unified memory fabric across multiple GPUs. This applies to:
NVIDIA DGX and HGX server platforms
When NOT Required:
Systems using NVLink bridges without NVSwitches
Single-GPU configurations
Traditional PCIe-connected GPU setups
For non-NVSwitch systems using basic NVLink bridges between GPUs.
More info here.
Local LLM deployment fails with “Detected 0 compatible profile” error#
This can happen if the GPU does not have enough memory to run the LLM or the LLM NIM does not have a compatible profile for the GPU.
To fix this, check list of model profiles supported by the LLM NIM using the “list-model-profiles” command as specified in the LLM NIM utilities documentation.
More information regarding various model profiles can be found in the LLM NIM model profiles documentation.
How do I assign fixed ports to VSS API and UI services for Helm deployment?#
By default, VSS API and UI services are assigned random node ports.
To assign fixed ports, you can pass the following parameters to the Helm install command:
sudo microk8s helm install ... \
    --set-json 'vss.applicationSpecs.vss-deployment.services.vss-service.ports=[{"name":"http-api","port":8000, "nodePort": 31000},{"name":"webui","port":9000, "nodePort": 32000}]'
The VSS API service will be available at http://<NODE_IP>:31000 and the VSS UI service will be available at http://<NODE_IP>:32000.
Why do I get error “Server is already processing maximum number of live streams (256)”?#
By default, VSS is configured to allow only 256 summarization requests to be processed in parallel.
To configure a higher limit:
For Docker Compose deployment, add
VSS_EXTRA_ARGS="--max-live-streams <max-streams>"in the.envfile.For Helm deployment, set
VSS_EXTRA_ARGSto"--max-live-streams <max-streams>"using the overrides file as shown in Configuration Options.
How do I access the database and retrieve information like embedding, offset time and other meta-data?#
There are two ways to access the database:
If you have your own Milvus Vector DB, VSS can be configured to use it by following the steps outlined in External Milvus DB Connection Parameters. This setup gives you full access to the database, allowing you to query and retrieve stored data such as embeddings, dense captions, and additional metadata.
If using the VSS’s deployed GraphDB and MilvusDB, then can expose the DB’s endpoints by updating the Helm chart to
NodePort(steps in Accessing Milvus Vector DB for Milvus. Same can be followed for Neo4J) and this will allow them to access the DB using the node port of the DB services.Example: Accessing Milvus with Python
Install the Milvus Python SDK:
pip install pymilvus
Connect to your Milvus instance:
from pymilvus import MilvusClient

client = MilvusClient(uri="http://<IP>:<PORT>")
Query for data (for example, retrieve embeddings or metadata):
client.list_collections()
client.describe_collection("<collection_name>")
result = client.query(collection_name="<collection_name>", output_fields=["text", "batch_i"], limit=10)
print(result)
Note
You can adjust the
output_fieldsto retrieve other metadata fields as needed.For more advanced queries and usage, refer to the Milvus documentation.
Example: Accessing Neo4J with Python
Install the Neo4j Python:
pip install neo4j
Connect and query the Neo4J instance:
from neo4j import GraphDatabase

uri = "bolt://<IP>:<PORT>"  # Replace with your Neo4j URI
user = "<your username>"    # Replace with your username
password = "<your password>" # Replace with your password

driver = GraphDatabase.driver(uri, auth=(user, password))

def get_captions_and_metadata(tx):
    query = """
    MATCH (n:Chunk)
    RETURN n.text
    LIMIT 5
    """
    return list(tx.run(query))

with driver.session() as session:
    results = session.read_transaction(get_captions_and_metadata)
    for record in results:
        print(record)
Can we retrieve the original detailed caption for each chunk from the database (vector and graph)?#
Yes, we store the original detailed caption in both the vector and graph db. The stored detailed captions can be extracted by following the steps in the How do I access the database and retrieve information like embedding, offset time and other meta-data? section.
What information is being stored in the knowledge graph?#
After chunking the video, we perform knowledge graph extraction on the dense captions of the video chunks. The Knowledge Graph created is a hybrid graph, which is both content-centric and entity centric.
Content-centric: The Knowledge Graph contains the nodes for the dense captions for chunks and has relationships between these chunks such as SIMILAR and NEXT. Entity-centric: We further extract entities from the dense captions and add them as nodes to the graph and add relationships between the content nodes and other entities.
We also create a vector index of the dense captions, which are stored in the metadata.
This hybrid graph is used to answer user’s questions by performing various retrieval techniques such as vector similarity, graph traversal and metadata filtering.
How can I configure VSS to connect to an existing Milvus DB?#
VSS can be configured to connect to an existing Milvus DB with the following steps:
For Docker Compose deployment, refer to External Milvus DB Connection Parameters.
For Helm deployment,
Extract the Helm chart tgz file
tar -xzf nvidia-blueprint-vss-2.4.1.tgz
Remove Milvus DB deployment from the Helm chart
Remove the following directories from
nvidia-blueprint-vss/charts/:rm -rf nvidia-blueprint-vss/charts/{etcd,milvus,minio}
Remove the following lines from
nvidia-blueprint-vss/Chart.yaml:- name: etcd repository: "" version: 2.1.0 - name: minio repository: "" version: 2.1.0 - name: milvus repository: "" version: 2.1.0
Update the
nvidia-blueprint-vss/values.yamlto point the init container to the external Milvus DB:# Find below line and replace with the external Milvus DB connection parameters until nc -z -w 2 milvus-milvus-deployment-milvus-service 19530; do echo
Note
Update the line in the overrides file as well, in case it is added in the overrides, for example for single GPU deployment.
Repackage the Helm chart
tar -czf nvidia-blueprint-vss-2.4.1.tgz nvidia-blueprint-vss
Update the Milvus DB connection parameters
We need to override the milvus db connection parameters for CA-RAG config in the overrides.yaml to point to the external Milvus DB.
vss:
   configs:
      ca_rag_config.yaml:
         tools:
            vector_db:
               params:
                  host: <external-milvus-db-host>
                  port: <external-milvus-db-port>
         functions:
            ingestion_function:
               type: vector_ingestion
               tools:
                  db: vector_db
            retriever_function:
               type: vector_retrieval
               tools:
                  db: vector_db
Install the Helm chart
Follow the steps in Configuration Options to install the blueprint with the overrides.
Deployment on NVIDIA Jetson Thor results in Out of Memory error#
Make sure that the cache cleaner script from the [VSS repository](NVIDIA-AI-Blueprints/video-search-and-summarization) is running.
sudo sh deploy/scripts/sys_cache_cleaner.sh # Add " &" to run it in the background.
Neo4j Transaction Commit Failure#
Neo.DatabaseError.Transaction.TransactionCommitFailed
Cause: Either Neo4j container/pod crashed or storage space is insufficient for Neo4j to commit transactions to the database store (~95% full).
Solution:
Restart Neo4j container/pod
Free up disk space
Elasticsearch High Disk Watermark 90%#
Elasticsearch might fail when storage reaches approximately 90% capacity.
Cause: Elasticsearch has built-in disk-based shard allocation settings that prevent operations when disk usage is too high.
Solution:
Free up disk space
Errors are seen loading engine files during VSS startup or during processing of a video#
This can be caused by having stale files in the model cache directory from deployment of older versions of VSS.
Make sure to delete the VSS model cache directory before starting VSS deployment.
Note
This will also delete any downloaded models in the cache directory.
For Helm deployment,
sudo microk8s kubectl get pvc # list the PVCs
sudo microk8s kubectl delete pvc vss-ngc-model-cache-pvc # Update PVC name if different
For Docker Compose deployment,
docker volume ls # list the volumes
docker volume rm <via-ngc-model-cache> # Update volume name
Summarize / chat API call fails with a queue.get() timeout error / queue.Empty Exception#
This could be because of CA-RAG calls timing out because of high LLM workload. Try increasing the CONTEXT_MANAGER_CALL_TIMEOUT.