Engine Tools and Debugging#
This page covers tools for examining and debugging TensorRT engines, including the Engine Inspector API, optimizer callbacks, preview features, and debug tensors.
Engine Inspector#
TensorRT provides the IEngineInspector API to inspect the information inside a TensorRT engine. Call the createEngineInspector() from a deserialized engine to create an engine inspector, and then call getLayerInformation() or getEngineInformation() inspector APIs to get the information of a specific layer in the engine or the entire engine, respectively. You can print out the information of the first layer of the given engine, as well as the overall information of the engine, as follows:
1auto inspector = std::unique_ptr<IEngineInspector>(engine->createEngineInspector());
2
3std::cout << inspector->getLayerInformation(0, LayerInformationFormat::kJSON); // Print the information of the first layer in the engine.
4std::cout << inspector->getEngineInformation(LayerInformationFormat::kJSON); // Print the information of the entire engine.
1inspector = engine.create_engine_inspector()
2print(inspector.get_layer_information(0, LayerInformationFormat.JSON)) # Print the information of the first layer in the engine.
3print(inspector.get_engine_information(LayerInformationFormat.JSON)) # Print the information of the entire engine.
Note that the level of detail in the engine/layer information depends on the ProfilingVerbosity builder config setting when the engine is built. By default, ProfilingVerbosity is set to kLAYER_NAMES_ONLY, so only the layer names will be printed. If ProfilingVerbosity is set to kNONE, then no information will be printed; if it is set to kDETAILED, then detailed information will be printed.
Below are some examples of layer information printed by getLayerInformation() API depending on the ProfilingVerbosity setting:
1"__mye15868_conv_act_pool_myl0_2"
Detailed layer JSON example
  {
      "Name": "__mye15868_conv_act_pool_myl0_2",
     "LayerType": "conv_act_pool",
    "Inputs": [
    {
        "Name": "__mye18111__mye18121_2_myl0",
        "Dimensions": [1,3,224,224],
        "Strides": [150528,50176,224,1],
        "StrideOrder": [3,2,1,0],
        "Datatype": "Int8",
        "Format": "(Linear) Row major linear format"
    }],
    "Constants": [
    {
        "Name": "__mye15805_dconst_myl0",
        "Dimensions": [64,3,7,7],
        "Strides": [147,49,7,1],
        "StrideOrder": [3,2,1,0],
        "Datatype": "Int8",
        "Format": "(Linear) Row major linear format"
    },
    {
        "Name": "__mye15854_dconst_myl0",
        "Dimensions": [1,64,1,1],
        "Strides": [64,1,1,1],
        "StrideOrder": [3,2,1,0],
        "Datatype": "Float",
        "Format": "(Linear) Row major linear format"
    },
    {
        "Name": "__mye15861_dconst_myl0",
        "Dimensions": [1,64,1,1],
        "Strides": [64,1,1,1],
        "StrideOrder": [3,2,1,0],
        "Datatype": "Float",
        "Format": "(Linear) Row major linear format"
    }],
    "Outputs": [
    {
        "Name": "__mye18111_myl0",
        "Dimensions": [1,64,56,56],
        "Strides": [200704,3136,56,1],
        "StrideOrder": [3,2,1,0],
        "Datatype": "Int8",
        "Format": "(NC/32HW32) Thirty-two wide channel vectorized format"
    }],
    "TacticName": "sm80_trt_conv_act_pool_v3_tile_rows_8_tile_cols_120",
    "StreamId": 0,
    "Metadata": "[ONNX Layer: Conv_12]\u001f[ONNX Layer: DequantizeLinear_5]\u001f[ONNX Layer: DequantizeLinear_11]\u001f[ONNX Layer: QuantizeLinear_62]\u001f[ONNX Layer: Relu_14]\u001f[ONNX Layer: QuantizeLinear_8]\u001f[ONNX Layer: MaxPool_15]"
}
In addition, when the engine is built with dynamic shapes, the dynamic dimensions in the engine information will be shown as -1, and the tensor format information will not be shown because these fields depend on the actual shape at the inference phase.
The trtexec tool provides the --profilingVerbosity, --dumpLayerInfo, and --exportLayerInfo flags for getting engine information for a given engine. Refer to the trtexec section for more details.
Currently, I/O tensor information and layer information, including the dimensions of the intermediate tensors, precisions, formats, tactic indices, layer types, and layer parameters, are included in the engine information. In future TensorRT versions, more information can be added to the engine inspector output as new keys in the output JSON object. More specifications about the keys and the fields in the inspector output will also be provided.
Engine graph visualization with Nsight Deep Learning Designer
When detailed TensorRT engine layer information is exported to a JSON file with the --exportLayerInfo option, the engine’s computation graph can be visualized with Nsight Deep Learning Designer. Open the application, and from the File menu, select Open File, then choose the .trt.json file containing the exported metadata.
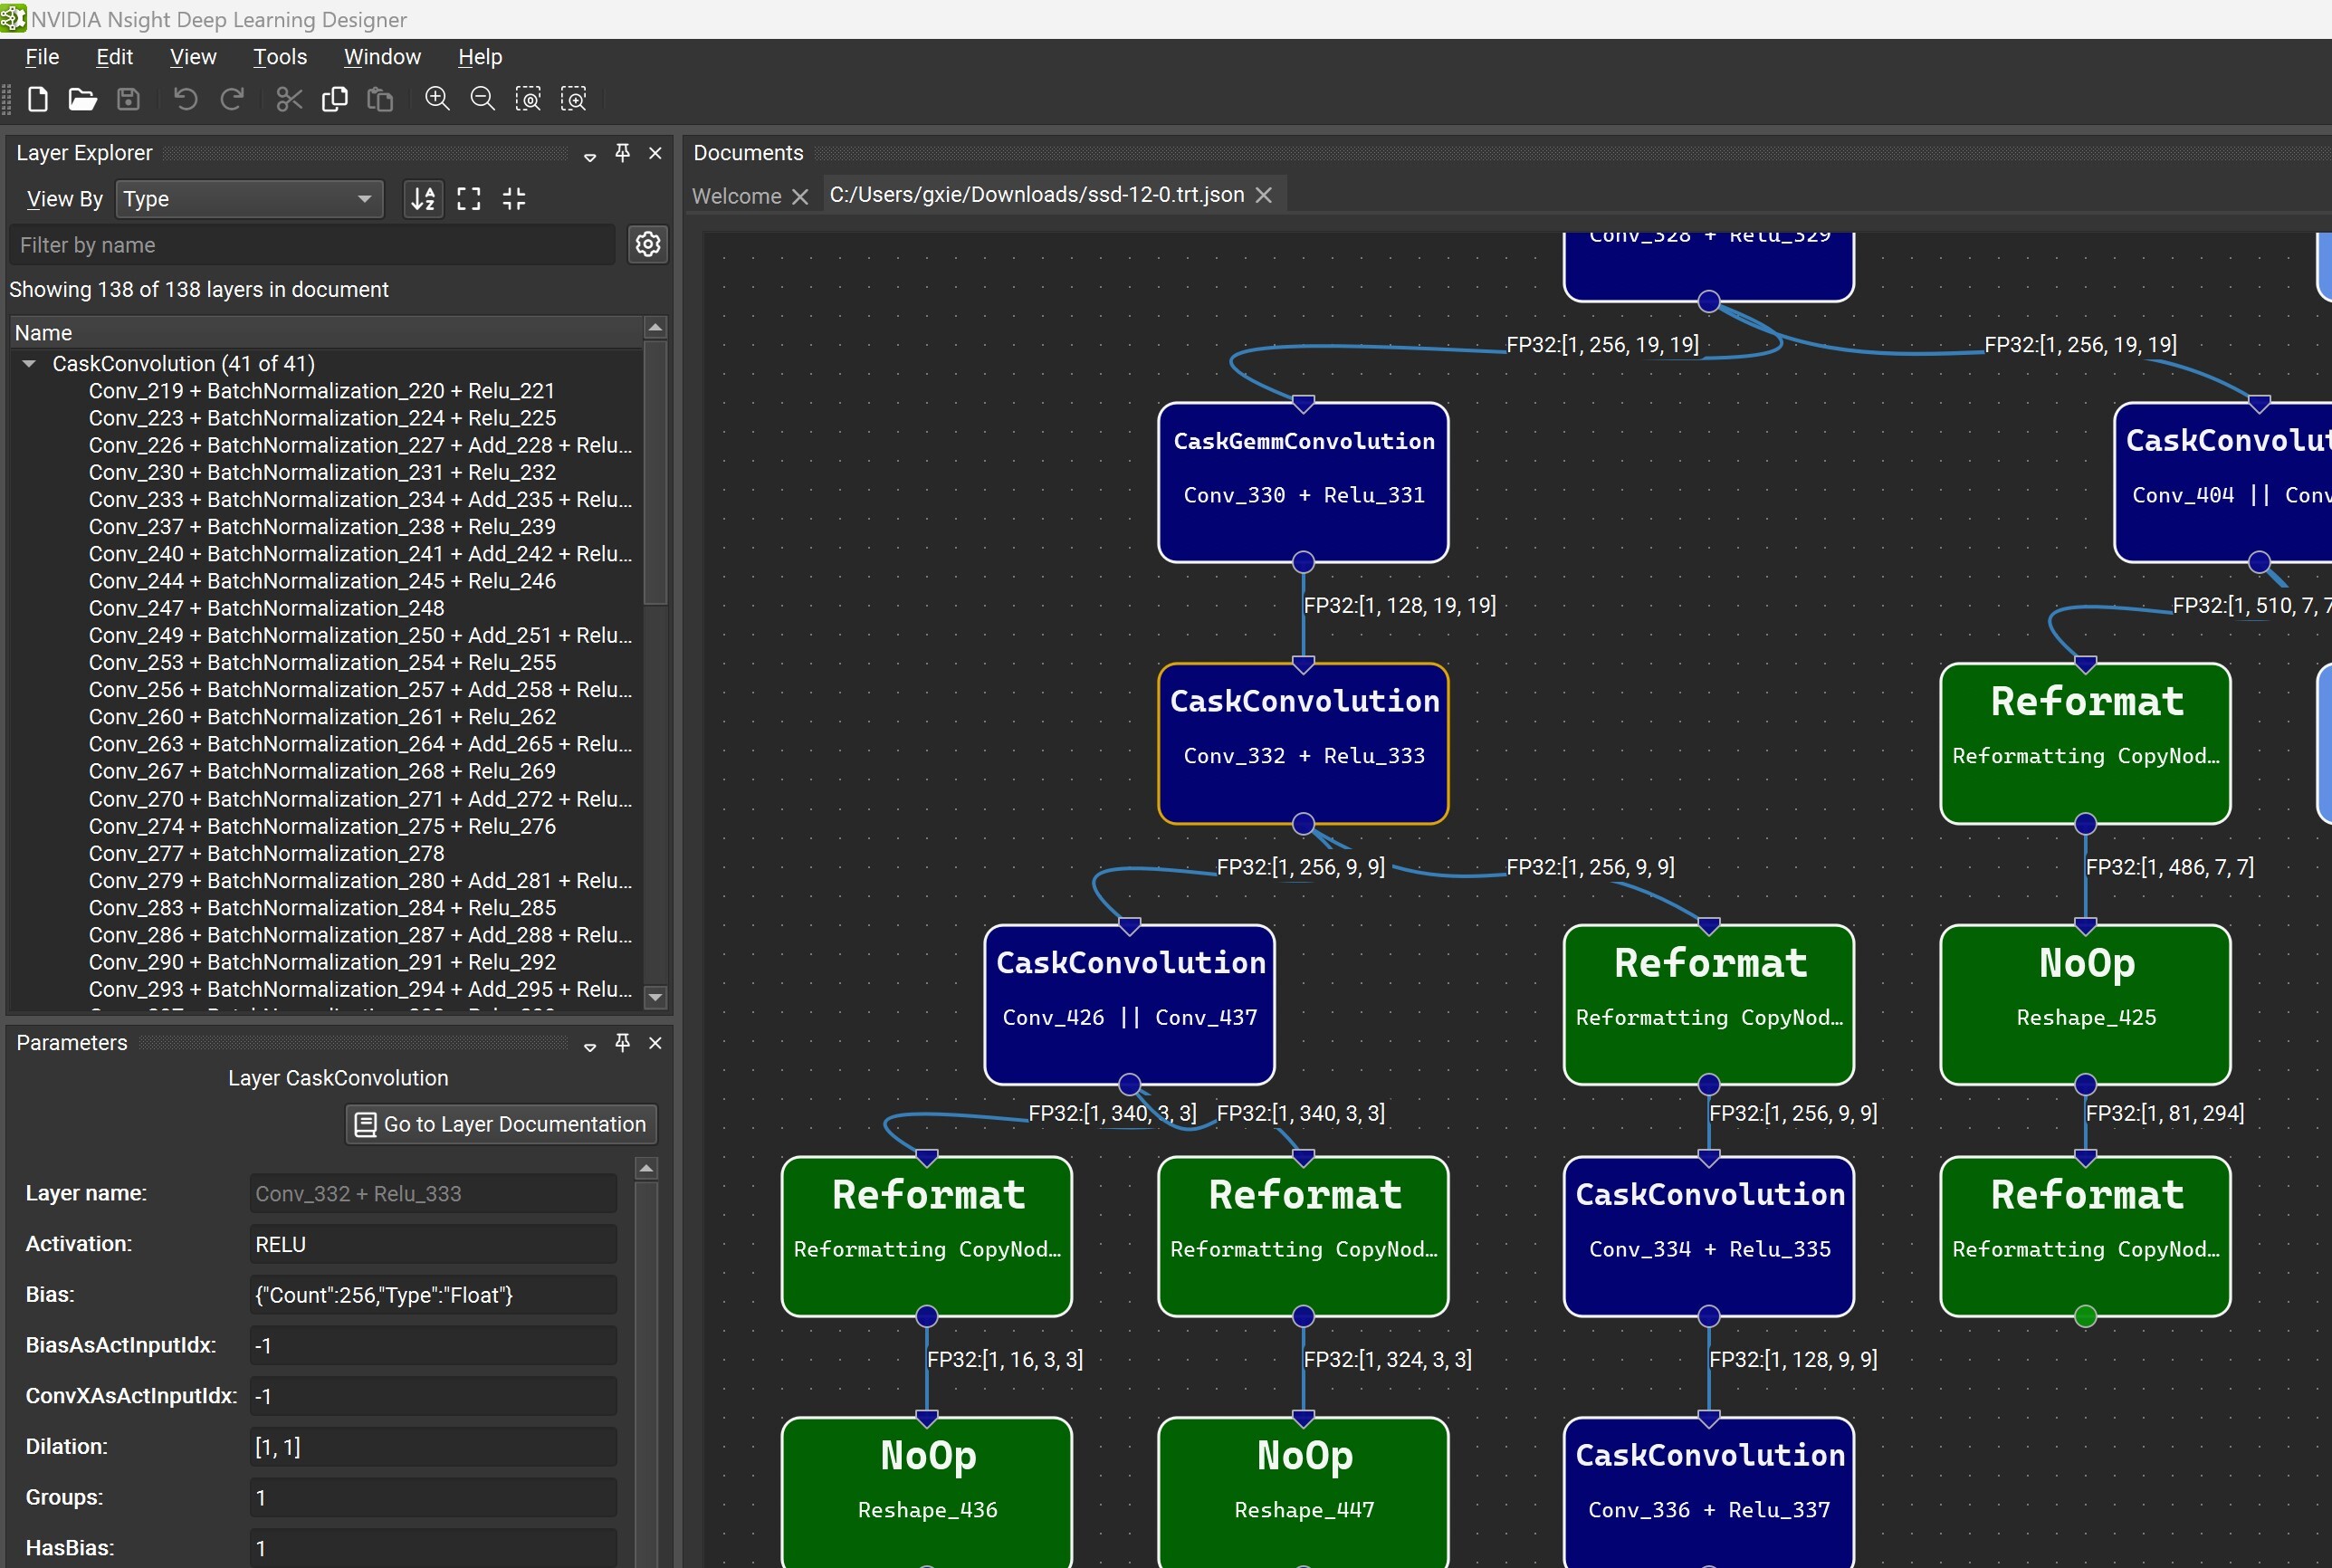
The Layer Explorer window allows you to search for a particular layer or explore the layers in the network. The Parameter Editor window lets you view the selected layer’s metadata.
Optimizer Callbacks#
The optimizer callback API feature allows you to monitor the progress of the TensorRT build process, such as to provide user feedback in interactive applications. To enable progress monitoring, create an object that implements the IProgressMonitor interface, then attach it to the IBuilderConfig, for example:
1builderConfig->setProgressMonitor(&monitor);
1builder_config.progress_monitor = monitor
Optimization is divided into hierarchically nested phases, each consisting of several steps. At the start of each phase, the phaseStart() method of IProgressMonitor is called, telling you the phase name and how many steps it has. The stepComplete() function is called when each step completes, and phaseFinish() is called when the phase finishes.
Returning false from stepComplete() cleanly forces the build to terminate early.
Preview Features#
The preview feature API is an extension of IBuilderConfig that allows the gradual introduction of new features to TensorRT. Selected new features are exposed under this API, allowing you to opt in or out. A preview feature remains in preview status for one or two TensorRT release cycles and is then either integrated as a mainstream feature or dropped. When a preview feature is fully integrated into TensorRT, it is no longer controllable through the preview API.
Preview features are defined using a 32-bit PreviewFeature enumeration. The feature name and the TensorRT version concatenate feature identifiers.
<FEATURE_NAME>_XXYY
XX and YY are the major and minor versions of the TensorRT release, respectively, which first introduced the feature. The major and minor versions are specified using two digits with leading-zero padding when necessary.
Suppose the semantics of a preview feature change from one TensorRT release to another. In that case, the older preview feature is deprecated, and the revised feature is assigned a new enumeration value and name.
Deprecated preview features are marked per the deprecation policy.
For more information about the C++ API, refer to nvinfer1::PreviewFeature, IBuilderConfig::setPreviewFeature, and IBuilderConfig::getPreviewFeature.
The Python API has similar semantics using the PreviewFeature enum set_preview_feature and get_preview_feature functions.
Debug Tensors#
The debug tensor feature allows you to inspect intermediate tensors as the network executes. There are a few key differences between using debug tensors and marking all required tensors as outputs:
Marking all tensors as outputs requires you to provide memory to store tensors in advance, while debug tensors can be turned off during runtime if unneeded.
When debug tensors are turned off, the performance impact on the execution of the network is minimized.
For a debug tensor in a loop, values are emitted every time it is written.
To enable this feature, at build time, we need to mark tensors as debug tensors, and at runtime, register a DebugListener to process the tensor data and enable debugging.
Mark debug tensors prior to network compilation during the build time. There are two methods to mark debug tensors:
The first method is marking all unfused tensors as debug tensors.
1networkDefinition->markUnfusedTensorsAsDebugTensors();
1network.mark_unfused_tensors_as_debug_tensors();
This method does not prevent the optimizer from performing fusion and preserves performance. It can remain enabled to help debugging, unless there are concerns about potential data leakage in production.
Note
Some unfused tensors cannot be marked for now.
The second method is marking the specific tensors as debug tensors.
1networkDefinition->markDebug(&tensor);
1network.mark_debug(tensor)
This method can disable some fusion optimizations that would otherwise remove the debug tensors, thereby preserving them for issue diagnosis at the expense of reduced performance.
At runtime, define a
DebugListenerclass deriving fromIDebugListenerand implement the virtual function for processing the tensor.1 virtual void processDebugTensor( 2 void const* addr, 3 TensorLocation location, 4 DataType type, 5 Dims const& shape, 6 char const* name, 7 cudaStream_t stream) = 0;
1process_debug_tensor(self, addr, location, type, shape, name, stream)
When the function is invoked during execution, the debug tensor is passed through the parameters:
location: TensorLocation of the tensor. For unfused tensors marked, this will always be kHOST.
addr: pointer to buffer.
type: data type of the tensor.
shape: shape of the tensor
name: name of the tensor. For unfused tensor dump, this name is internal and inconsistent with the Engine Inspector. For tensors marked by markDebug(), this is the name of tensors in INetwork.
stream: CUDA stream object
The data is stored in linear format. 4-bit data, such as kINT4, is stored by packing two elements into one byte.
Because the function is executed as part of
enqueue(), you must use the stream to synchronize the data reading by, such as invoking a device function on the stream to process or copy the data.After defining the listener, attach it to
IExecutionContext.1executionContext->setDebugListener(&debugListener);
1execution_context.set_debug_listener(debugListener)
Set the debug state for the tensors of interest before the engine’s execution to enable listening.
1executionContext->setTensorDebugState(tensorName, flag);
2executionContext->setUnfusedTensorsDebugState(flag);
3executionContext->setAllTensorsDebugState(flag);
1execution_context.set_debug_state(tensorName, flag)
2execution_context.unfused_tensors_debug_state = flag
3execution_context.set_all_tensors_debug_state(flag)
The trtexec tool provides several command-line flags that allow users to mark debug tensors and dump their data in various formats such as NumPy, string, or raw data. For more information, refer to the trtexec section.