Administrative and Operational Guide for AJR NMC 2.0 Release#
Introduction#
This guide provides detailed instructions for the installation, configuration, monitoring, and upgrading of NMC version 2.0, to ensure smooth operations and effective administration.
Installation Process#
Prerequisites#
The AJR NMC 2.0 release requires several critical prerequisites to be met before installation can begin. These prerequisites ensure that your infrastructure environment is properly prepared and that all necessary components are available. Meeting these requirements is essential for a successful deployment and optimal system performance. The following prerequisites must be satisfied:
Ensure Kubernetes is co-located with a Slurm cluster, both managed by BCM.
Access Token: Obtain an NGC access token to access the home repository and Docker containers.
Installation Wizards: Use BCM wizards for installation. These wizards inject all necessary secrets into Kubernetes for the containers.
Namespace: AJR is installed in the `heimdall` namespace using MySQL provided by BCM.
Configuration#
Proper configuration is fundamental to ensuring AJR operates effectively within your environment. The configuration process involves setting up critical components including network access and integration with external services. These configuration steps must be completed carefully to ensure seamless operation and proper connectivity. AJR needs the following configuration settings to be properly established:
FQDN and Ingress Setup: Properly configure the Fully Qualified Domain Name (FQDN) and ingress. If the FQDN points to the head node and Slurm cluster, dashboards will be accessible through this FQDN.
Certificates: Ensure proper certificates are set up for the ingress, or use a certificate manager.
Shoreline break and fix integration: As part of the BCM wizard installation of AJR, there’s an optional step where Shoreline break and fix can be configured.
Obtain the API token from Shoreline UI (as shown below):
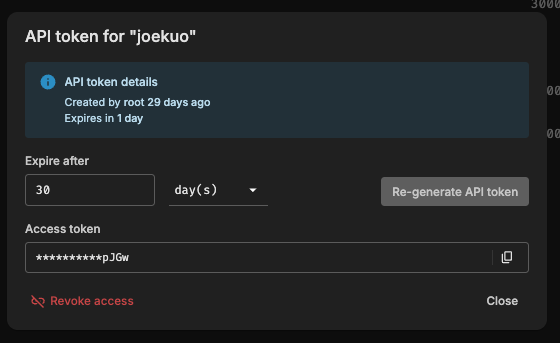
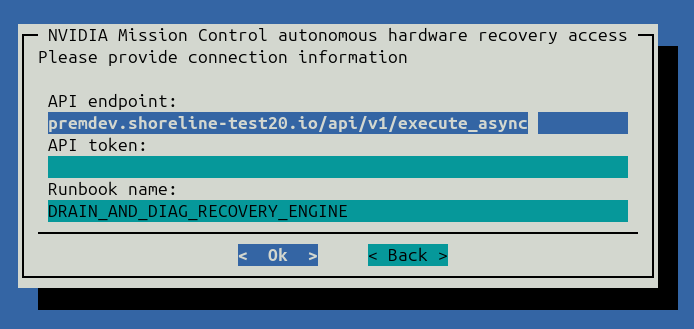
- In the BCM installation wizard, Three fields are required:
API endpoint
API token
runbook name.
The API endpoint and runbook name will be pre-populated with the default value. API token is the one obtained in the last step:
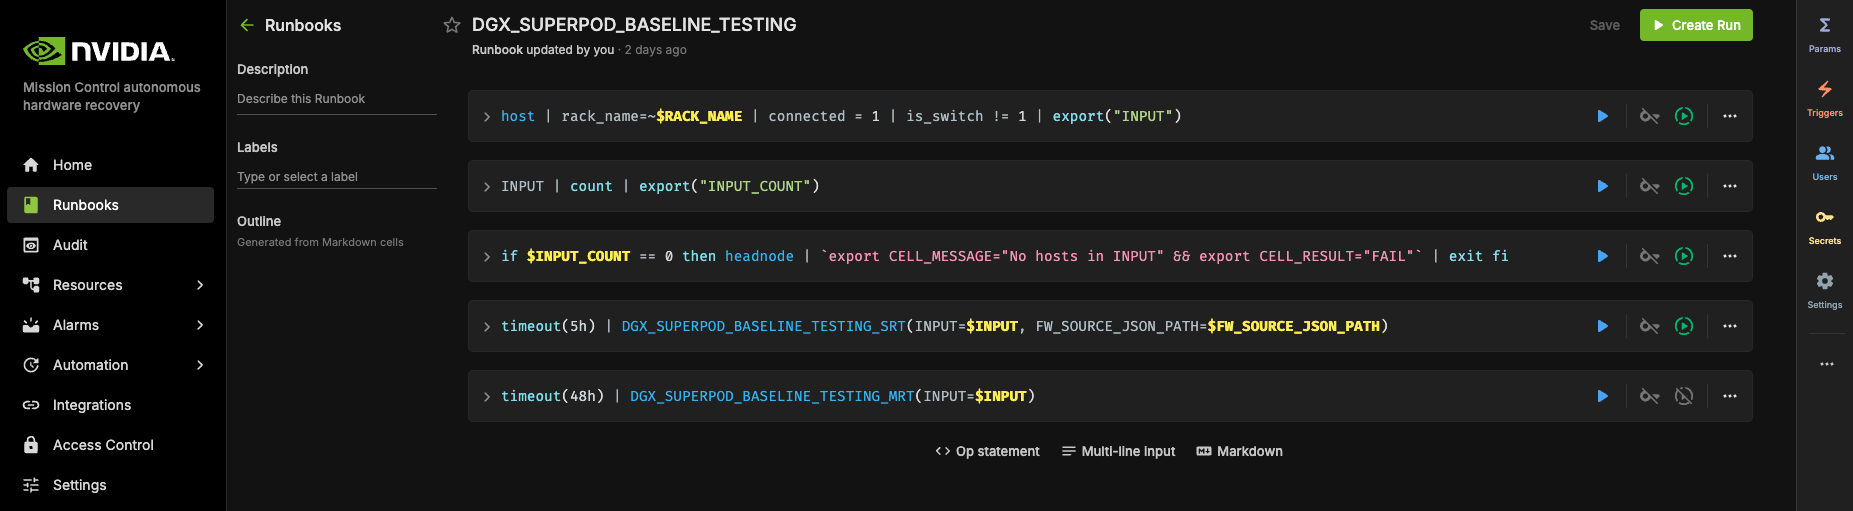
API endpoint: <Insert URL here> (filled by default)API token: <Insert API Token from Shoreline UI here>Runbook name: DRAIN_AND_DIAG_RECOVERY_ENGINE (filled by default)
Accessing Clusters#
NVIDIA internally uses Slurm clusters to launch AI workloads and has a few different Slurm Clusters.
Head Node Access: SSH into the head node with proper access rights. Load Kubernetes and Slurm modules to access the local cluster. Access to the head node needs to be asked in the support Slack channel for the cluster.
Login Node Access: SSH into the login node with proper access rights. This is the node from where users submit jobs to the cluster through Slurm Scheduler.
$ ssh <unix username>@<login node>
Worker Node Access
Once on the login node, you can SSH to the worker nodes using its name. Sometimes SSH to worker nodes is restricted.
For example
$ ssh worker-2
Kubernetes Access: Use `kubectl` commands to manage the Kubernetes cluster where AJR is installed.
Example of AJR pods running in the cluster
kubectl get pods -n heimdall

heimdall-anomaly-detection-isolator-7c5bdc8fd4-kqxzj 1/1 Running 0 11d
heimdall-anomaly-remediation-manager-fd94f9db8-g2ptp 1/1 Running 0 11d
heimdall-attribution-service-68958848bd-45hxr 1/1 Running 0 11d
heimdall-dashboard-7556b6fcfb-9jsvr 1/1 Running 0 11d
heimdall-grafana-64546b66d7-h227j 1/1 Running 0 11d
heimdall-job-manager-764c8d8b87-748mw 1/1 Running 2 (11d ago) 11d
heimdall-job-manager-764c8d8b87-9qtgc 1/1 Running 2 (11d ago) 11d
heimdall-job-manager-764c8d8b87-ddbn7 1/1 Running 1 (11d ago) 11d
heimdall-job-manager-764c8d8b87-kkdtb 1/1 Running 2 (11d ago) 11d
heimdall-job-manager-764c8d8b87-tpq7l 1/1 Running 2 (11d ago) 11d
heimdall-kpis-service-7c54886fb4-cmdp6 1/1 Running 0 11d
heimdall-mysql-0 1/1 Running 0 11d
heimdall-notifications-66cfd95776-fftpb 1/1 Running 0 11d
heimdall-rabbitmq-0 1/1 Running 0 11d
heimdall-watcher-847c68bd56-xr6k2 1/1 Running 0 7d21h
heimdall-workflow-controller-86656fcff8-t9xgk 3/3 Running 24 (17h ago) 11d
Accessing Dashboards#
Dashboard access is crucial for monitoring and managing AJR operations effectively. There are multiple methods available for accessing the various dashboards, depending on your network configuration and security requirements. Understanding these different access patterns will help you choose the most appropriate method for your environment. For accessing AJR dashboards, the following access methods are available:
FQDN Method: If the installation is done with the proper FQDN, dashboards can be accessed through bcm.example.com/heimdall.
SSH and Port Forwarding: If the FQDN is not set up, access the head node/login node using SSH and use port forwarding to access Grafana and other dashboards.
If you are using Grafana cloud, dashboards may also be available on there.
kubectl get svc heimdall-grafana -n heimdall
NAME TYPE CLUSTER-IP EXTERNAL-IP PORT(S) AGE
heimdall-grafana ClusterIP 10.22.148.105 <none> 80/TCP 31d

ssh -L 3000:<grafana k8s service>:80 <unix username>@<login node>
Monitoring and Logs#
Comprehensive monitoring and logging capabilities are essential for maintaining system health and troubleshooting issues. AJR integrates with industry-standard monitoring tools to provide visibility into system performance, job execution, and potential anomalies. These monitoring tools enable administrators to proactively identify and resolve issues before they impact operations. AJR provides the following monitoring tools and log management capabilities:
Grafana Setup: Grafana is installed as part of the stack, with dashboards for various services. Access Grafana using the ingress setup.
Log Explorer: Use the log explorer in Grafana to monitor service logs. Choose the appropriate source (e.g., Grafana NVIDIA logs) to query logs for specific services.
Grafana Cloud Setup#
Grafana Cloud integration offers enhanced monitoring capabilities and centralized dashboard management for AJR deployments. This cloud-based approach provides scalable monitoring infrastructure without the need for local Grafana installations. The cloud setup enables teams to access dashboards and logs from anywhere while maintaining enterprise-grade security and performance. When using Grafana Cloud, the setup offers the following tools and features:
Dashboards: Ensure dashboards for services like ADI, IRM, job manager, KPI service, Watcher, and controller are set up in Grafana Cloud.
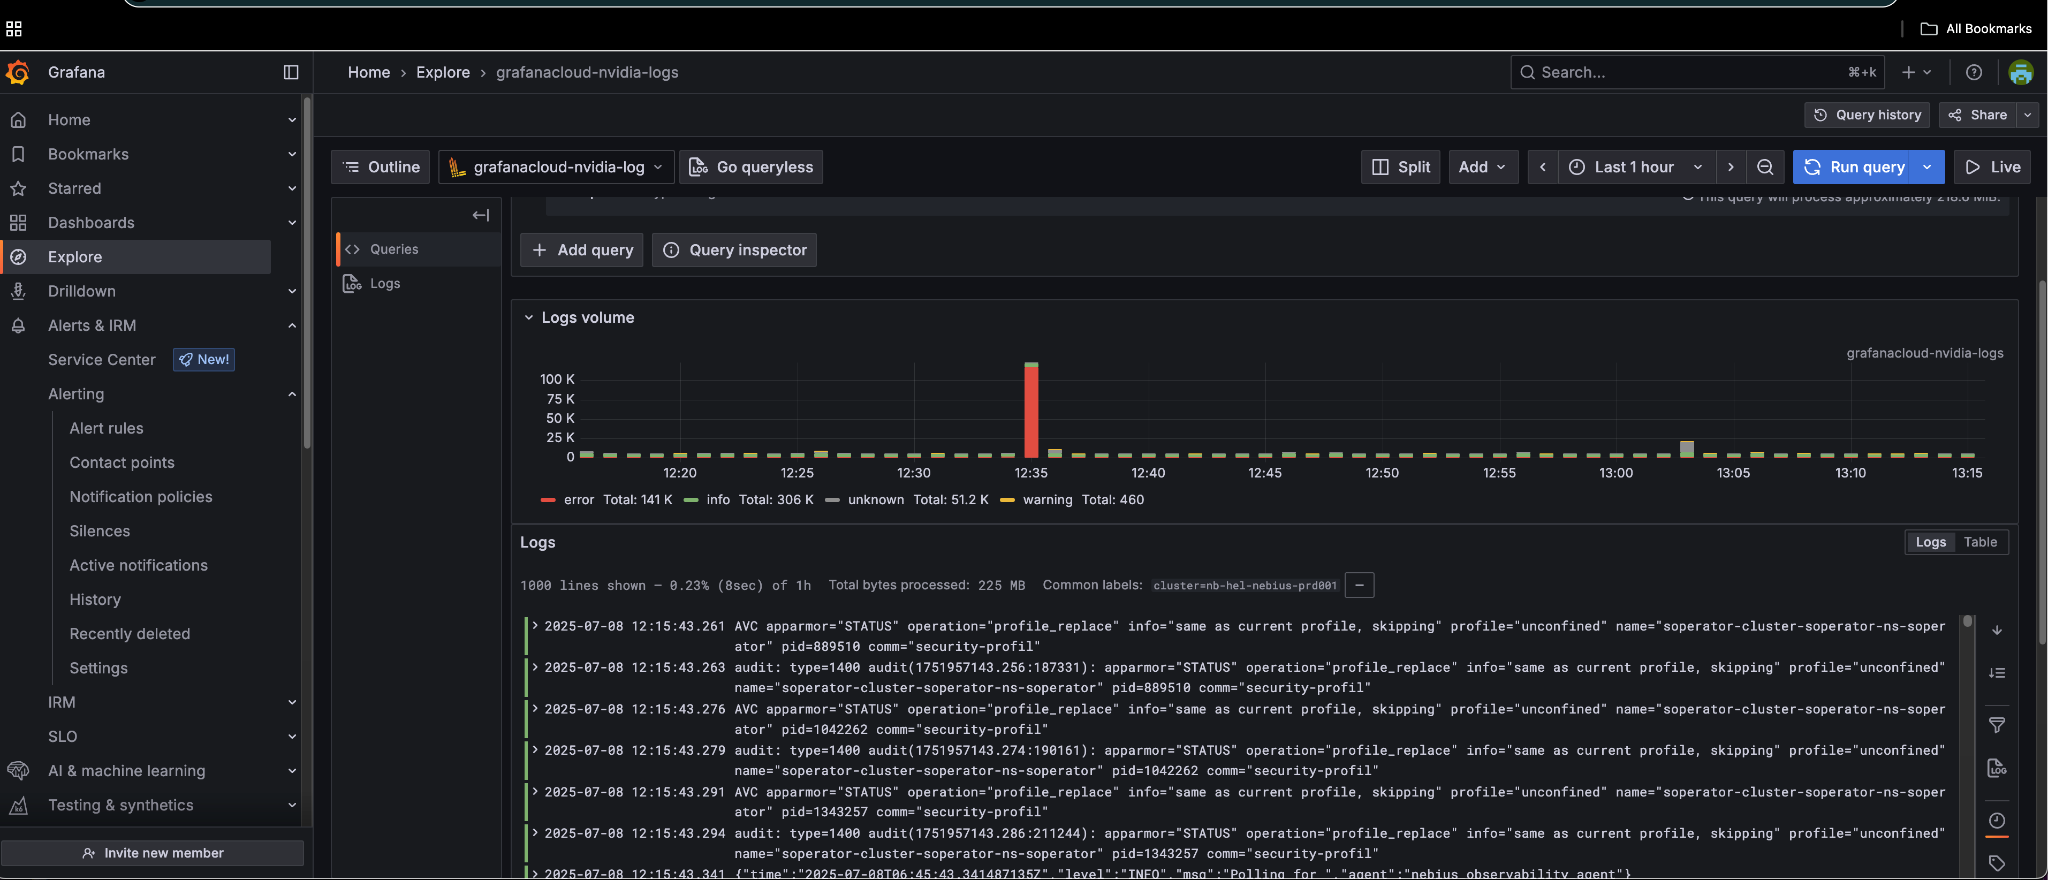
Logs Explorer: Use the logs explorer to monitor service logs and troubleshoot issues.
Job Logs: Jobs logs from customers have a special label appName=slurm-app-log.
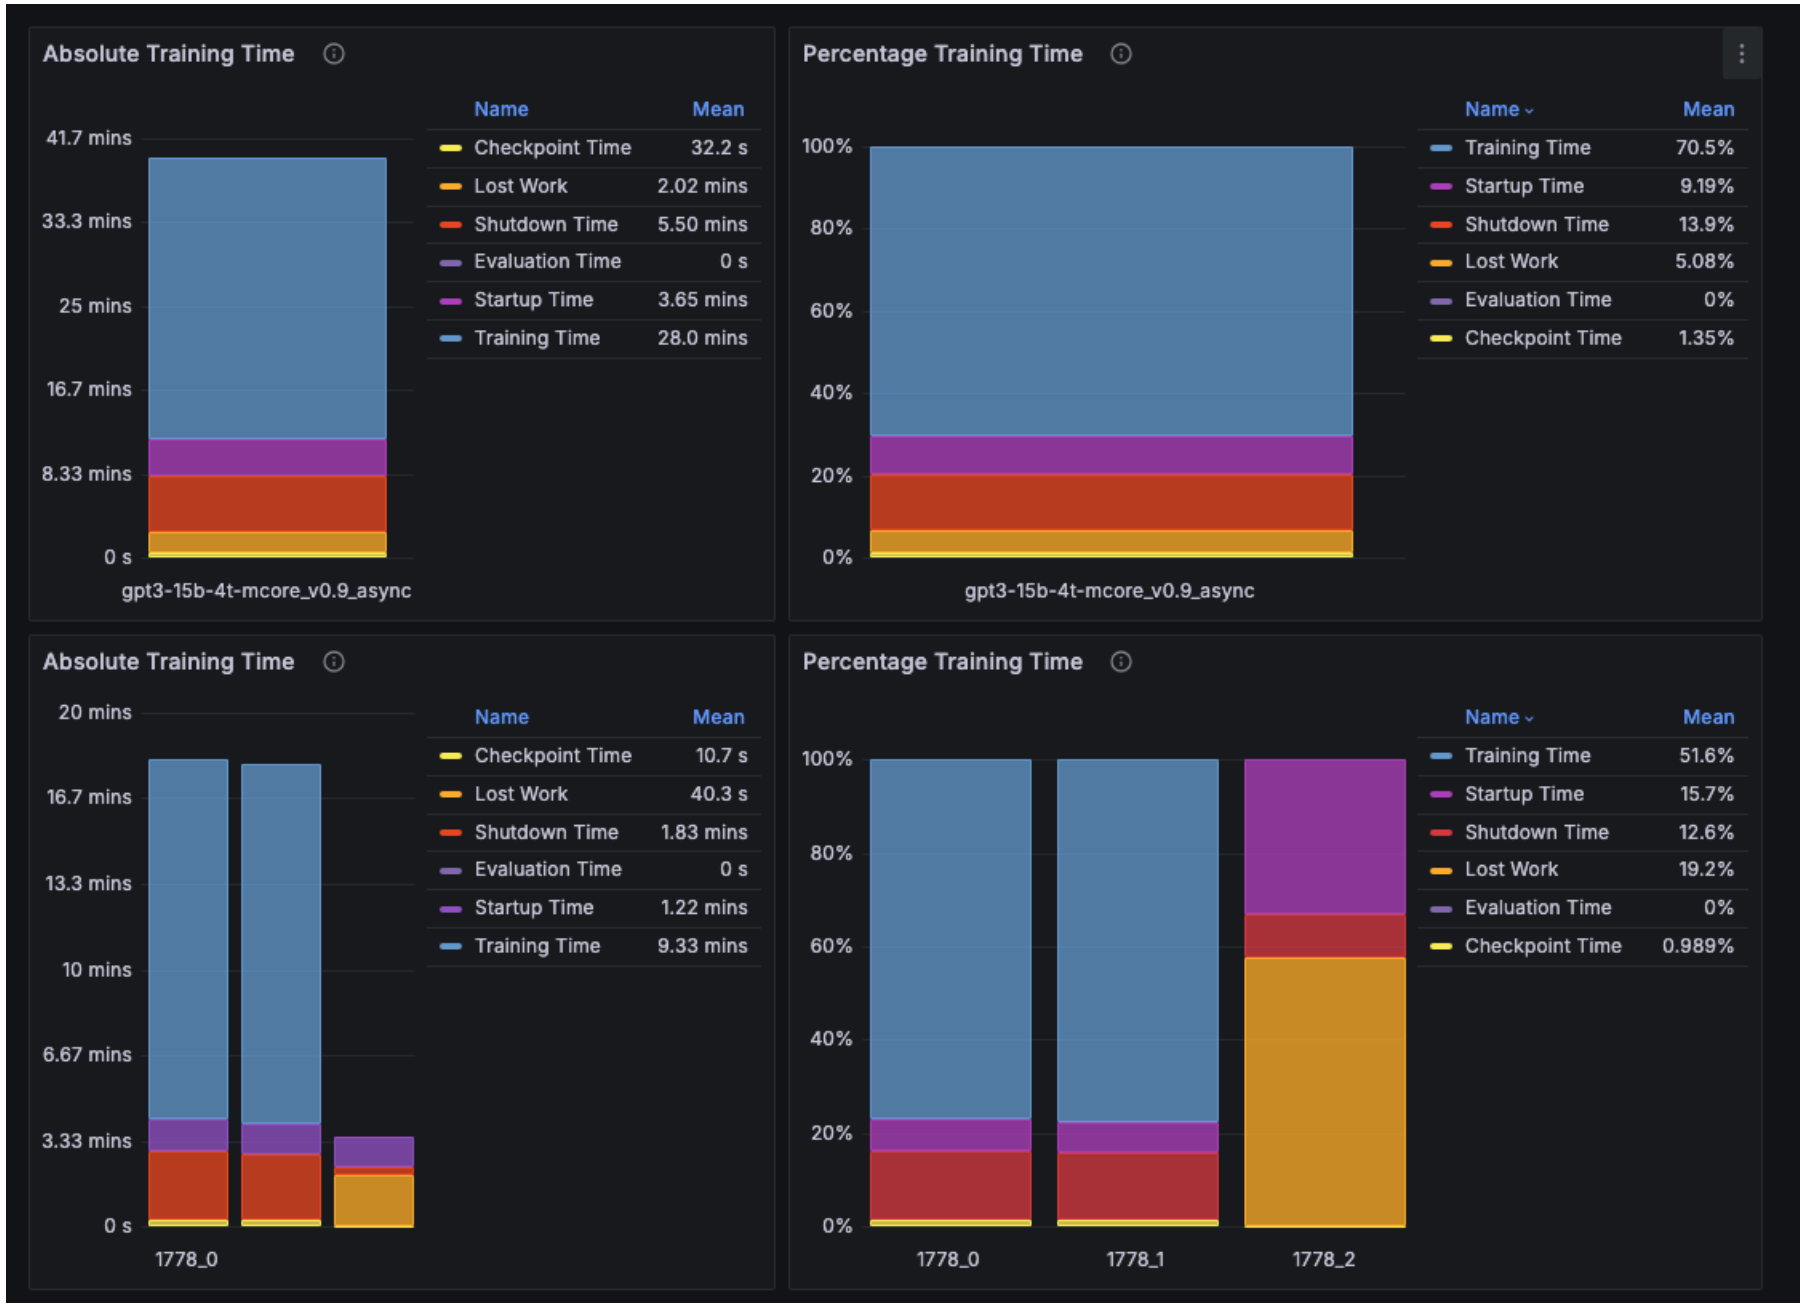
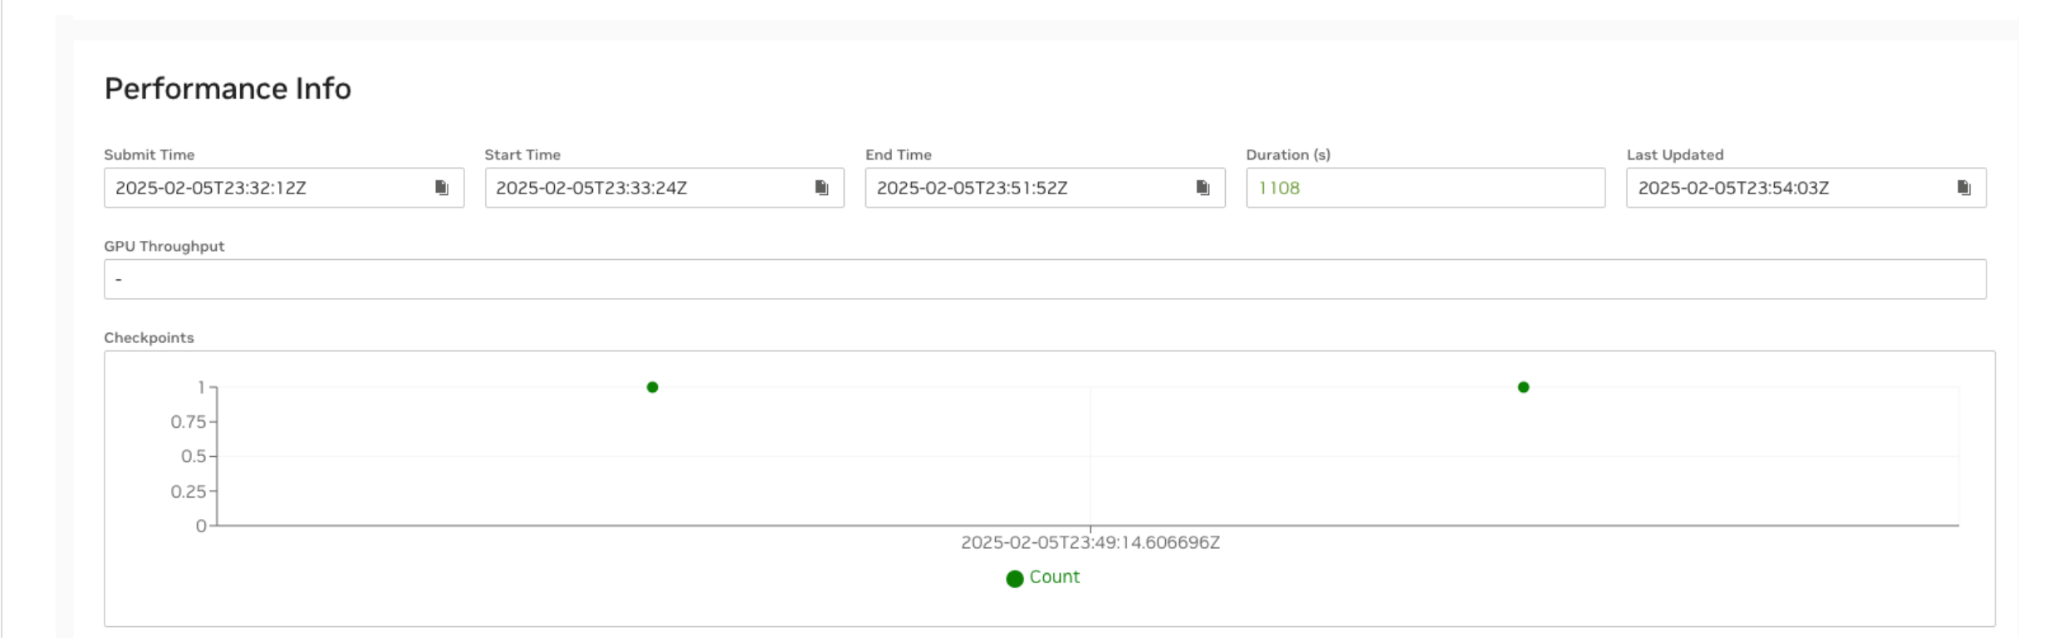
The Training efficiency KPI dashboard displays the downtime for each job and the aggregated downtime across all jobs. For example, the training time efficiency for job 1778, which automatically restarted twice, is shown to be 70.5%. The low efficiency is due to the second restart (1778_2), where the job was manually canceled before reaching the first checkpoint save to illustrate the impact of a failure restart. As expected, the performance data for this restart shows no checkpoint save. NMC AJR uses the first checkpoint save as the criterion for determining restart success or failure. This threshold is configurable per system deployment.
Viewing Job Details from Job Manager#
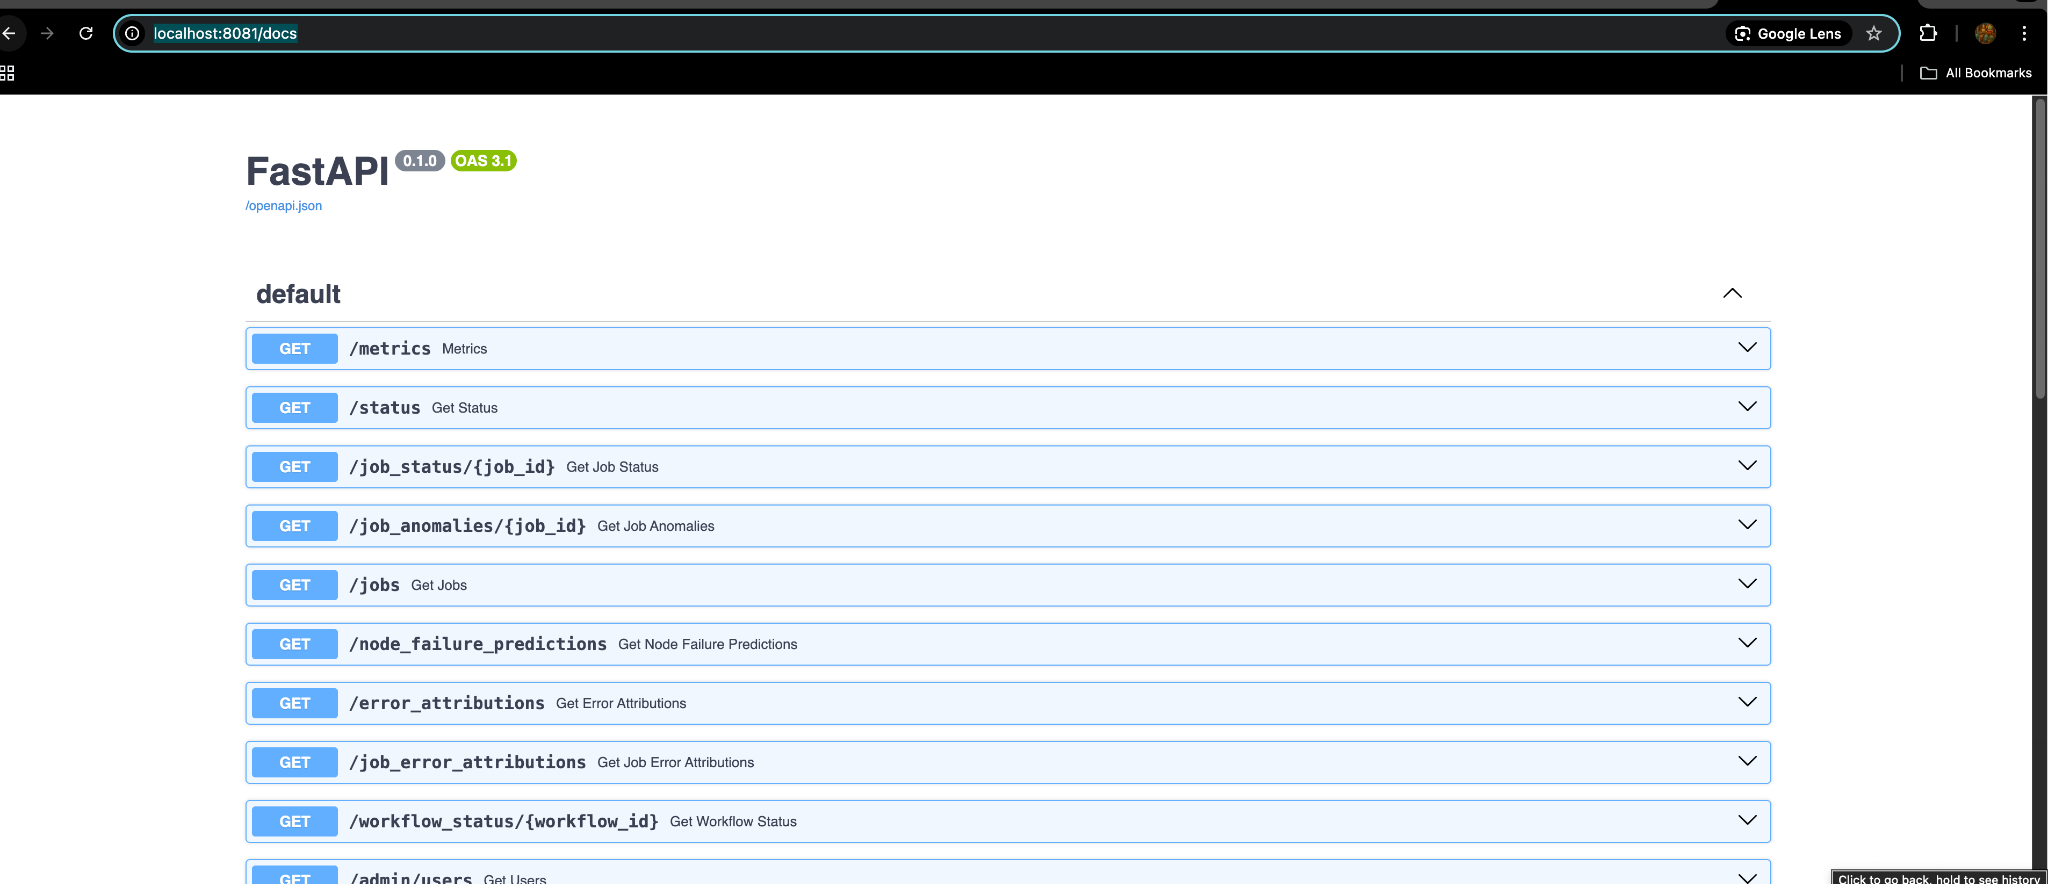
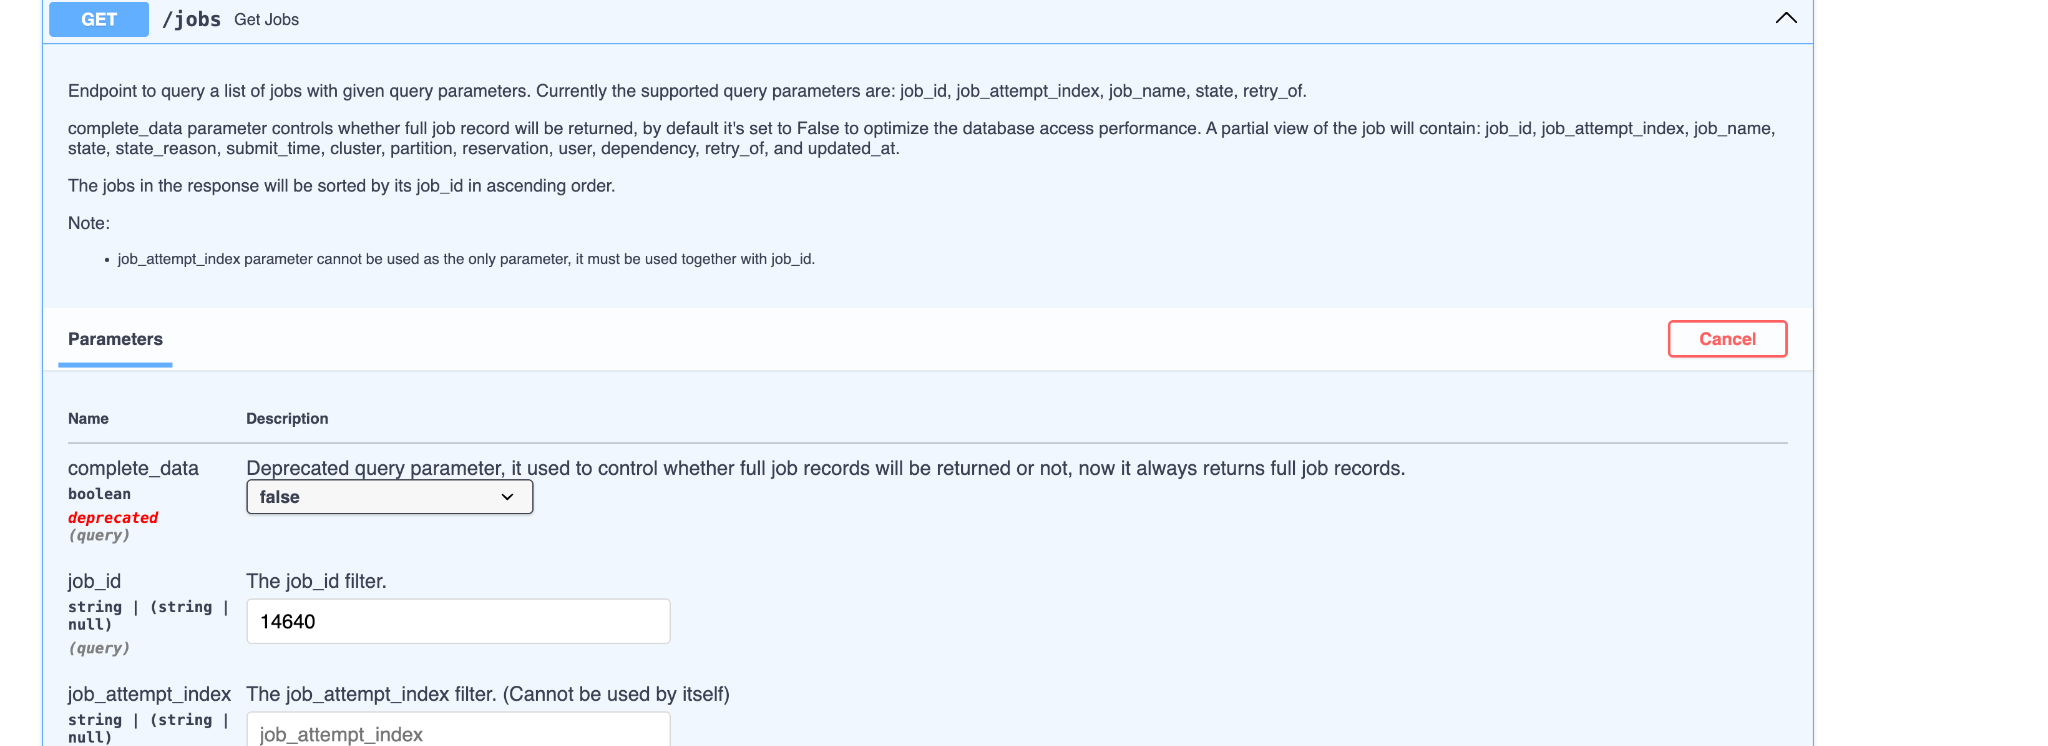
We can see all the job-related details for debugging purposes for a given job ID.
kubectl -n heimdall port-forward svc/job-manager 8081:8080
Then go to http://localhost:8081/docs.
Accessing the Cockpit#
We use SSH port forwarding to access Cockpit and analyze the job failure cause and the AJR anomaly identified for the user.
kubectl get svc heimdall-dashboard -n heimdall
NAME TYPE CLUSTER-IP EXTERNAL-IP PORT(S) AGE
heimdall-dashboard ClusterIP 10.22.210.1 <none> 3001/TCP 31d

$ ssh -L 3001:<cockpit k8s service>:3001 <unix username>@<login node>
Then go to http://localhost:3001/mission-control/recovery-engine/dashboard/workflow.
Monitoring and Performance
The Cockpit performance info section logs the exact times when each checkpoint was saved. For example, this link shows the first job submitted by a user, 1778(0) -1778 is the Slurm job id and 0 shows this is the first job.
AJR Monitoring the Job#
To make AJR monitor the job user needs to add the following comment to their SBATCH file
#SBATCH --comment='{"APS": {"auto_resume_mode": "requeue"}}'
The job logs file name should be in the format:
{SLURM_JOB_NAME}\_${SLURM_JOB_ID}\_${DATETIME}.log where DATETIME=`date +'date\_%y-%m-%d_time\_%H-%M-%S'\`
Application Log Format Requirements#
To ensure NMC AJR can effectively monitor and manage your training jobs, follow these formatting requirements for Slurm application logs:
Job ID in filename: The log filename should include the Slurm job ID. For example, 1234567 in: megatron_1234567_date_2024-07-31_time_18-15-55.log.
Regular heartbeat: The application should log at least one line every two minutes. This helps NMC AJR detect application hangs.
Throughput logging: The application should log periodic iteration throughput containing the substring “TFLOP” to detect straggler anomalies.
Timestamps: Ensure that all log entries contain timestamps.
Job Checkpoint Event Monitoring#
AJR relies on specific log patterns to identify when a job successfully saves a checkpoint. The following default patterns are recognized by for checkpoint detection:
save-checkpoint
SAVE_CHECKPOINT: iteration:.*, ckpt saving takes .* seconds
Saved checkpoint to
When a new custom pattern is needed, the system administrator can add it to the system configuration by following the steps below:
Access the ConfigMap named heimdall-watcher-config in the heimdall namespace.
kubectl -n heimdall edit configmap heimdall-watcher-config
Modify the query with
(save-checkpoint)|(SAVE_CHECKPOINT: iteration:.*, ckpt savingtakes .* seconds)|(Saved checkpoint to)to include the new pattern, the new pattern has to be added with|as the separator.- attributes: query: '|~ "(?i)(save-checkpoint)|(SAVE_CHECKPOINT: iteration:.*, ckpt saving takes .* seconds)|(Saved checkpoint to)|(Your_New_Pattern_Here)"' bucket_by: - job_id - log_file_name children: - attributes: action: send_message_eventbus: CHECKPOINTSAVE unique: false name: chkpt_save_action type: simple_action name: chkpt_save type: loki_query
Save and exit the editor, then restart all watcher pods for the changes to take effect.
kubectl -n heimdall rollout restart deployment/heimdall-watcher
Job Requeue Limits#
When a job is managed with requeue mode, the maximum number of requeues for a job is determined by three factors:
System Level Configuration: A configurable upper bound set at the system level, typically in the order of dozens. This value should be large enough that it is not reached unless a job runs for an extremely long time with persistent failures.
Job Level Configuration: Individual jobs can specify their own maximum requeue limit using the max_requeue_times parameter in the JSON configuration. The system will use the smaller value between the job-level setting and the system-level maximum.
#SBATCH --comment='{"APS": {"auto_resume_mode": "requeue", "max_requeue_times": 10}}'Checkpoint-based Requeue Early Stop: When a job has more than X consecutive failed attempts without successfully saving a new checkpoint, the job will be considered as crashlooping and the requeue sequence will be stopped. Here X is a configurable threshold at the system level.
Testing AJR Functionality#
AJR functionality can be tested by running simple bash scripts to test both the modes of AJR (requeue and singleton dependency).
Singleton Dependency
#!/bin/bash

     #SBATCH -t 00:05:00
     #SBATCH --dependency=singleton
     #SBATCH --comment='{"APS": {"auto_resume_mode": "singleton_dependency"}}'

     DATETIME=`date +'date\_%y-%m-%d_time\_%H-%M-%S'\`

     echo 'AJR light-weight fault simulation test'

     # This srun command sets the output file for the job step. In the job   step, it sleeps for 30s, then prints a

     # log line that will be recognized by AJR as segment fault, then sleep  for another 60s before exiting with 1.

     srun --output="$(pwd)/%x\_%j\_$DATETIME.log" bash -c \

     "echo 'Start time: $DATETIME' && echo 'Sleeping 30 seconds' && \

     sleep 30 && echo 'Rank0: (1) segmentation fault: artificial segfault' &&
     \

     echo 'Sleep another 60 seconds' && \

     sleep 60 && exit 1"
Copy the content of the bash script above and save it into a file in Slurm, e.g.: sbatch_test.sh.
Submit two jobs to Slurm with the sbatch script. Note that you have to specify the job name (with -J option) and the partition name (with
-poption) since they are not encoded in the script. Also ensure the that the second command is run with--holdoption too.
sbatch -p defq -J AJR-verification-test sbatch_test.sh

sbatch --hold -p defq -J AJR-verification-test sbatch_test.sh
Requeue
#!/bin/bash
     #SBATCH -t 00:05:00
     #SBATCH --comment='{"APS": {"auto_resume_mode": "requeue",  "max_requeue_times": 1}}'

     DATETIME=`date +'date\_%y-%m-%d_time\_%H-%M-%S'\`

     echo 'AJR light-weight fault simulation test (auto resume mode: requeue)'

     # This srun command sets the output file for the job step. In the job   step, it simply sleep for 30s, then print a

     # log line that will be recognized by AJR as segment fault, then sleep for another 60s before exiting with 1.

     srun --output="$(pwd)/%x\_%j\_$DATETIME.log" bash -c \
     "echo 'Start time: $DATETIME' && echo 'Sleeping 30 seconds' && \
     sleep 30 && echo 'Rank0: (1) segmentation fault: artificial segfault' &&
     \       echo 'Sleep another 60 seconds' && \
     sleep 60 && exit 1"
Copy the content of the bash script above and save it into a file in Slurm, e.g.: sbatch_test.sh.
Submit one job to Slurm with the sbatch script, note that you have to specify the job name (with
-Joption) and the partition name (with-poption) since they are not encoded in the script.
sbatch -p defq -J AJR-verification-test sbatch_test.sh
In singleton mode, if an error occurs in the first job, the second job being held will be released. In requeue mode, the same job will be requeued again upon encountering an error, thus we can verify AJR working as expected.
How to turn on and off the dry-run mode#
The dry-run mode control is in the workflow controller. Currently it’s not supported through the helm chart values file, so it has to be done by manually editing the k8s deployment.
Specifically, we just need to add below env var to the deployment, make sure it was added to the workflow-controller container and not anything else.
kubectl -n heimdall edit deploy heimdall-workflow-controller
To turn it on, add APS_DRY_RUN env var to the list and set it to true:
- name: APS_DRY_RUN
  value: "true"
After turning it on, the pod will be restarted automatically. A log line like below will be printed out at the beginning of the pod logs.
2025-06-07 00:35:03.012 \| INFO \| workflow_controller.cli:serve:197 - DRY_RUN mode is active
To turn it off, either remove it or set it to false.
If the workflow controller is not running in k8s pod but in a systemd service (i.e. legacy mode), the same env var approach works too.
Debugging Some Common Issues#
Issue: Job is not managed by AJR / is not visible on the Cockpit#
Triage Steps and fixes:
Potential root cause:
The job doesn’t have the proper AJR spec attached as part of the job comment.
How to verify:
Run
squeue -j <job-id> --format='%i %k'when the job is still active.Run
sacct -j <job-id> -json \| lessand search for the comment field when the job has already finished.
How to fix: Make sure the comment is valid json with ‘APS’ key. Example:
{"APS": {}}. Empty value is sufficient for the job to be managed by APS, other fields like auto_resume_mode and max_requeue_times can be specified too, e.g.:{"APS": {"auto_resume_mode": "requeue"}}.
[Rare case]: The connection between workflow controller and event bus host is not established.
How to verify: Check workflow controller pod status and logs, if there’s any persistent connection errors, the workflow controller will crashloop.
How to fix:
Make sure rabbitmq pod is running healthy.
Make sure the rabbitmq credential is supplied to workflow controller deployment correctly. The password is usually stored in a k8s secret heimdall-rabbitmq.
[Rare case]: Queue configuration discrepancy between workflow controller and job manager, i.e. the sender and receiver don’t use the same routing key to route messages.
How to verify:
The easiest way to verify this is by port-forwarding the event bus management UI and checking if there’s any message build-up on the job_updates queue and job.updates routing key.
kubectl -n soperator port-forward svc/heimdall-rabbitmq 15670:15672
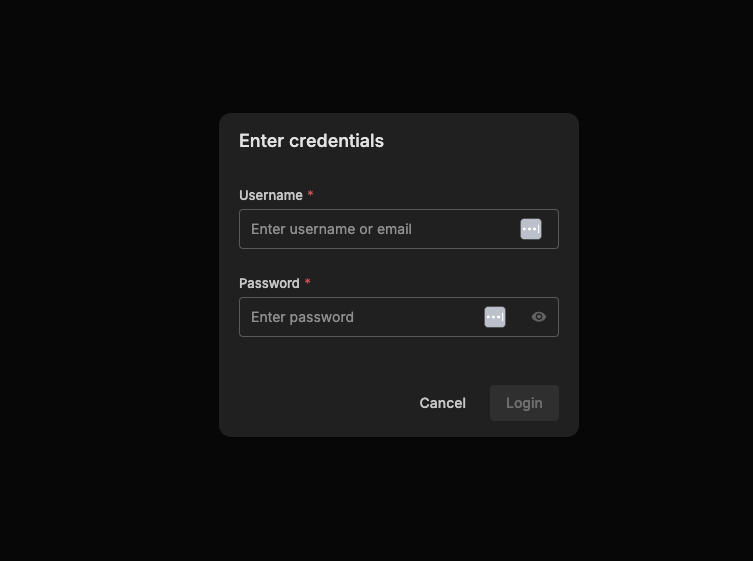
Then navigate to http://localhost:15670 and login with the rabbitmq credentials (can be found in k8s service configs and secret). A working setup should look like the screenshot below.
Issue: Job is available in Cockpit but doesn’t receive any anomaly and checkpoint event#
In our current architecture, the full view of the job data we store in the database come from multiple sources:
Job status updates: from workflow controller by periodically polling Slurm cluster.
Anomaly, checkpoint and other runtime events: from Watcher by periodically querying Loki to find matching patterns in the application logs.
Anomaly attribution result: from anomaly detection isolator + FACT attribution service with application log and syslog in Loki. Only available when an anomaly is present.
This symptom usually means the job manager is receiving job status updates from workflow controller fine but is not receiving job anomaly events from Watcher.
Most common reason
If the job doesn’t produce logs with names that comply with AJR’s naming convention, WFC is unable to recognize them and create symlinks for them to be ingested to Loki. Without application logs in Loki, the Watcher can’t do pattern matching and generate anomalies.
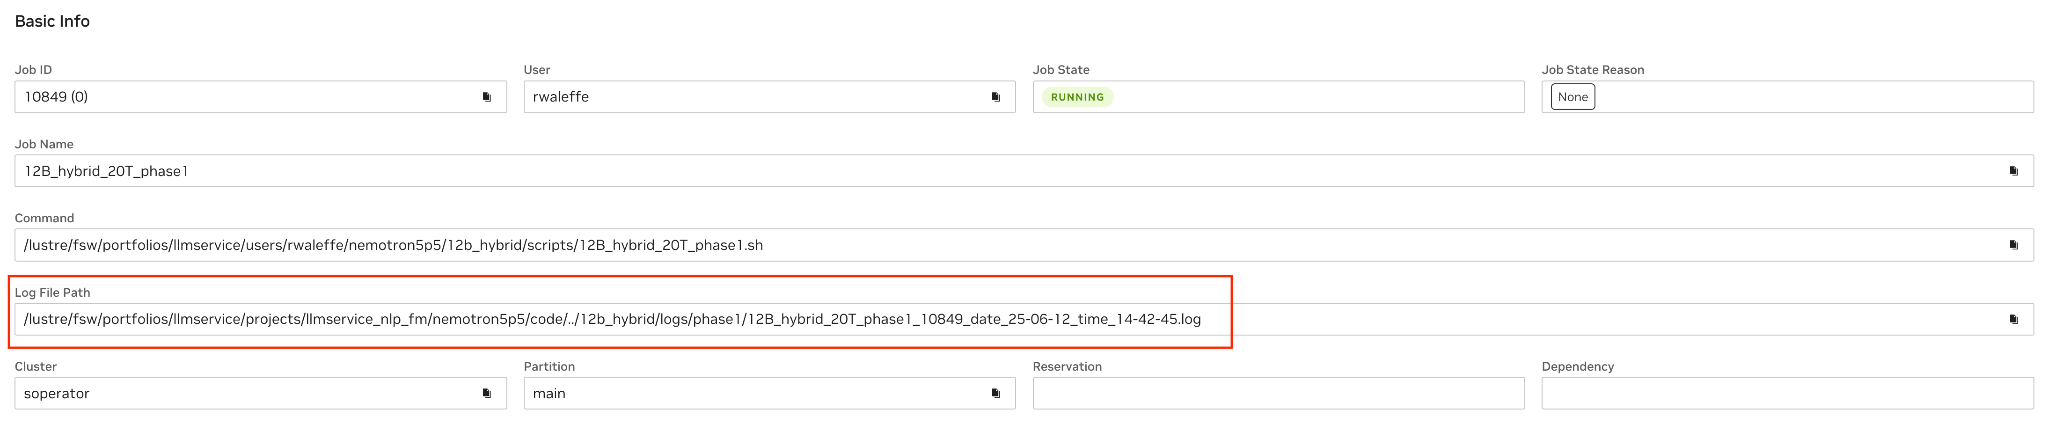
To verify this, the simplest way is to check if the Log File Path field on Cockpit is empty or not after the job starts running. Note that if the job is still pending, it’s expected for this field to be empty because oftentimes the log files are created as part of the SBATCH script and are available only after the job is in running state.
Another way is to check workflow controller logs, it usually looks like this:
No valid job log paths found for job_id <job-id> job_name <job_name>, thus no job log symlinks will be created. The job or job step log paths must start with '<job_name>\_<job_id>_date' to be considered valid.
Fix: Contact the user to make sure they follow the instructions in the AJR user guide when writing their log files.
Less Common Reasons#
The event bus routing was not properly configured between Watcher and job manager.
How to verify: Use a similar approach above and check if there’s any build-up on the anomaly queue.
How to fix: Properly configure both services.
Missing rules in Watcher config:
How to verify: Verify in Watcher service logs that indeed there’s no anomaly captured. Grab the key failure message from the job logs and compare with the Watcher config.
How to fix: Add the regex to the corresponding rule section in the Watcher config.
Issue: The job died but was not requeued#
Full anomaly handling sequence
Watcher detects an anomaly from the application logs.
Watcher sends the anomaly to the job manager for persistence through event bus.
Job manager forwards the anomaly to Anomaly Remediation Manager (ARM)
Upon receiving the anomaly event, ARM kills the job (if needed) and requeuehold the same job id (happens when auto_resume_mode is requeue) and notifies Anomaly Detection Isolator (ADI) about the KillStarted through event bus. All job management actions are sent to WFC for execution.
ADI calculates the attribution result and sends it back to ARM, the message is also replicated to job manager for persistence.
Upon receiving the attribution result, ARM updates and releases the held job.
Triage steps
Verified if the job received any anomaly, if not, follow the steps in the “Full anomaly handling sequence” symptom above first.
Verify if ARM received the anomaly forwarded by job manager and issued a kill command.
Remediation Steps
Attempt to requeue the failed job manually: scontrol requeue <JOB_ID>. It can be done at the Cockpit after enabling the “god mode”:
Note
A job can only be requeued while it is still present in Slurm’s memory. If you are unable to run the requeue command manually, please contact the user and ask them to resubmit the job.
Issue: The requeued job or the *next_dependency* job was not released#
This happens usually because the anomaly attribution sequence was interrupted.
Triage steps:
Verify if ADI received the KillStarted event from ARM and started working on it. The logging signatures are:
Received a job killed message from queue: '{"job_id":"<JOB_ID>", ...'
Starting to work on task: '{"job_id": "<JOB_ID>", ...'
Verify if ADI successfully queried job application logs and system logs and sent them to the attribution service.
Verify if ADI retrieved the anomaly attribution result from the FACT attribution service and sent it to the event bus.
Verify if ARM received the anomaly attribution result and deserialized properly and sent a request to WFC to release the job.
Remediation Steps:
Directly run scontrol release <JOB_ID> on the Slurm cluster or click the release button from the UI (similar to the requeue example above).
Documentation and Runbooks#
Comprehensive documentation and well-maintained runbooks are critical for successful AJR operations and long-term maintainability. These resources serve as the foundation for operational procedures, troubleshooting guides, and knowledge transfer. Proper documentation ensures that teams can effectively manage, monitor, and troubleshoot AJR deployments regardless of personnel changes. You need to ensure the following is addressed:
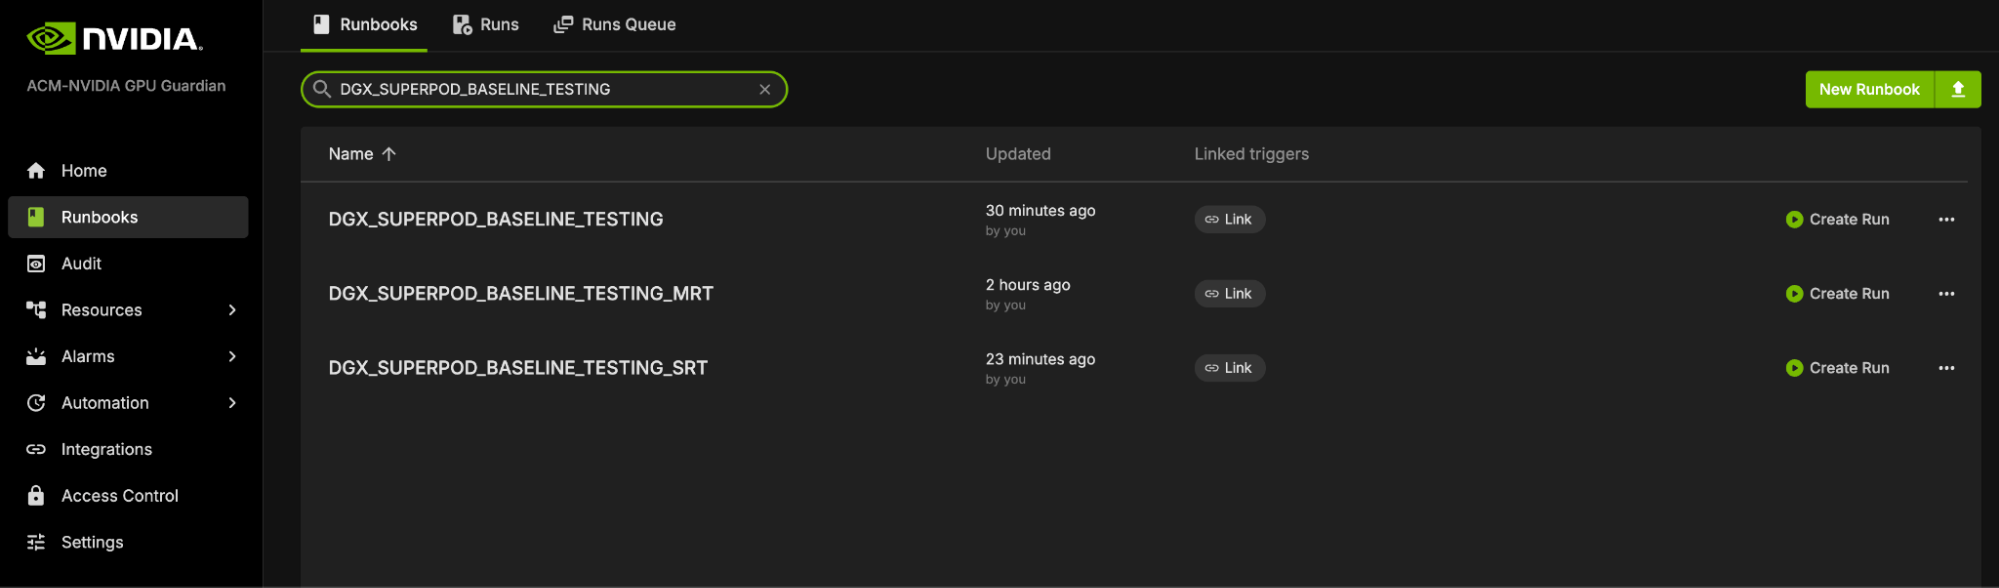
Updating Runbooks: Ensure runbooks are updated with parameters to watch for and general issues. Service owners should highlight conditions and metrics to monitor.
Documentation: Provide detailed documentation for installation, configuration, monitoring, and upgrading processes.
Deployment Requests#
Deployment requests serve as formal documentation for provisioning AJR instances in new environments. These requests ensure that all stakeholders understand the deployment scope, requirements, and expected outcomes. A well-structured deployment request facilitates smooth provisioning and provides a clear reference for post-deployment validation. An example deployment request includes the following components:
Example Deployment: Deploy AJR to the Apple environment and provide access links for review. Ensure all configurations and setups are properly documented.
Conclusion#
This guide provides comprehensive instructions for the administration and operation of AJR within the NMC 2.0 product release for NVIDIA. Please follow these steps to ensure effective management and monitoring of AJR.