Debugging Common Issues#
This section covers common issues and their root causes, as well as the steps to troubleshoot and fix them.
Issue: Job is not managed by ARE or is not visible on the Cockpit#
Potential root cause:#
The job does not have the proper ARE spec attached as part of the job comment.
How to verify:
Run
squeue -j <job-id> --format='%i %k'when the job is still active.Run
sacct -j <job-id> -json | lessand search for thecommentfield when the job has already finished.
How to fix:
Make sure the comment is valid JSON with an ‘APS’ key. Example:
{"APS": {}}. An empty value is sufficient for the job to be managed by APS; other fields like auto_resume_mode can be specified as well, e.g.:{"APS": {"auto_resume_mode": "requeue"}}.Make sure the job is submitted with the proper ARE spec attached as part of the job comment.
[Rare case] The connection between workflow controller and event bus host is not established.
How to verify:
Check the workflow controller Pod status and logs. If there are any persistent connection errors, the workflow controller will crash-loop.
How to fix:
Make sure the RabbitMQ Pod is running healthily.
Make sure the RabbitMQ credentials are supplied to the workflow controller deployment correctly. The password is usually stored in a Kubernetes secret
heimdall-rabbitmq.
[Rare case] Queue configuration discrepancy between workflow controller and job manager, i.e., the sender and receiver do not use the same routing key to route messages.
How to verify:
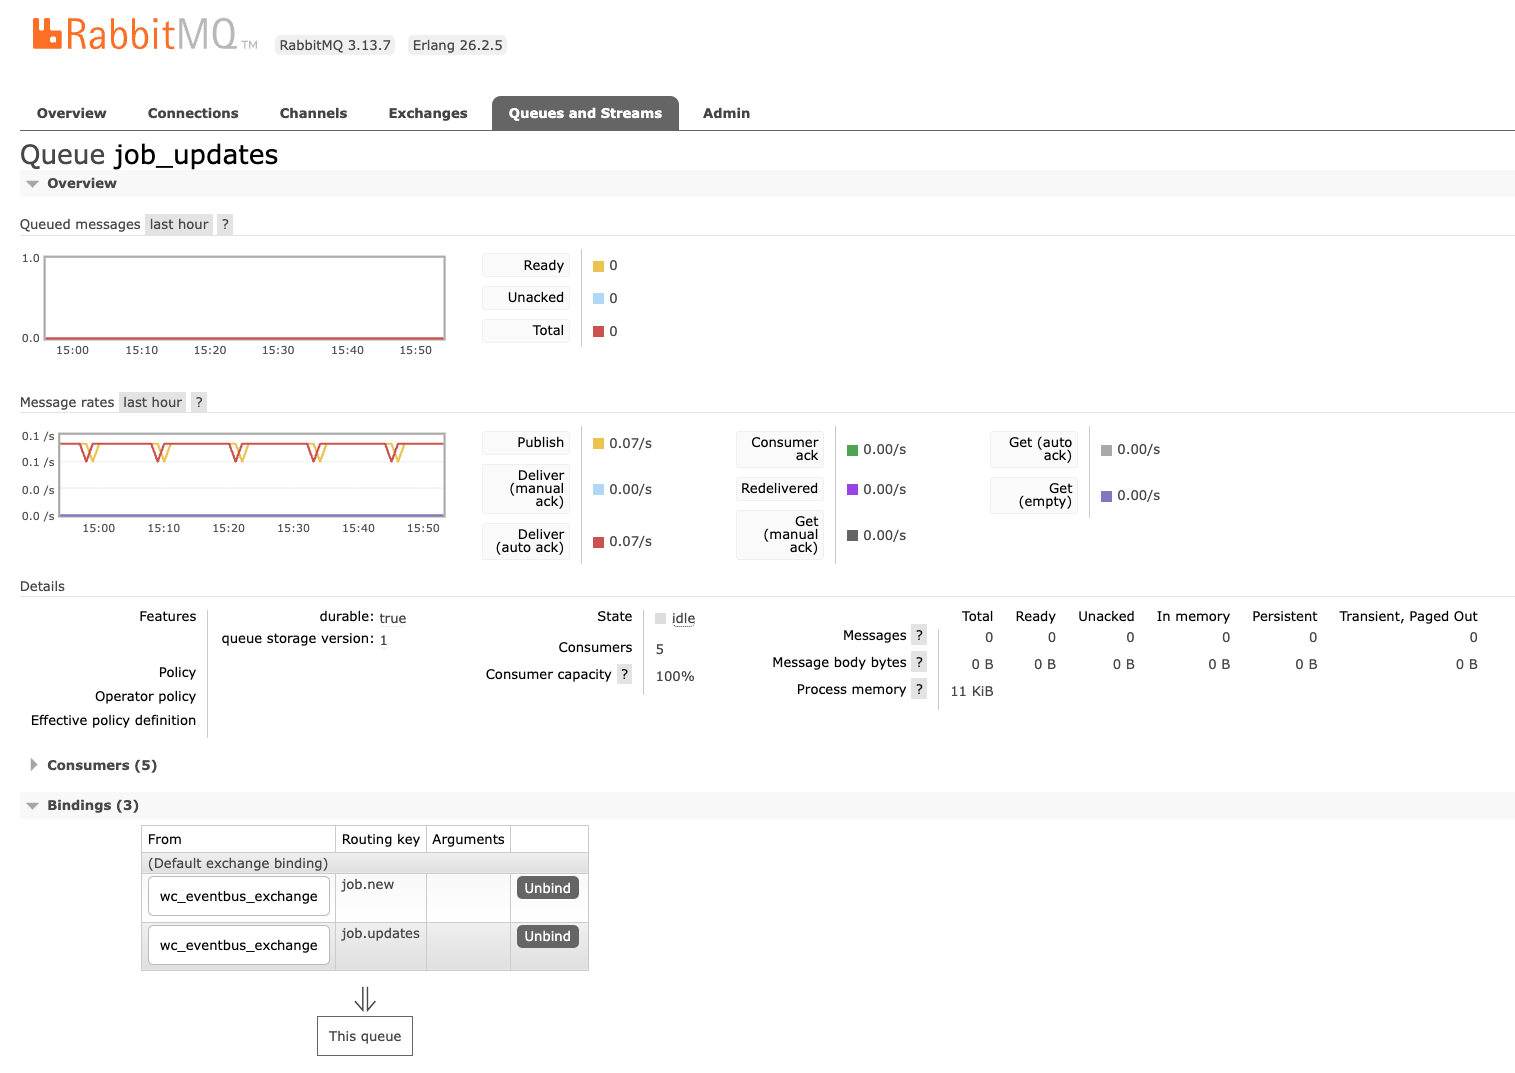
The easiest way to verify this is by port-forwarding the event bus management UI and checking if there is any message build-up on the job_updates queue and job.updates routing key.
kubectl -n soperator port-forward svc/heimdall-rabbitmq 15670:15672
Then navigate to http://localhost:15670 and log in with the RabbitMQ credentials (can be found in Kubernetes service configs and secrets). A working setup should look like the screenshot below.
Issue: Job is available in Cockpit but does not receive any anomaly and checkpoint events#
In our current architecture, the full view of the job data we store in the database comes from multiple sources:
Job status updates: from the workflow controller by periodically polling the Slurm cluster.
Anomaly, checkpoint, and other runtime events: from the watcher by periodically querying Loki to find matching patterns in the application logs.
Anomaly attribution result: from the anomaly detection isolator + FACT attribution service with application logs and syslog in Loki. Only available when an anomaly is present.
This symptom usually means the job manager is receiving job status updates from the workflow controller fine but is not receiving job anomaly events from the watcher.
Common root cause:#
The job does not produce logs with names that comply with ARE’s naming convention; therefore, WFC is unable to recognize them and create symlinks for them to be ingested into Loki. Without application logs in Loki, the watcher cannot do pattern matching and generate anomalies.
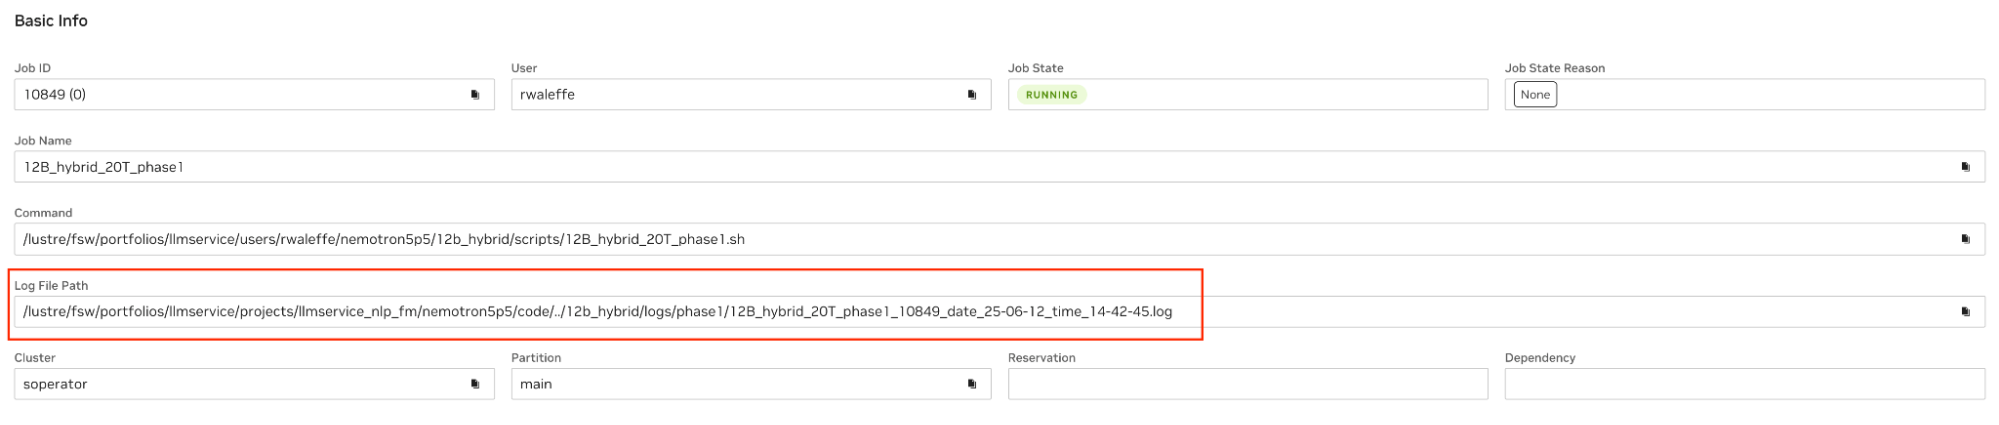
To verify this, the simplest way is to check if the Log File Path field on Cockpit is empty after the job starts running. Note that if the job is still pending, it is expected for this field to be empty because oftentimes the log files are created as part of the SBATCH script and are available only after the job is in a running state.
Another way is to check workflow controller logs, it usually looks like this:
No valid job log paths found for job_id <job-id> job_name <job_name>, thus no job log symlinks will be created. The job or job step log paths must start with ‘<job_name>_<job_id>_date’ to be considered valid.
Fix: Contact the user to make sure they follow the instructions in the ARE user guide when writing their log files.
Less Common Reasons:#
The event bus routing was not properly configured between the watcher and job manager.
How to verify: Use a similar approach as above and check if there is any build-up on the anomaly queue.
How to fix: Properly configure both services.
Missing rules in watcher config:
How to verify: Verify in the watcher service logs that indeed there is no anomaly captured. Grab the key failure message from the job logs and compare with the watcher config.
How to fix: Add the regex to the corresponding rule section in the watcher config.
Issue: The job died but was not requeued#
Full Anomaly Handling Sequence
The full anomaly handling sequence is as follows:
The watcher detects an anomaly from the application logs.
The watcher sends the anomaly to the job manager for persistence through the event bus.
The job manager forwards the anomaly to Anomaly Remediation Manager (ARM).
Upon receiving the anomaly event, ARM kills the job (if needed) and requeue-holds the same job ID (happens when auto_resume_mode is requeue) and notifies Anomaly Detection Isolator (ADI) about the KillStarted through the event bus. All job management actions are sent to WFC for execution.
ADI calculates the attribution result and sends it back to ARM; the message is also replicated to the job manager for persistence.
Upon receiving the attribution result, ARM updates and releases the held job.
Triage steps
The triage steps are as follows:
Verify if the job received any anomaly; if not, follow the steps in the “job missing anomaly” symptom above first.
Verify if ARM received the anomaly forwarded by the job manager.
Remediation Steps
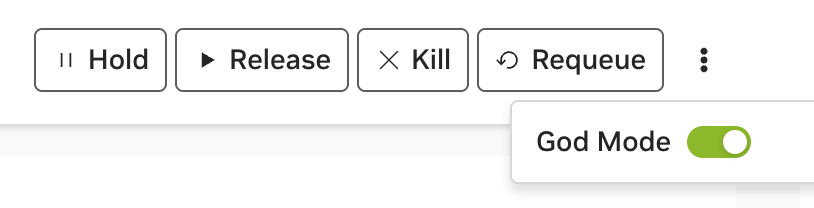
Attempt to requeue the failed job manually: scontrol requeue <job_id>. This can be done in the cockpit after enabling “god mode”:
Note
The job can only be requeued when it is still in Slurm’s memory. In the case where you are unable to run the requeue command manually, please contact the user and ask them to resubmit the job.
Issue: The requeued job or the next dependency job was not released#
This usually happens because the anomaly attribution sequence was interrupted.
Triage steps:
The triage steps are as follows:
Verify if ADI received the KillStarted event from ARM and started working on it. The logging signatures are:
# Logging signature

Received a job killed message from queue b'{"job_id":"<job-id>", ...
Starting to work on task: {'job_id': '<job-id>', ...
Verify if ADI successfully queried job application logs and system logs and sent them to the attribution service.
Verify if ADI retrieved the anomaly attribution result from the FACT attribution service and sent it to the event bus.
Verify if ARM received the anomaly attribution result, deserialized it properly, and sent a request to WFC to release the job.
Remediation Steps:
Directly run scontrol release <job-id> on the Slurm cluster or click the release button from the UI (similar to the requeue example above).