Observability Software#
Base Command Manager Monitoring#
NVIDIA Mission Control utilizes NVIDIA Base Command Manager’s built-in monitoring infrastructure for comprehensive system observability. This guide assumes administrators are familiar with BCM monitoring concepts, including metrics collection, measurable definitions, trigger and alert configurations, and health checks.
For detailed coverage of observability and monitoring in Base Command Manager, administrators should refer directly to:
Base Command Manager (BCM) Administrator Guide:
Monitoring Cluster Devices (Section 10)
Metrics, Health Checks, Enummetrics, and Actions (Appendix G)
For customizing monitoring alerts, health checks, and related configurations, consult these sections before proceeding.
Prometheus and Grafana#
Validate metric collection using Grafana#
Grafana should be available on your head node listening on HTTPS on the /grafana page.
By default, the administrative account is admin with password prom-operator.

Once authenticated, click on Explore on the left. Once in the Explore interface, set the query editor to code and query the metric memorytotal.
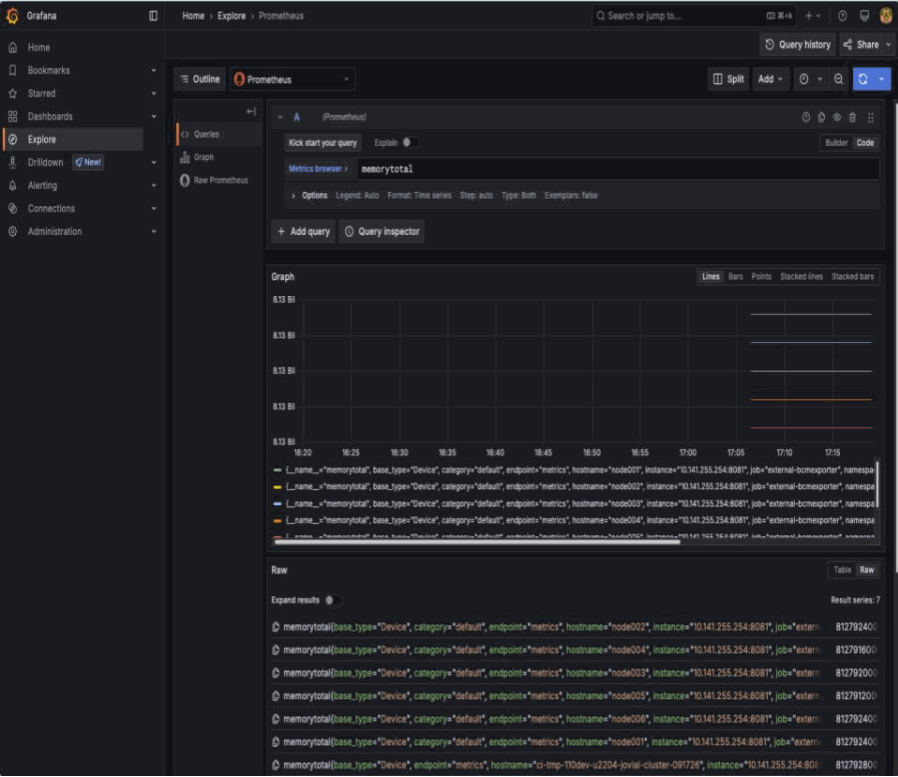
BCM provides many metrics out of the box, you can find a list of these in Grafana by using the Metric browser selecting all metrics which include the label job with the value external-bcmexporter.
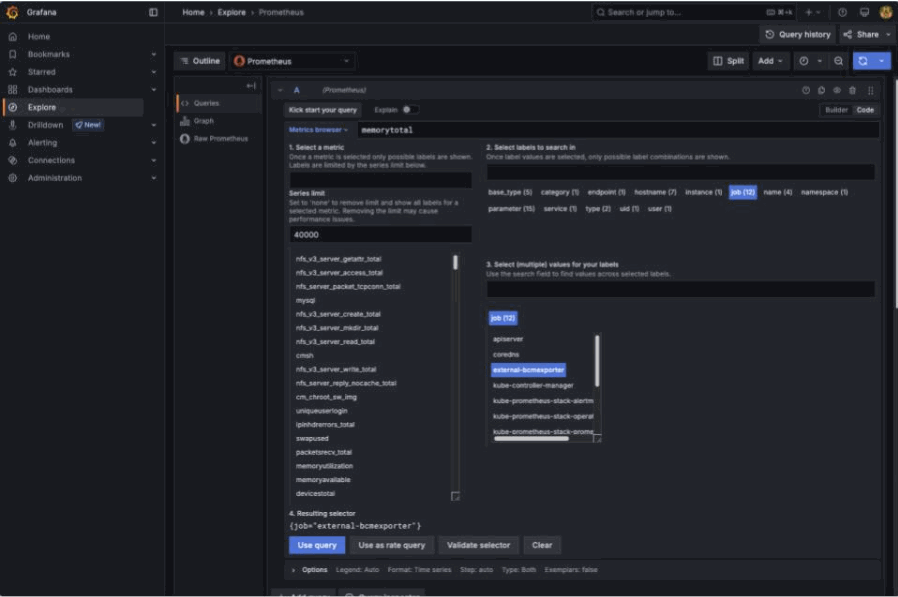
This can also be found by inspecting the output of the BCM Prometheus exporter endpoint. Here using curl with some light processing.
curl -sk https://localhost:8081/exporter | grep -Ev '# HELP|# TYPE' | cut -d'{' -f1 | sort -u

alertlevel
...
writetime_total
Build a Grafana dashboard#
With BCM exporting metrics, you can create dashboards. In this example, you’ll build a device state history dashboard. To build this dashboard, follow the steps below:
Select
Dashboardson the left panel, selectNewand selectNew dashboard.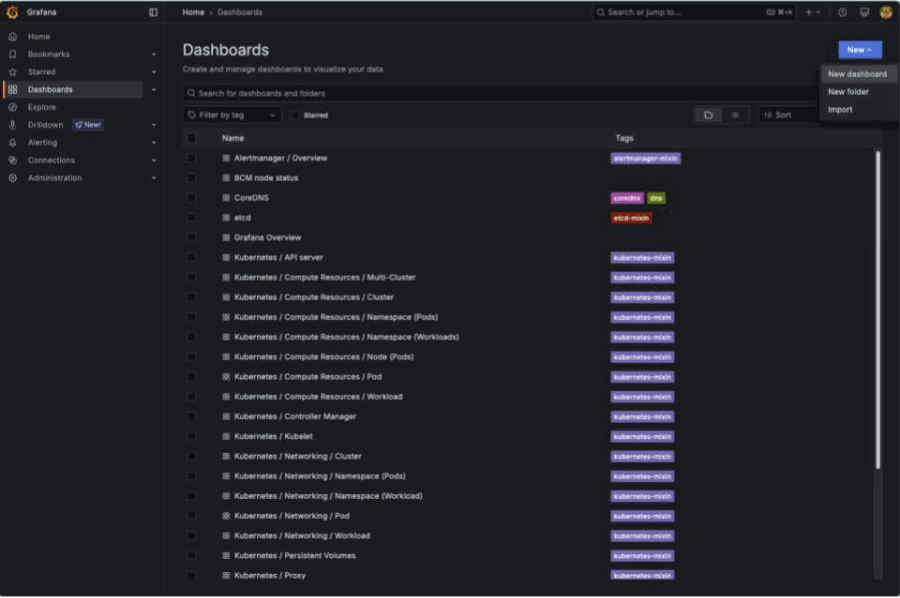
Click
Add visualization.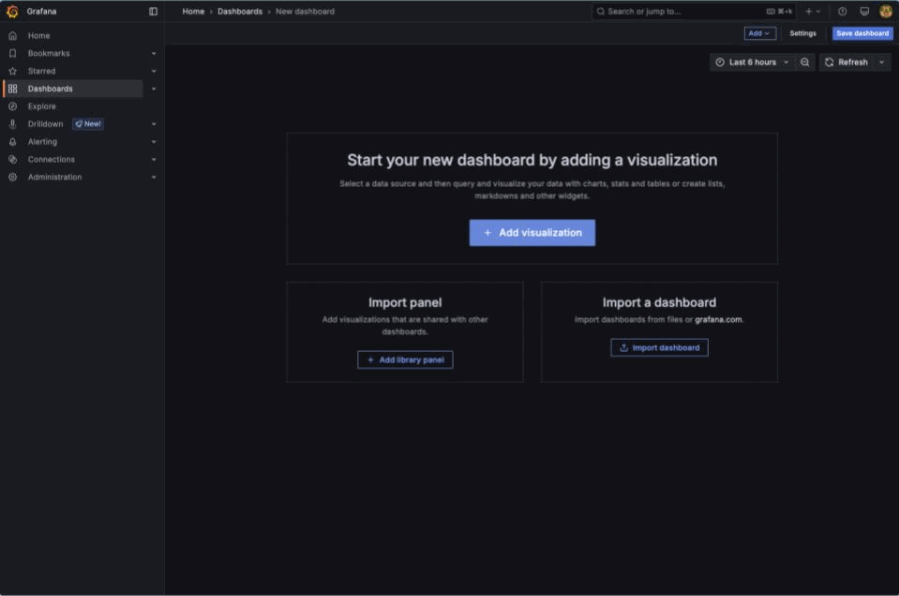
Select
Prometheusas your datasource.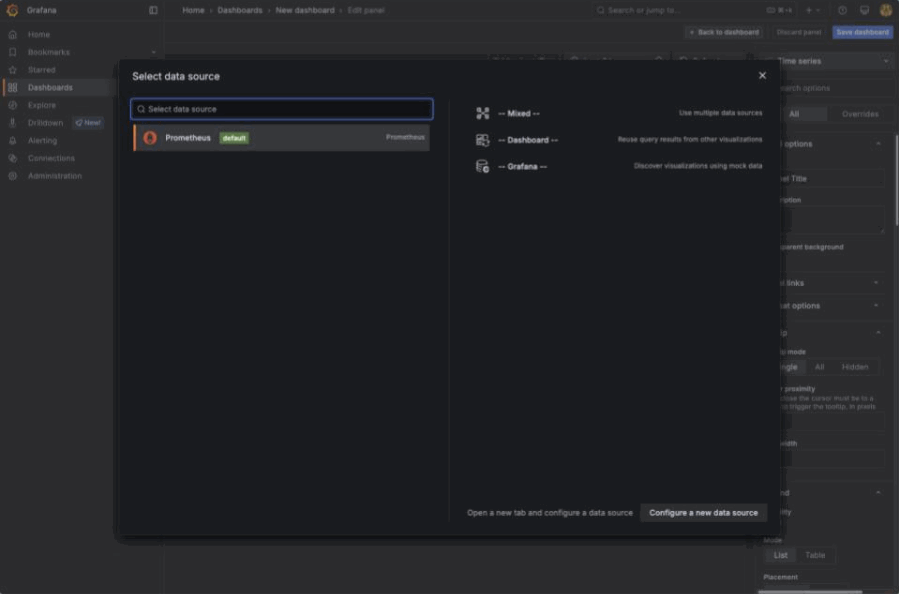
Start by setting the visualization to
Status history. Query the metricdevicestatus.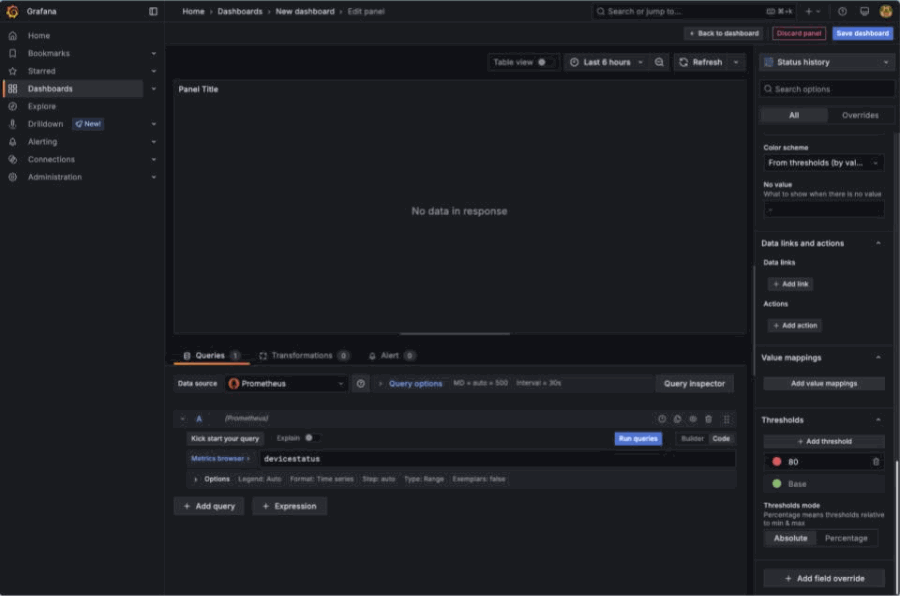
On the right pane, scroll down to
Value mappingsand click onAdd value mappings. This metric returns either0which maps toOKor1which maps toNOK. Add value conditions for these with a desired color. In this step, you’ll set0asgreenand1asred.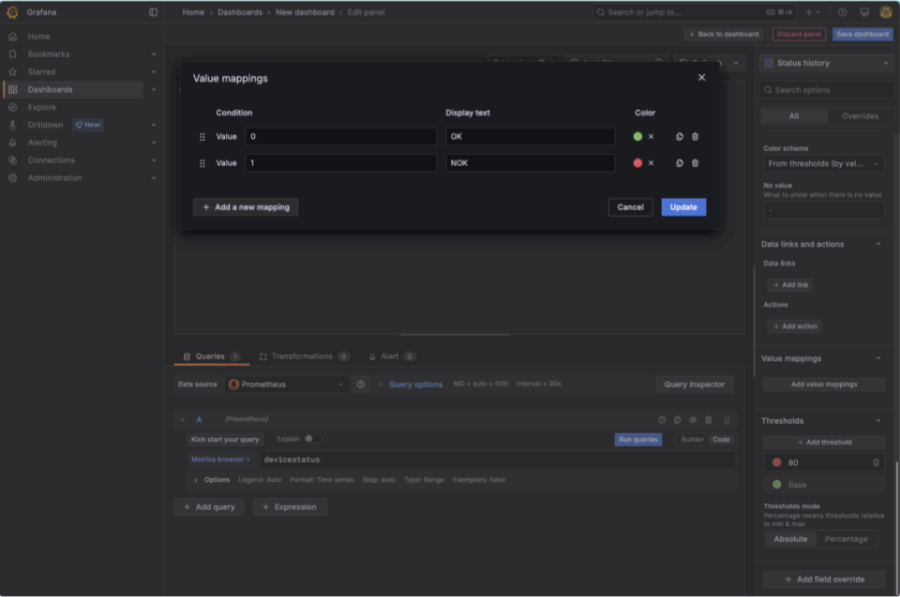
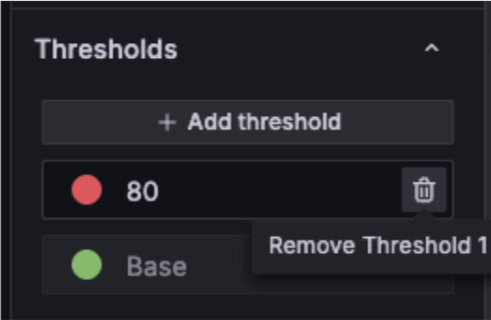
Delete the threshold for the value
80.
Expand options in the query window and set the Legend to
Customand set the value to{{hostname}}.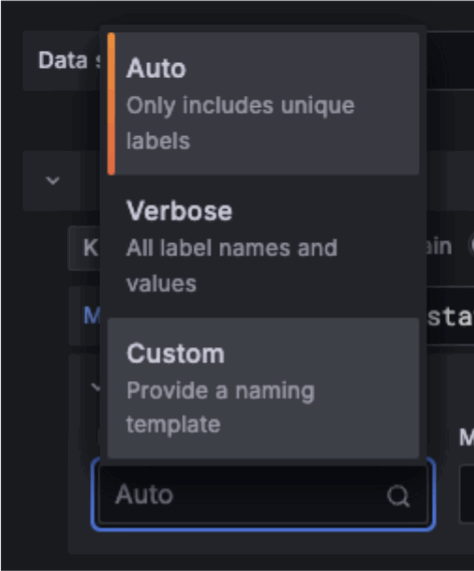
You may get this error:
Too many points to visualize properly.
You can work around this by setting the time window of the dashboard from
Last 6 hourstoLast 15 minutes.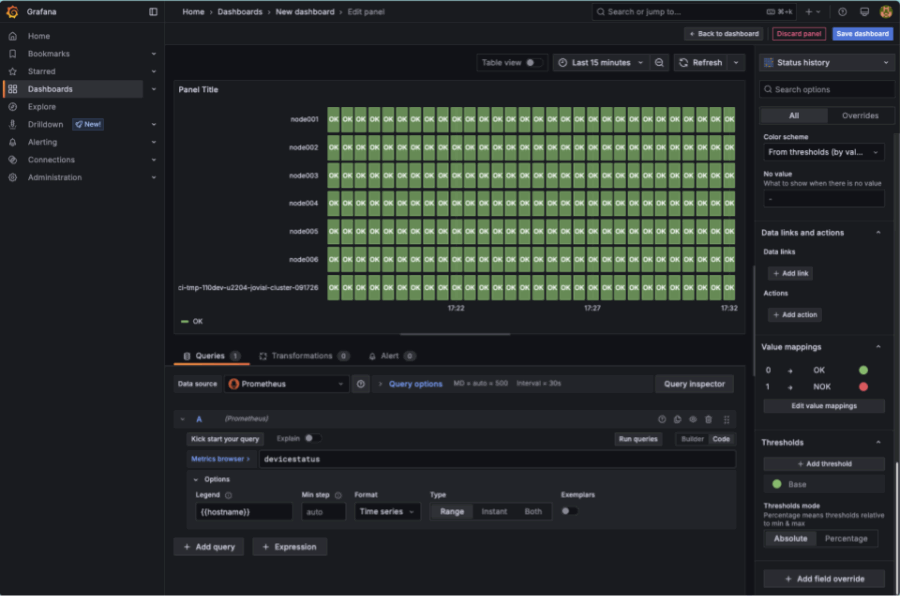
To allow for you to use this over a longer period of time, set the
Min stepfor the query to5m. Set theTitleof the panel toNode status.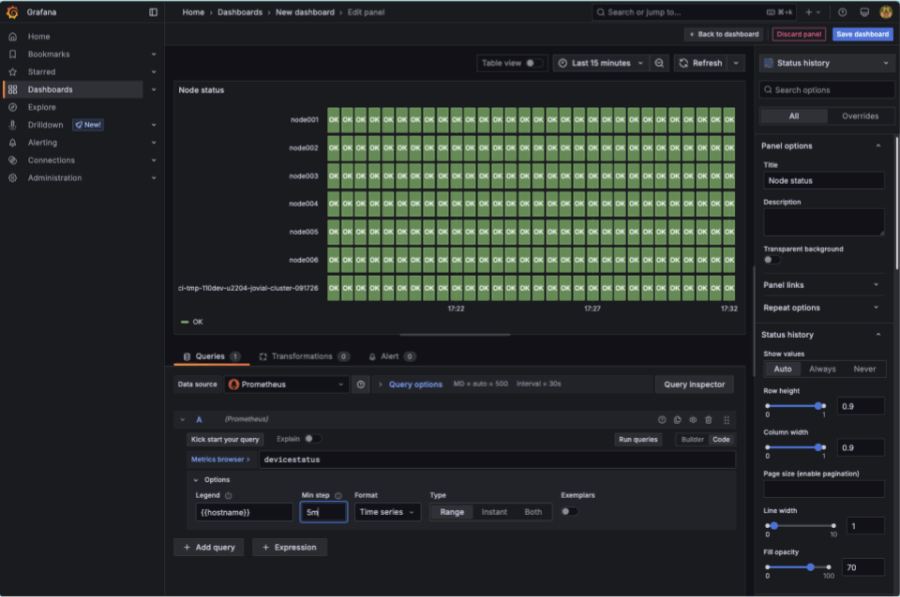
Click on
Back to dashboard. Resize the panel to a desired size.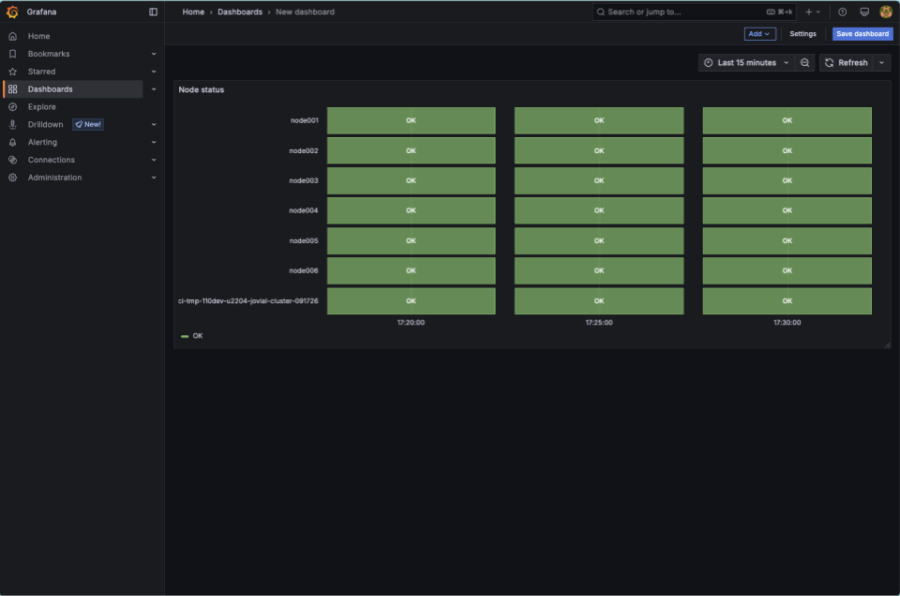
Set the window of time to the
Last 1 hour, take note that the dashboard rendered more status boxes.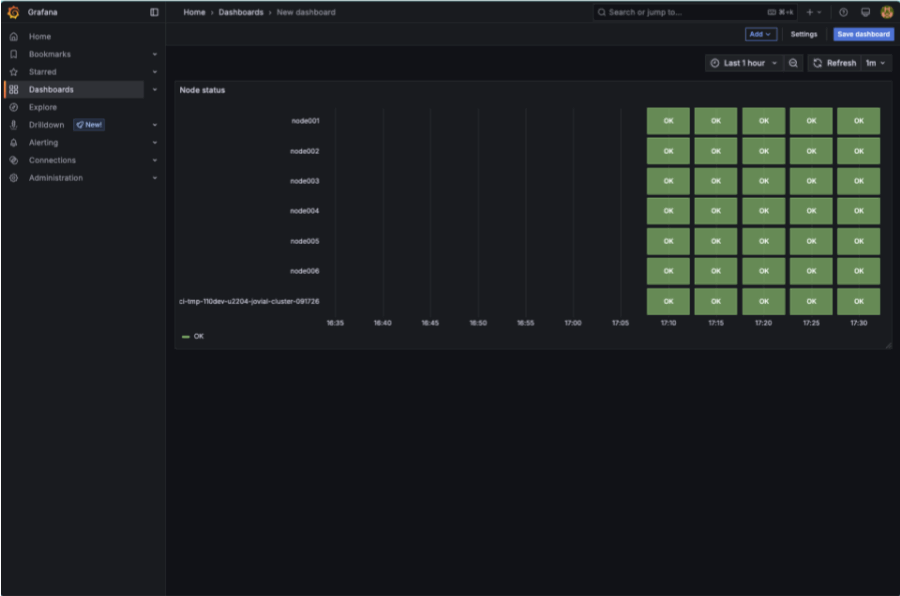
Select
Save dashboard. Set the Title toBCM node statusand click onSave.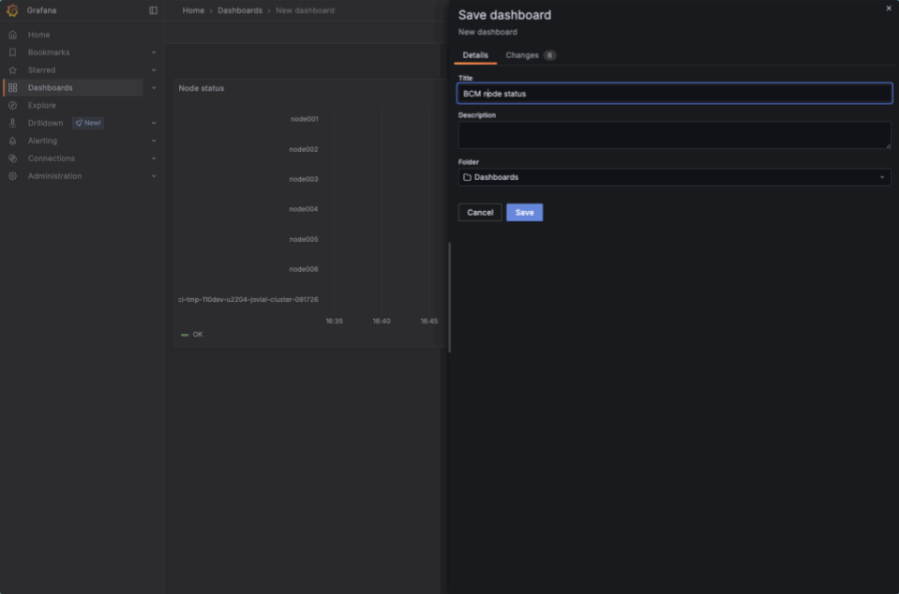
Logs#
With BCM, in-built logging aggregation comes out of the box. Each node that BCM deploys by default forwards logs to the head nodes for centralization of logs. From a head node, you can view these logs in /var/log/syslog.
Counting Xid errors#
When a GPU fault has occurred, these are logged to syslog. These can indicate user driven exceptions, errors with the driver, or in some circumstances a hardware fault. It’s good to understand the Xids encountered and the counts of these.
Xid values and descriptions can be found in this document: Xid errors
grep "Xid (PCI" /var/log/syslog | awk -v cutoff="$(date -d '12 hours ago' '+%b %d %H:%M:%S')" '
  $1 " " $2 " " $3 >= cutoff {
    split($4, host, ".");
    if (match($0, /Xid \(PCI:[^)]+\): ([0-9]+)/, id)) {
      print host[1], id[1]
    }
  }
' | sort | uniq -c | awk '{print $2 ":", $1, "occurrences of error ID", $3}'
Example output
a07-p1-dgx-03-c08: 10158 occurrences of error ID 143
b06-p1-dgx-06-c01: 4 occurrences of error ID 149
b06-p1-dgx-06-c01: 4 occurrences of error ID 154
b06-p1-dgx-06-c02: 4 occurrences of error ID 149
b06-p1-dgx-06-c02: 3 occurrences of error ID 154
b06-p1-dgx-06-c04: 4 occurrences of error ID 149
b06-p1-dgx-06-c04: 4 occurrences of error ID 154
b06-p1-dgx-06-c05: 4 occurrences of error ID 149
b06-p1-dgx-06-c05: 4 occurrences of error ID 154
b06-p1-dgx-06-c06: 4 occurrences of error ID 149
b06-p1-dgx-06-c06: 4 occurrences of error ID 154
b06-p1-dgx-06-c07: 4 occurrences of error ID 149
b06-p1-dgx-06-c07: 2 occurrences of error ID 154
b06-p1-dgx-06-c08: 4 occurrences of error ID 149
b06-p1-dgx-06-c08: 4 occurrences of error ID 154
b06-p1-dgx-06-c09: 4 occurrences of error ID 149
b06-p1-dgx-06-c09: 4 occurrences of error ID 154
b06-p1-dgx-06-c11: 4 occurrences of error ID 149
b06-p1-dgx-06-c11: 4 occurrences of error ID 154
b06-p1-dgx-06-c12: 4 occurrences of error ID 149
b06-p1-dgx-06-c12: 3 occurrences of error ID 154
b06-p1-dgx-06-c13: 4 occurrences of error ID 149
b06-p1-dgx-06-c13: 4 occurrences of error ID 154
b06-p1-dgx-06-c13: 112 occurrences of error ID 45
b06-p1-dgx-06-c14: 4 occurrences of error ID 149
b06-p1-dgx-06-c14: 4 occurrences of error ID 154
b06-p1-dgx-06-c14: 112 occurrences of error ID 45
b06-p1-dgx-06-c15: 4 occurrences of error ID 149
b06-p1-dgx-06-c15: 4 occurrences of error ID 154
b06-p1-dgx-06-c15: 112 occurrences of error ID 45
b06-p1-dgx-06-c16: 4 occurrences of error ID 149
b06-p1-dgx-06-c16: 4 occurrences of error ID 154
b06-p1-dgx-06-c16: 112 occurrences of error ID 45
b06-p1-dgx-06-c17: 4 occurrences of error ID 149
b06-p1-dgx-06-c17: 4 occurrences of error ID 154
b06-p1-dgx-06-c17: 112 occurrences of error ID 45
b06-p1-dgx-06-c18: 4 occurrences of error ID 149
b06-p1-dgx-06-c18: 4 occurrences of error ID 154