Metrics#
Device-Level Metrics#
The following metrics are emitted by the PRS daemon for individual devices (<device_type><index>) at each iteration of the control loop and ingested into BCM:
Metric Name |
Parameter |
Description |
|---|---|---|
|
|
Actual power draw of the device at a given timestamp. |
|
|
Predicted power usage of the device based on recent telemetry at a given timestamp. |
|
|
Power limit set by PRS for the device, derived from predictions and constraints at a given timestamp. |
|
|
Boolean metric indicating if the allocated power limit might have been insufficient. Set to 1 if the device’s power draw approaches a defined threshold near the current power limit at a given timestamp. |
Node-Level Metrics#
The following metrics, emitted by the PRS daemon and ingested into BCM, represent the sum across all devices on a per-node basis using the parameter total:
Metric Name |
Parameter |
Description |
|---|---|---|
|
|
Sum of actual power draw of all devices on a node at a given timestamp. |
|
|
Sum of predicted power usage of all devices on a node at a given timestamp. |
|
|
Sum of power limits set by PRS for all devices on a node at a given timestamp. |
|
|
Metric indicating whether the total allocated power limit across the node might be insufficient. It is calculated as the sum of Boolean values (0 or 1) from all devices in the node, where each device reports 1 if its power draw approaches a threshold near its current power limit. |
PD-Level Metrics#
These metrics are emitted by BCM for each PD (<domain_name>), based on aggregated PRS node-level metrics and information from the PDN configuration:
Metric Name |
Parameter |
Description |
|---|---|---|
|
|
Number of components (GPUs, CPUs) controlled by the PD at a given timestamp. |
|
|
Number of nodes included in the PD at a given timestamp. |
|
|
Total power draw of the PD’s managed devices at a given timestamp. |
|
|
Total power of the PD that is actively managed by PRS at a given timestamp. |
|
|
Total unmanaged power of the PD at a given timestamp. |
|
|
Total power of the PD (managed and unmanaged). This equals the PD power budget. |
|
|
Power utilization ratio of the PD (draw ÷ managed) at a given timestamp. |
Job-Level Metrics#
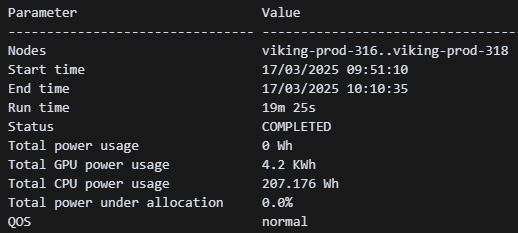
For each Slurm job, BCM records various metrics, including power-related ones such as total power usage, total GPU power usage, total CPU power usage, and power under-allocation.
The under-allocation metric represents the average percentage of devices that reported under-allocation across all assigned nodes and timestamps during the job’s execution.
Note that BCM may take a few minutes after job completion to evaluate and store these metrics.
To list all of them, use the following command:
cmsh -c "wlm; use slurm; jobs; info <job_id> | grep -E '^(Parameter|-|Total|QOS|Nodes|Start|End|Status|Run time)'"
Output example:
Metrics with cmsh#
To retrieve PRS-related metrics available in the cluster, use the following command to list all measurable PRS metrics:
cmsh -c "monitoring measurable list | grep prs_"
This will display all PRS metrics along with their available parameters (e.g., gpu0, total), which can then be queried individually.
Querying a Specific Metric#
To view detailed information about a specific metric and its parameter, use:
cmsh -c "monitoring measurable show {metric}:{parameter}"
Example: To retrieve details for the prs_power_under_allocation metric with the total parameter:
cmsh -c "monitoring measurable show prs_power_under_allocation:total"
This will return metadata about the metric, including description, unit, sampling behavior, value range, and source.
Querying PRS Metric Over Time#
The instantquery command allows you to retrieve time-series data for specific PRS metrics and parameters over a defined time window. This is useful for monitoring trends, analyzing performance, and debugging behavior in real time or retrospectively.
Syntax (PromQL):
instantquery "<metric>{parameter=\"<value>\"}[<duration>]"
<metric>– The name of the PRS metric (e.g., prs_power_under_allocation)parameter– A valid parameter exposed by the metric (e.g., total, gpu0, domain)<duration>– Time window to query (e.g., 5m, 1h, 24h, 7d)
Example:
To view the values of prs_power_under_allocation for the total parameter over the last hour:
cmsh -c 'monitoring labeledentity instantquery "prs_power_under_allocation{parameter=\"total\"}[1h]"'
Metrics with BaseView (Web UI)#
Viewing PRS Metrics#
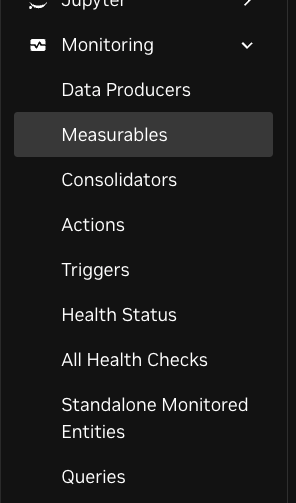
In the BaseView side menu, navigate to: Monitoring → Measurables
Use the search bar to filter for
prs_metrics.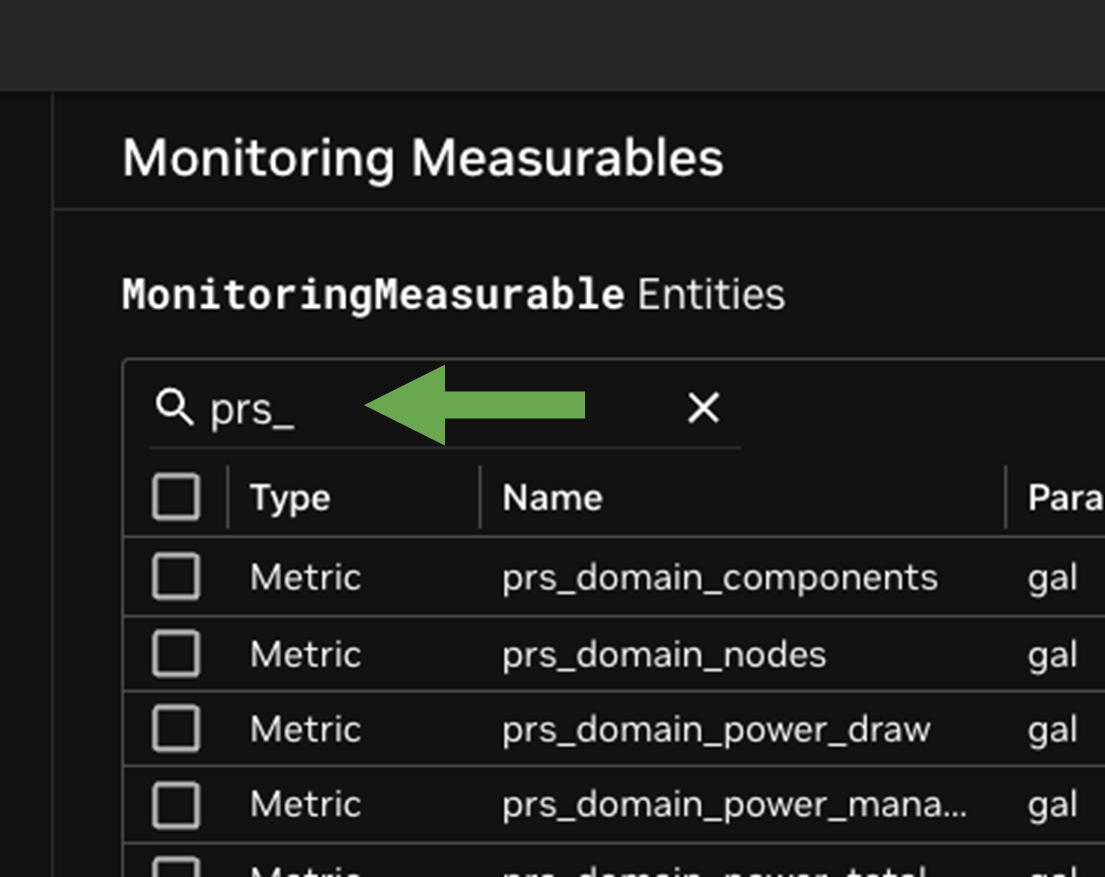
A list of all available PRS-related metrics will be displayed. You can click on any metric to view detailed information.
Creating a PRS Monitoring Dashboard#
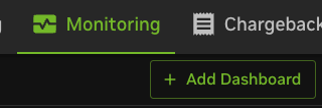
Open Monitoring:
From the top menu bar in BaseView, click Monitoring.

Create a New Dashboard:
Click Add Dashboard.
Provide a name for your dashboard, such as PRS.
Choose a layout — for this example, select 2x2 to create a grid with four widgets.
Configure the First Widget:
Click on Widget 1.
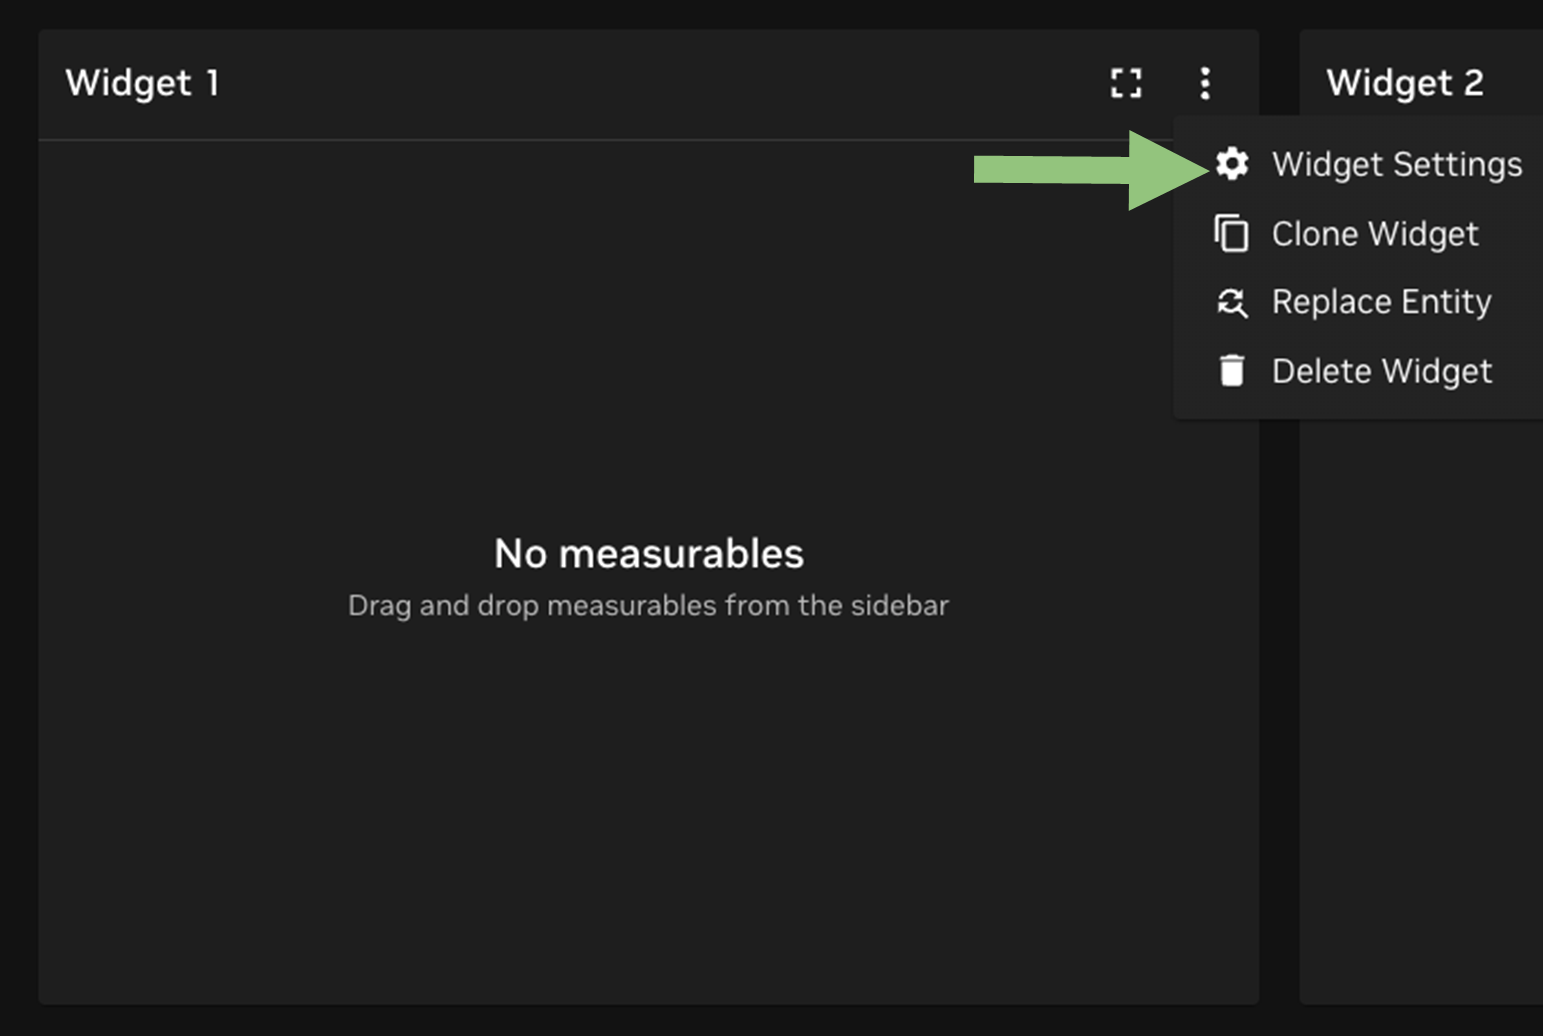
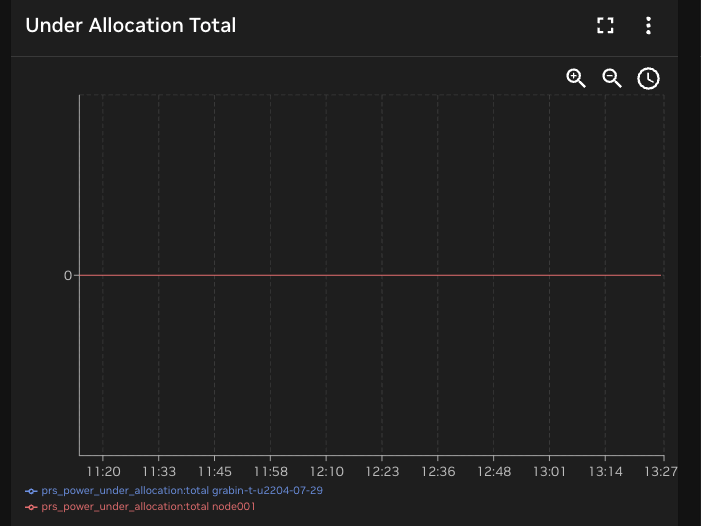
Assign a title: Under Allocation Total
In the left-hand search bar, enter:
prs_power_under_allocation:total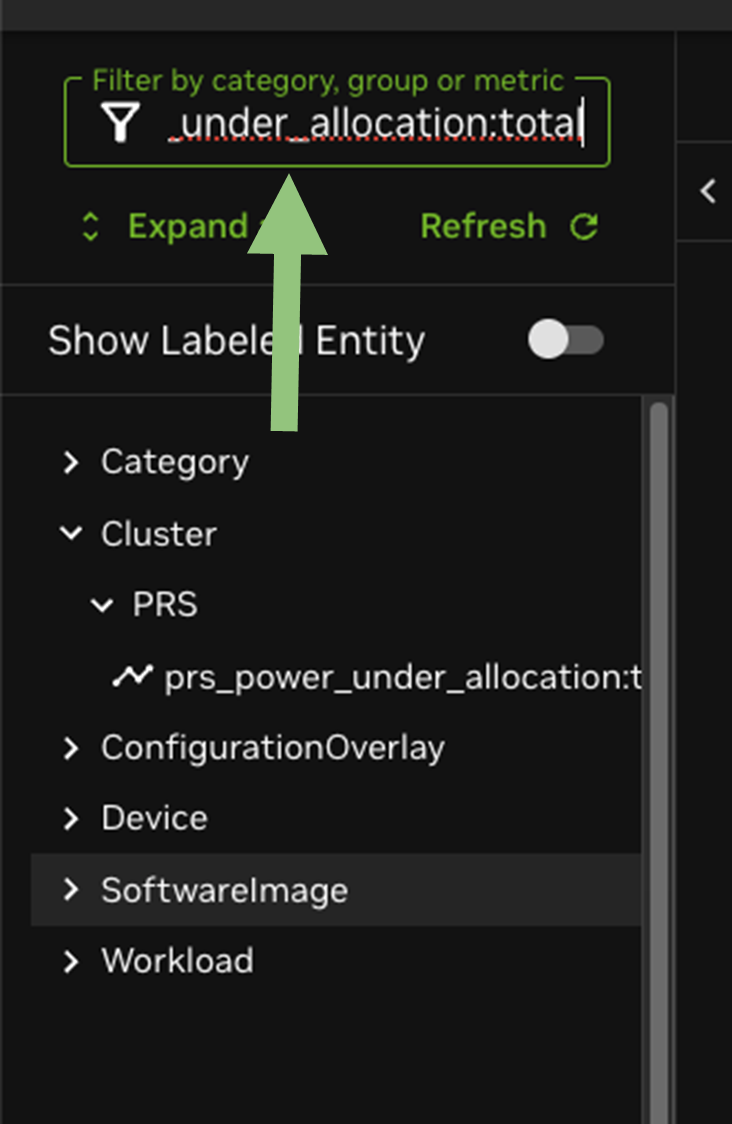
Once the metric appears, drag and drop it into the widget area.