Grafana Cloud Setup#
Grafana Cloud integration offers enhanced monitoring capabilities and centralized dashboard management for ARE deployments. This cloud-based approach provides scalable monitoring infrastructure without the need for local Grafana installations. The cloud setup enables teams to access dashboards and logs from anywhere while maintaining enterprise-grade security and performance. When using Grafana Cloud, the setup offers the following tools and features:
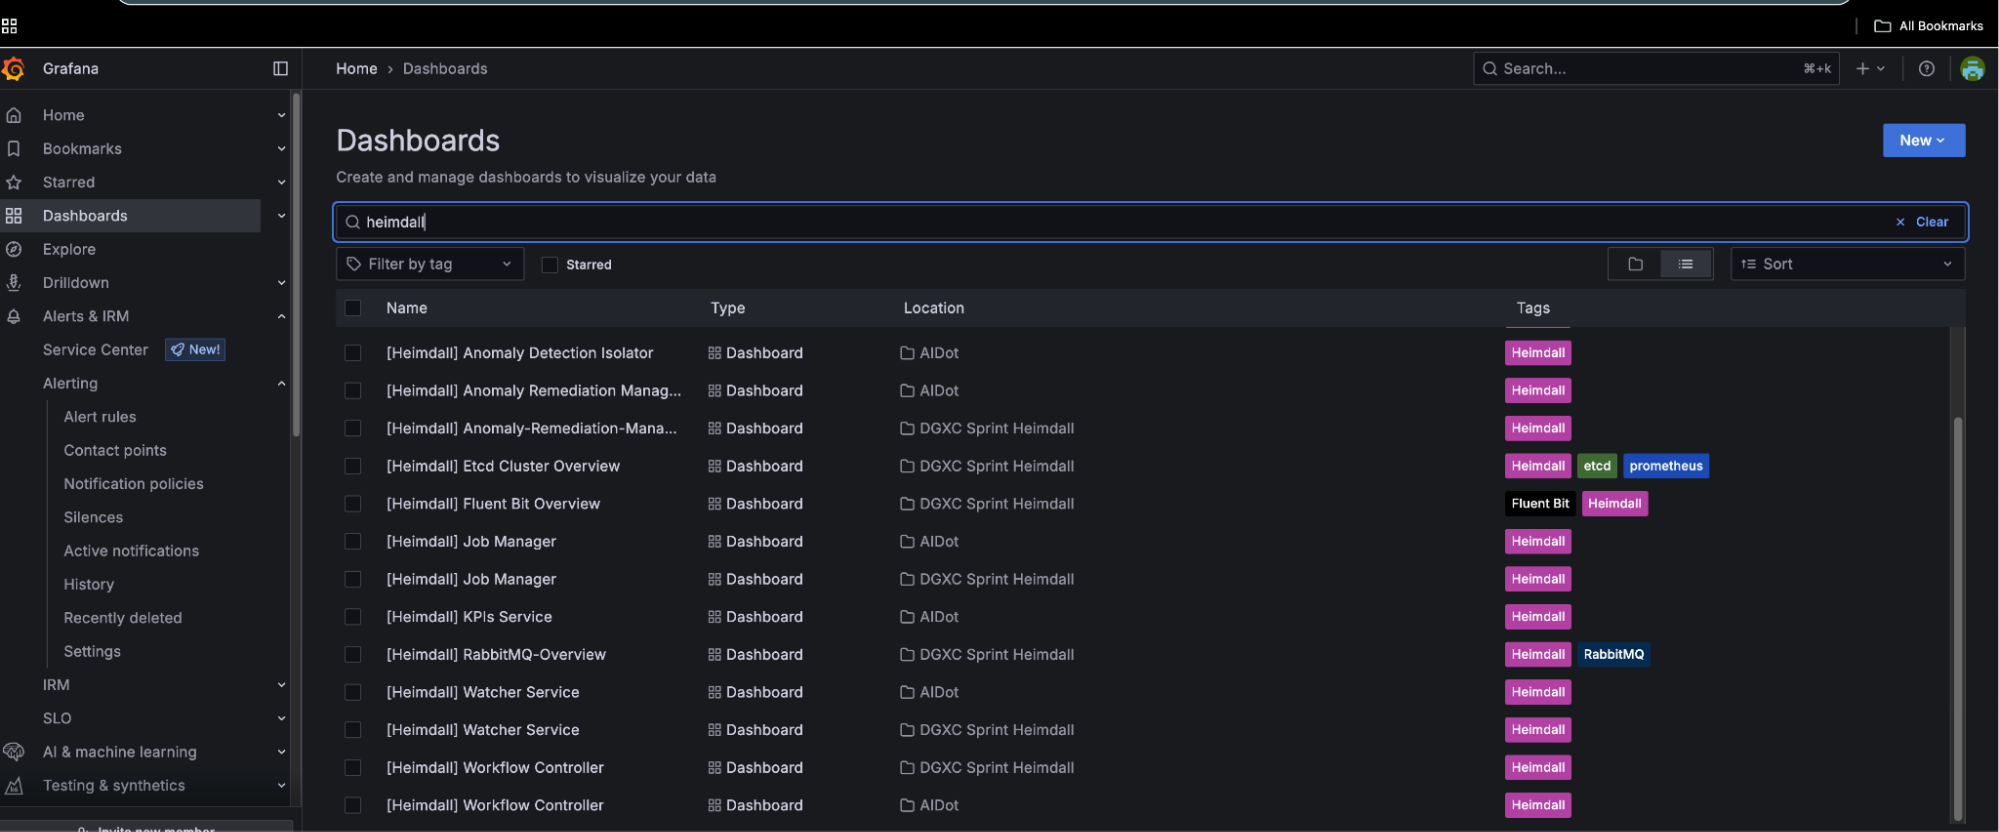
Dashboards: Ensure dashboards for services like ADI, IRM, job manager, KPI service, watcher, and controller are set up in Grafana Cloud.
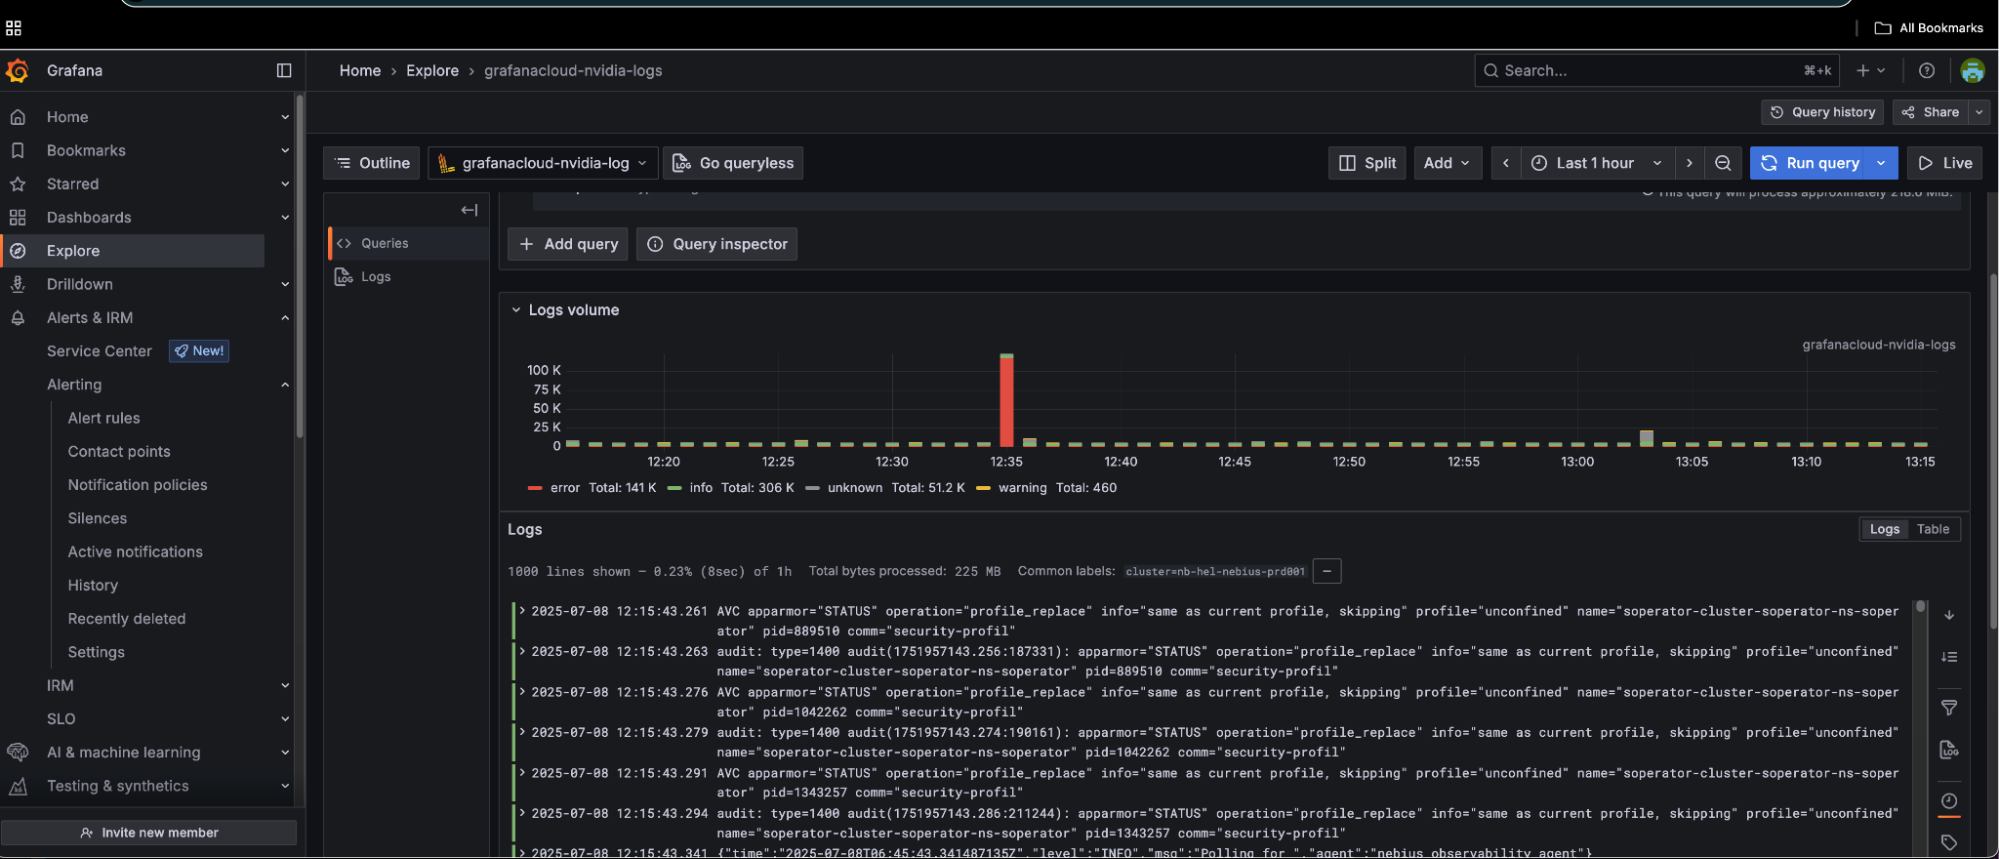
Logs Explorer: Use the logs explorer to monitor service logs and troubleshoot issues.
Job Logs: Job logs from customers have a special label
appName=slurm-app-log
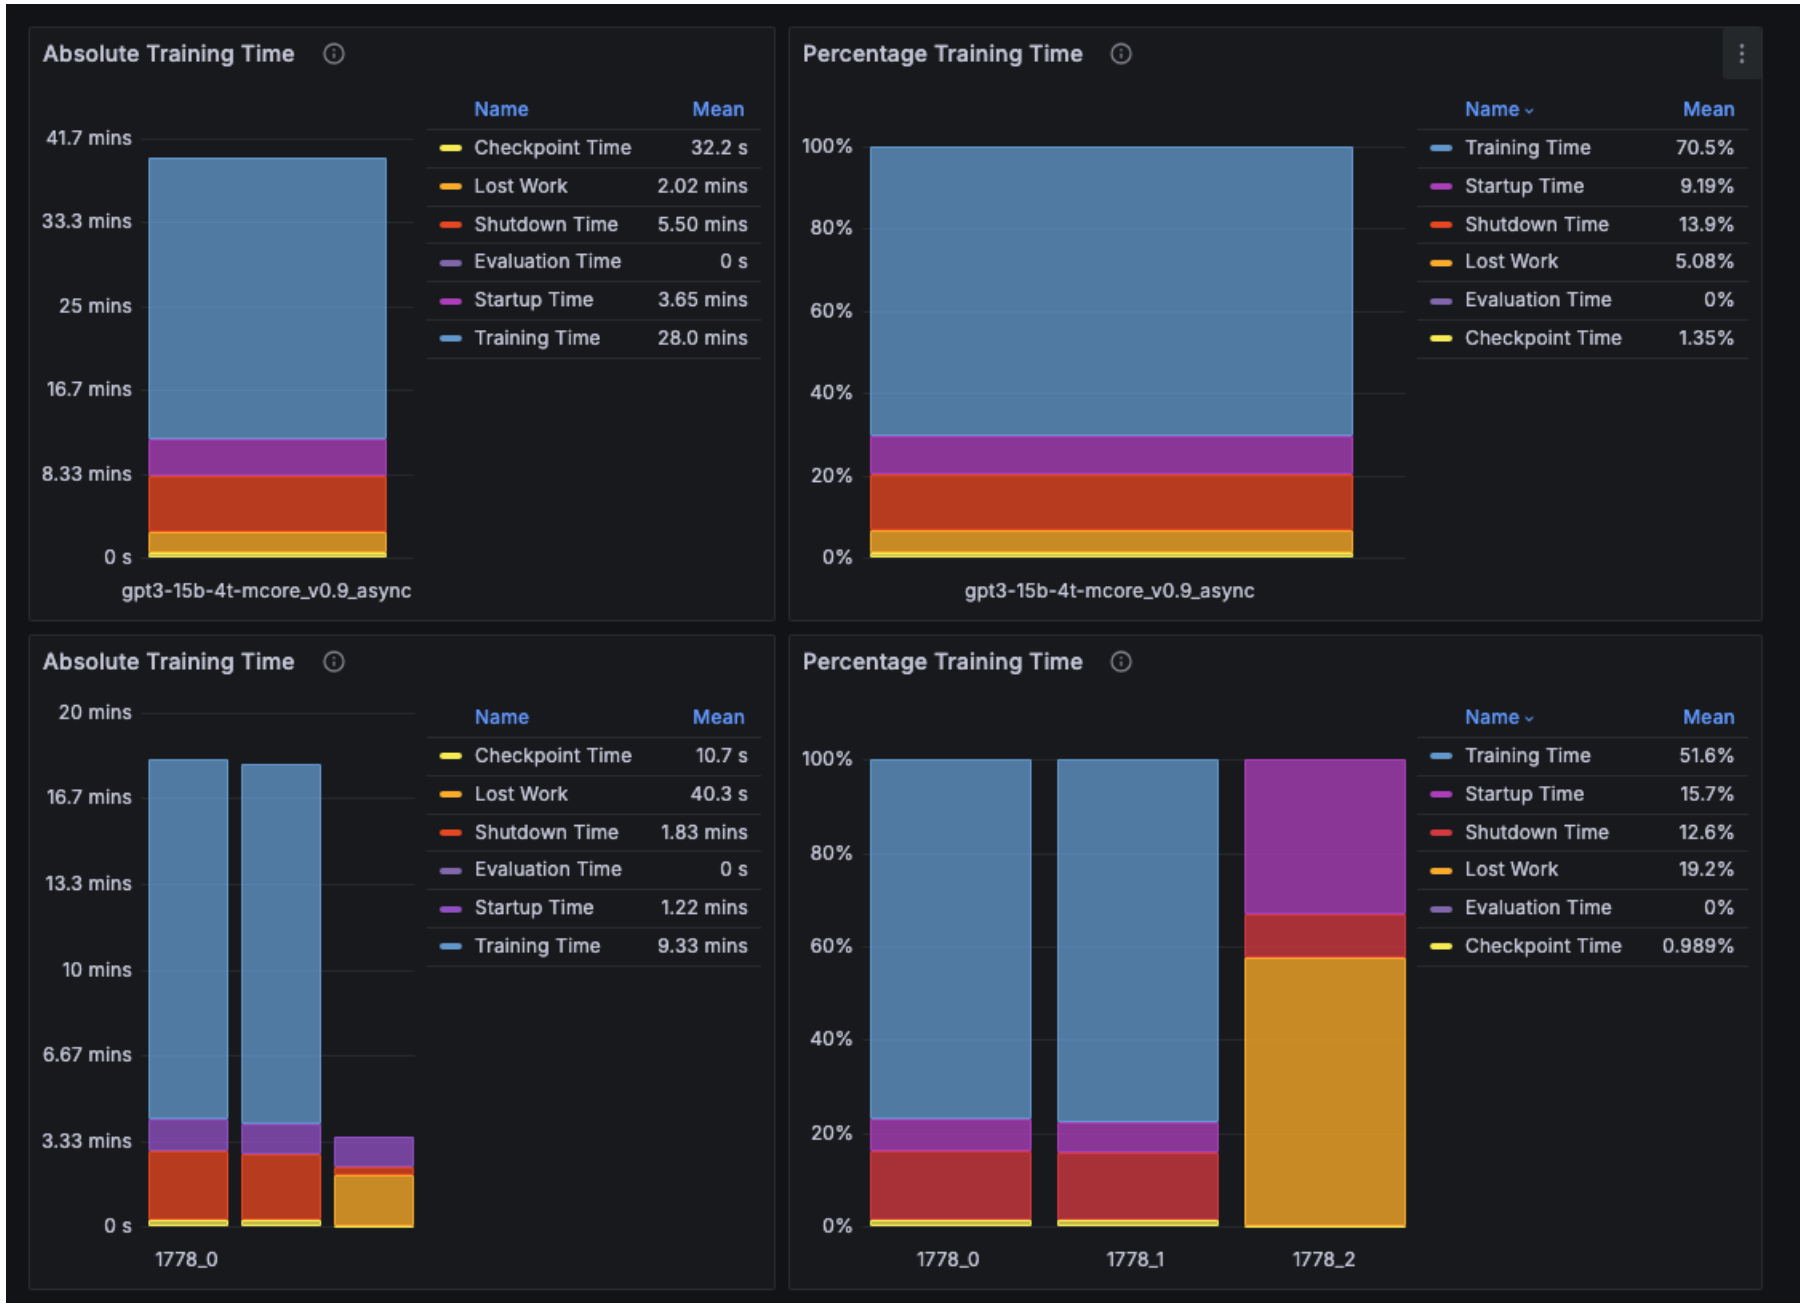
The Training Efficiency KPI dashboard displays the downtime for each job and the aggregated downtime across all jobs. For example, the training time efficiency for job 1778—which automatically restarted twice—is shown to be 70.5%. The low efficiency is due to the second restart (1778_2), where the job was manually canceled before reaching the first checkpoint save to illustrate the impact of a failure restart. As expected, the performance data for this restart shows no checkpoint save. NMC ARE uses the first checkpoint save as the criterion for determining restart success or failure. This threshold is configurable per system deployment.