

Image Generation for Multimodal Data Pipelines

At PyData London 2026, we ran a hands-on session on synthetic data pipelines with NeMo Data Designer and NeMo Anonymizer. We put together a set of notebooks that ramped up gradually: text QA first, then multimodal visual QA, then privacy-safe feedback data.
For the VQA notebook, it would have been more straightforward to start from an existing PDF dataset on Hugging Face. The catch is that we would still need to inspect and filter that dataset until it had the document types we wanted for the workshop: layouts, charts, tables, annotations, scan artifacts, and enough visual evidence to support real questions. It was more interesting, and honestly easier, to build that seed dataset with Data Designer and declare the distribution directly.
It worked out better than I expected. Each generated document stayed tied to the sampler controls that produced it, which made the dataset easy to inspect, tweak, and reuse. Folding images into a synthetic data generation (SDG) workflow unlocks a lot of interesting use cases, and Data Designer makes the transition seamless: moving from text to images feels familiar, so you can focus on designing the dataset instead of wrestling with the plumbing of the pipeline.
In this dev note, we’ll briefly touch on the document-generation use case from the PyData London workshop, then explore other image SDG use cases while having some fun along the way. Hint: funny pet images are involved. 😂
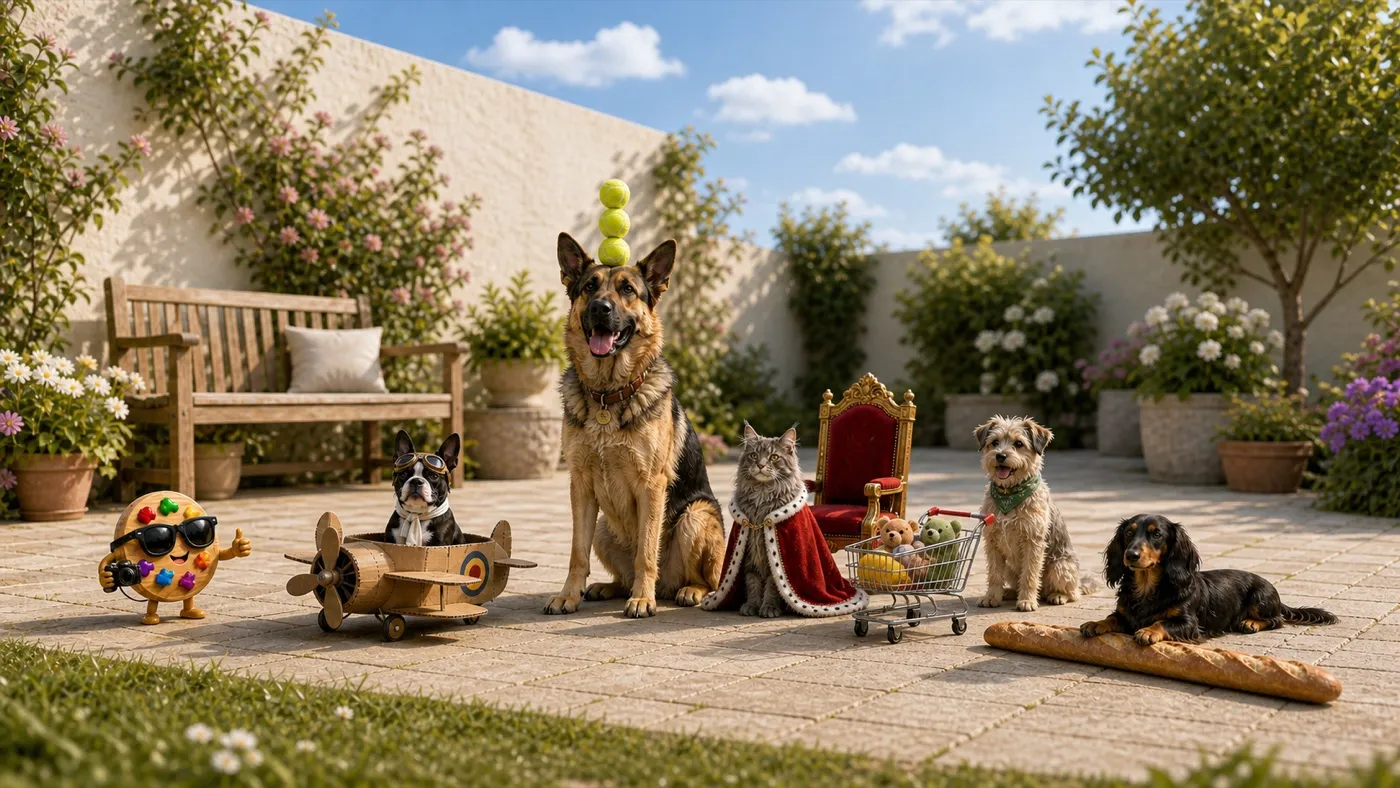
Not Just Model Training
Training data is the obvious headline when it comes to SDG. It is also too narrow. Generated images are also useful wherever you need controlled visual cases: evaluation datasets, benchmark slices, reviewer training, privacy-safe demos, etc. For many teams, those datasets become core development infrastructure.
The common need is control. What you really want is to define the parameters that guide your dataset’s distribution. That gives you intended metadata for every image: the controls the model was asked to render, the change that was requested, and the behavior the row is supposed to exercise. After inspection, validation, or filtering, the rows that actually match those controls can become ground-truth-labeled examples. Did the VLM answer from evidence in the document, or from a plausible guess? Did a reviewer catch the dense electronics cluster in a baggage scan? Did an apparel edit preserve the garment after changing the scene? Did a prompt regress on rainy-night ego-camera frames after a model upgrade?
There is also a very practical reason: image pipelines are fun to build. The effect of a sampler change is visible. If you change weather, camera angle, crop severity, scan quality, garment styling, or robot viewpoint, you can usually see the distribution move in the preview rows very easily. Text pipelines can be harder to reason about because the differences are often subtle or buried inside longer generations. With images, the iteration loop has a nice immediacy: change a control, preview a few rows, and your eyes tell you whether the pipeline is moving in the right direction.
That immediacy is not just a nicer authoring experience. It turns generated images into practical development assets across a few recurring workflows:
Model training can still be the destination. But generated images are just as valuable as controlled visual test cases: small enough to inspect, repeatable enough to compare over time, and structured enough to become evaluation rows, review exercises, benchmark slices, monitoring canaries, or debugging cases.
The Image Building Blocks
Here is the part I like most: moving from text to images does not feel like switching frameworks.
You still declare columns, dependencies, model aliases, samplers, structured outputs, validators, and processors. The engine still resolves the DAG. preview() still gives you a small thing to look at before you scale. create() still writes the artifact-backed dataset. The difference is that some columns now produce images, and other columns can edit, caption, inspect, extract, score, or transform those images.
In create() mode, the image bytes are saved with the dataset, typically under images/<column_name>/ with UUID-style filenames. The dataframe stores relative paths instead of giant image blobs, which keeps large image payloads out of memory-heavy row data as pipelines scale. That small detail matters: a generated image can be opened from disk, rendered in a preview table, or passed into the next image-aware column through ImageContext, while the same row keeps the sampler values that explain why the image exists.
That gives you three building blocks that feel familiar once you have written any Data Designer pipeline. Text-to-image columns generate visual examples from controlled metadata and prompt templates. Image-to-image columns use an existing or generated image as context, then produce controlled variants. Image-to-text columns send images into VLM-backed columns for captions, QA pairs, labels, extraction, or judge decisions.
That last part is the real developer-experience win. The image is not an orphaned file on disk with a mysterious filename. It remains part of the row. It can move into a VLM judge, become a benchmark example, feed an editing step, or sit in a preview gallery with the exact metadata that produced it.
A Quick Document Generation Preview
For the PyData workshop, the document seed dataset came from the optional bonus_generate_documents.ipynb notebook. It is a small notebook with a useful job: make business-document pages where I can choose the document type, layout, visual content, annotation style, and scan condition instead of hoping those cases exist in a downloaded dataset.
The full notebook includes the model setup, sampler columns, export step, and preview helpers. The core image column is just a normal Data Designer column:
Those generated pages became the visual seed data for the document VQA notebook. We do not need to unpack the full VQA pipeline here. The useful bit is simpler: during preview, each image sits beside the metadata that shaped it. You can immediately see whether the run is giving you the document types and visual conditions you intended.
Here are a few rows from that generated dataset. The image is the fun part. The sampler values are what make the image useful.
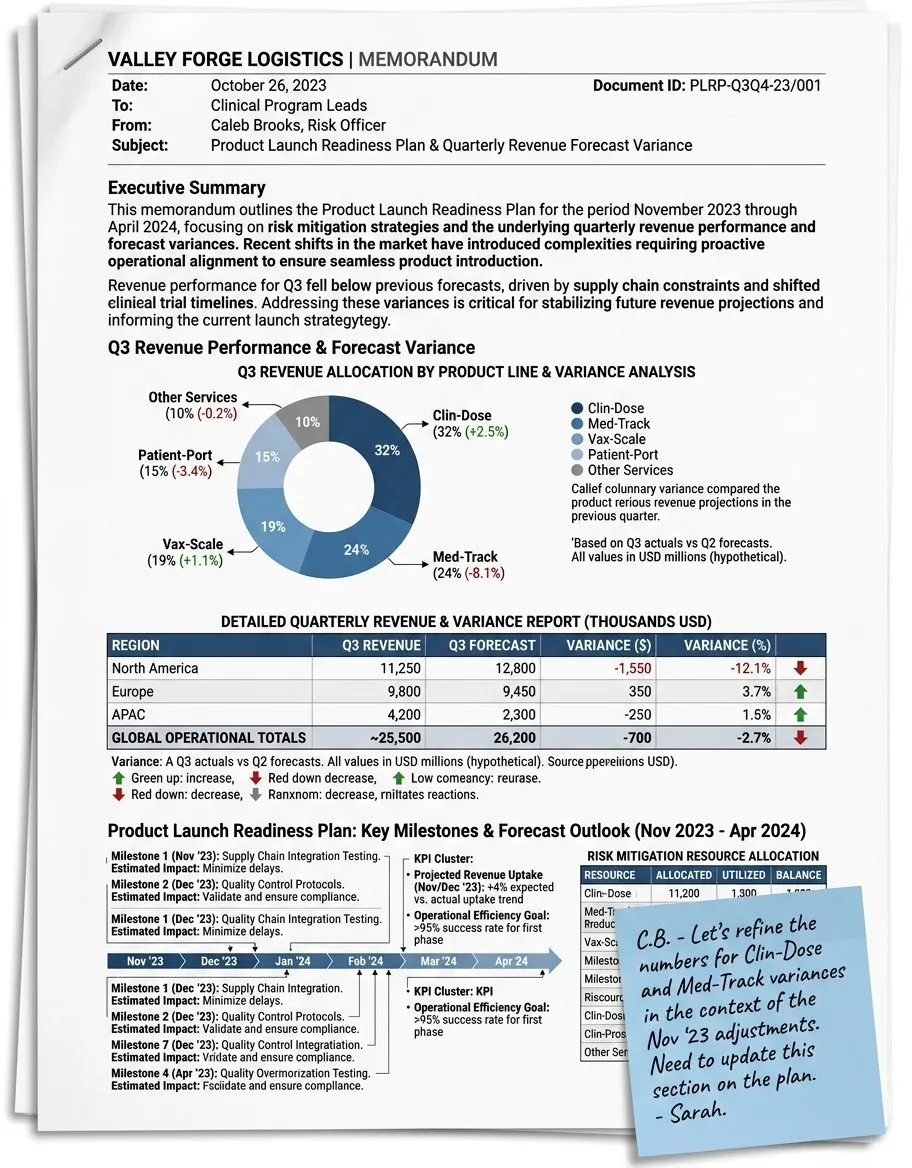
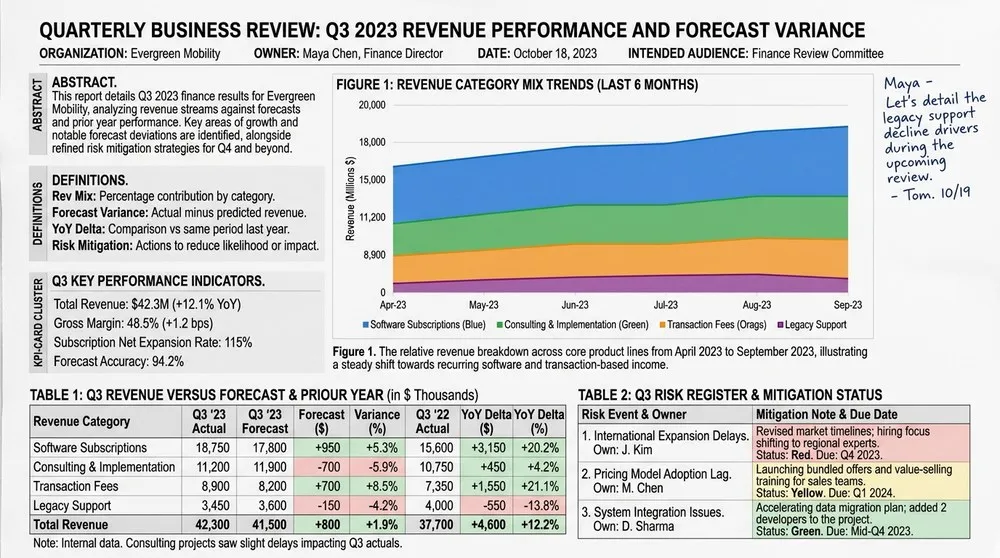
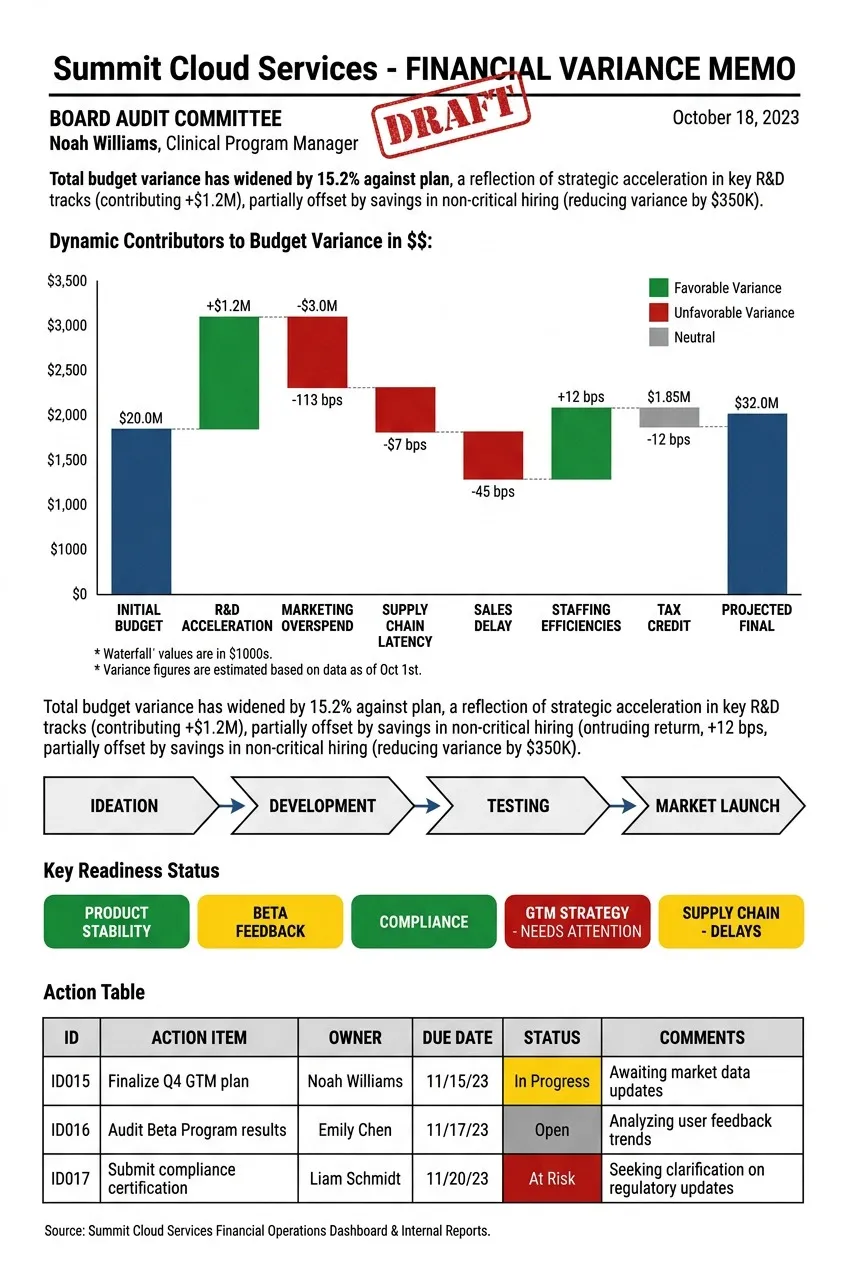
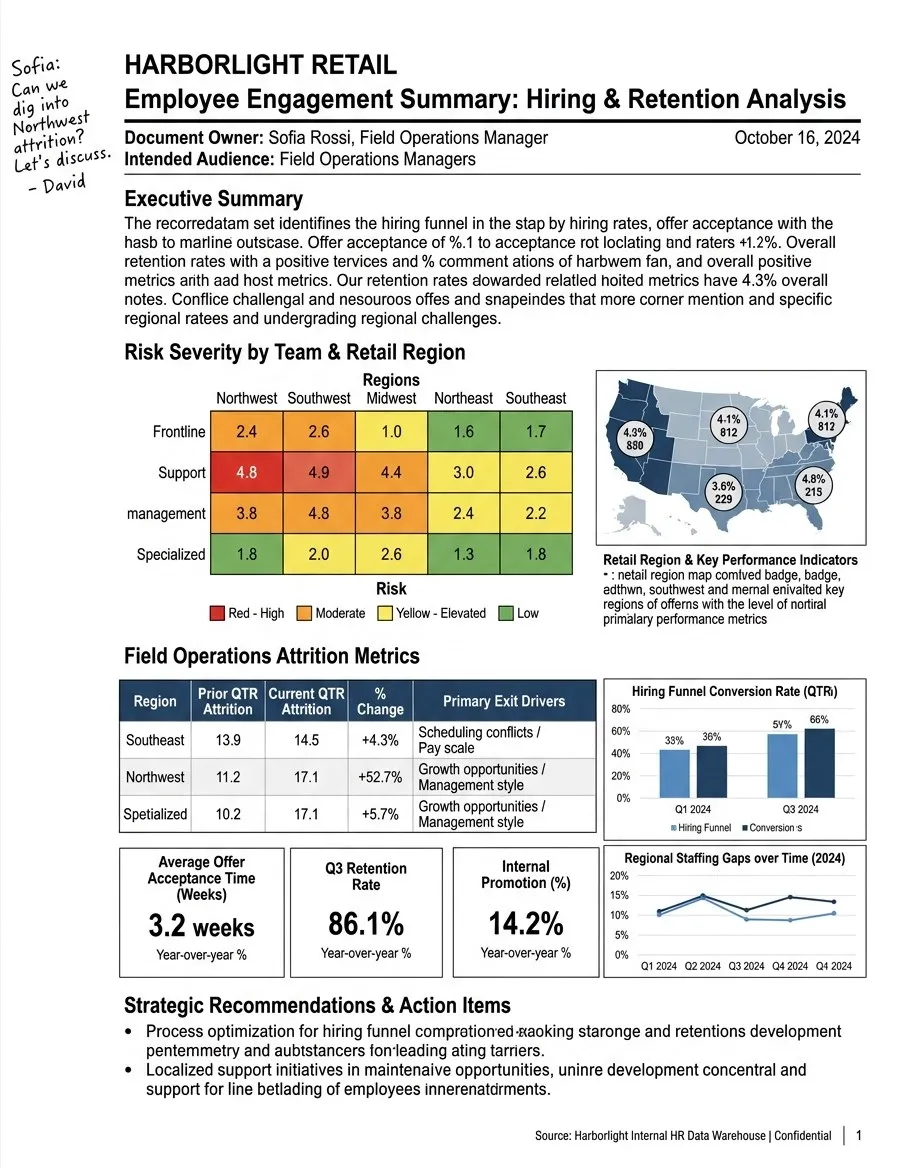
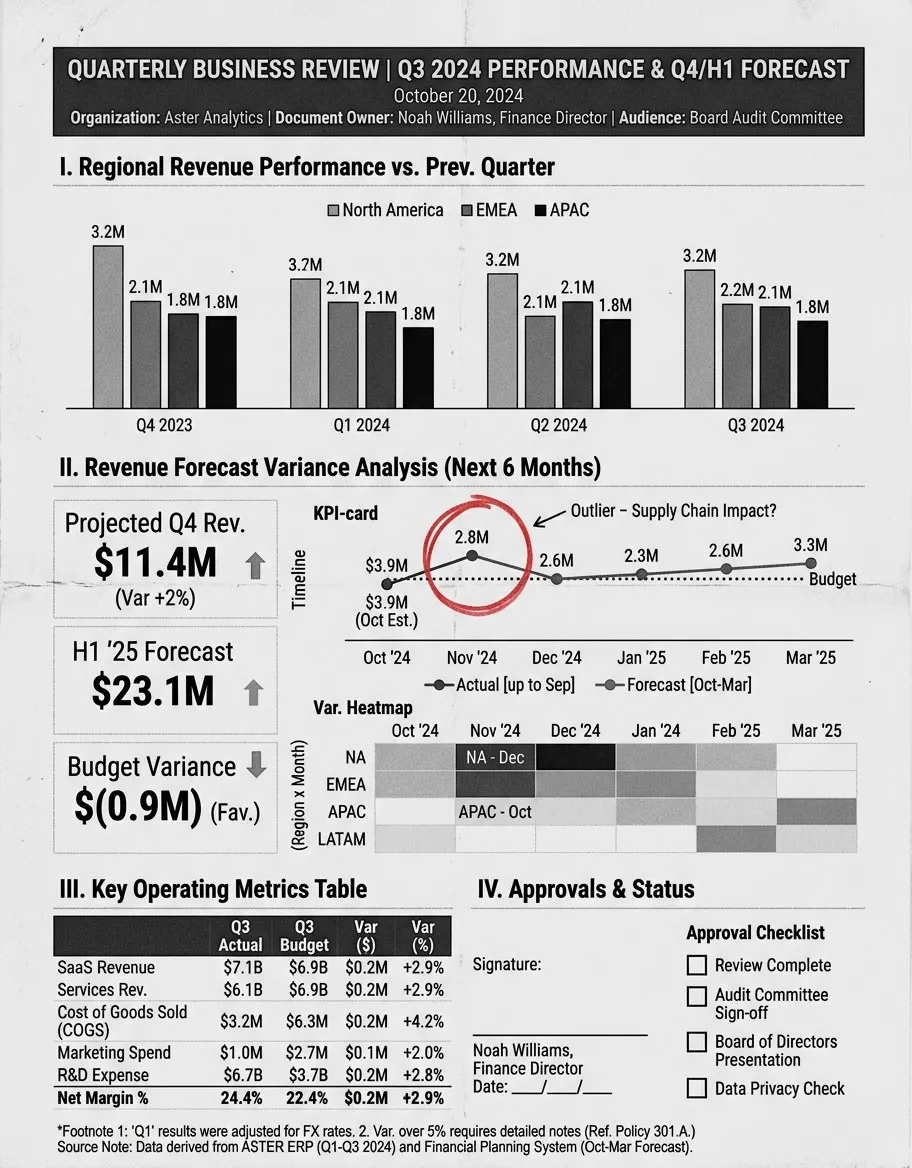
- document typeproduct launch readiness plan
- layout styleformal memo with letterhead, dense paragraphs, and one embedded chart
- primary visualdonut chart with callout labels and percentages
- secondary visualdense financial table with subtotals and variance arrows
- document conditionlow-contrast scan with light shadow near the binding edge
- annotation layerblue sticky note partially covering the lower right table
Image Editing Is Just Another Dependency
Image-to-image editing uses the same idea. Generate one image or use an existing one from a seed dataset, pass it forward as context, and ask the next column to make a controlled change. The dependency is declared with ImageContext:
There is a little bit of plumbing under the hood. In preview mode, the first image is base64 and can be passed directly to the second column. In create mode, the first image is stored as a relative path under the output artifact directory; Data Designer resolves it back to base64 before sending it to a remote model endpoint.
As a user, you do not have to write that glue code. You declare the dependency. The engine handles the mechanics.
That is enough to build some very practical loops:
- Generate a clean document, then edit it into a low-quality scan.
- Generate a product image, then produce regional packaging variants.
- Generate a base traffic scene, then add weather, lighting, or hazard conditions.
- Generate an image, caption it with a VLM, then judge whether the caption matches.
The important constraint is model capability. Diffusion-style image routes are excellent for text-to-image generation, but they generally do not consume image context. If you configure one for an edit column that depends on an input image, the request will usually fail at the provider boundary, or the provider may ignore the image context and behave like text-to-image. Use an image-to-image-capable multimodal model for edit workflows. Data Designer exposes both routes through the same column API while leaving model choice explicit.
The examples in this dev note use google/gemini-3.1-flash-image-preview. Data Designer makes the workflow consistent across models, but the selected model still sets the ceiling for visual quality, text rendering, instruction following, editing fidelity, domain realism, and how closely the output follows your sampler controls.
A Tour Across Domains
Instead of walking through one giant example line by line, let’s look at a few use cases. Image generation gets more interesting when you see it jump domains: documents, apparel, ego-camera traffic scenes, robot viewpoints, baggage scans, X-rays, crops, and drone frames. The code shape stays familiar, but the distributions change completely. Each use case also has an accompanying recipe linked at the bottom if you want to explore it on your own.
For each one, the image is paired with the sampler controls that produced it. That pairing matters. A nice-looking image is useful; one paired with the exact knobs that created it is something you can debug, filter, rerun, judge, or hand to a reviewer.
Some examples in this section touch specialized or safety-sensitive domains: medical imaging, airport screening, autonomous vehicles, robotics, agriculture, and infrastructure inspection. Treat them as synthetic examples for prototyping, evaluation, curriculum design, and review workflows. Domain experts should define the distributions, review the outputs, and decide what is appropriate before anything operational.
Product image variations
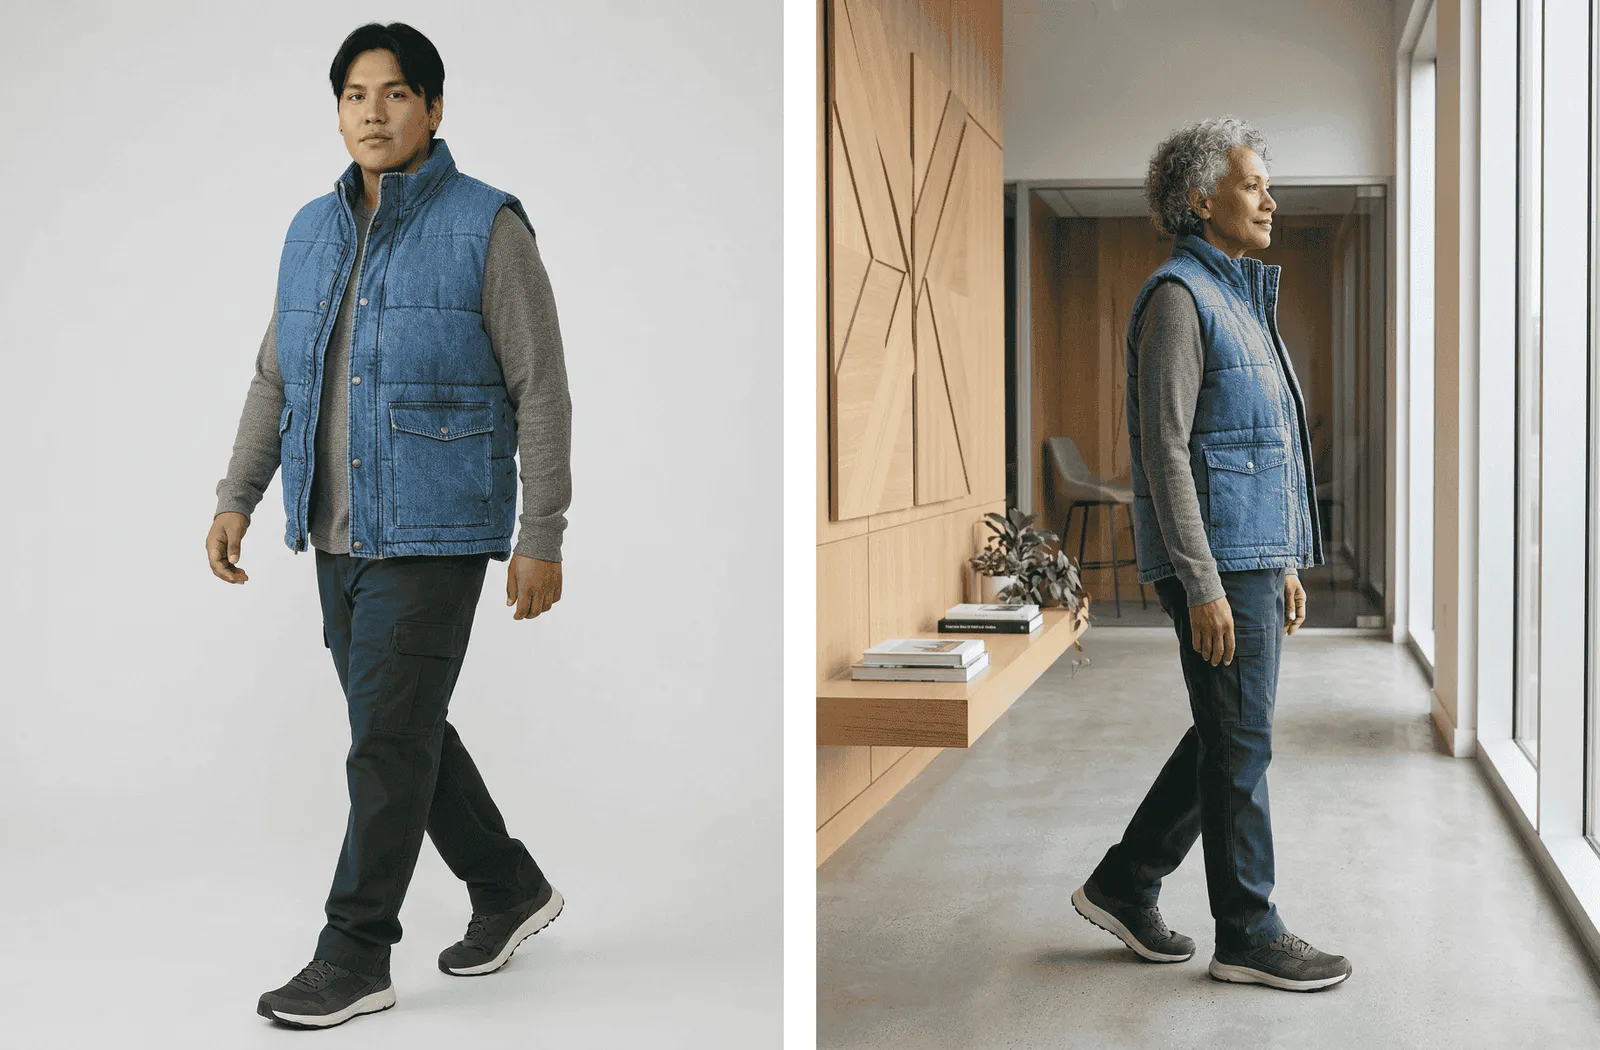
Product imagery is a nice place to start because the pain is easy to understand. A brand may have one clean catalog image of an adult model wearing a garment, but the downstream needs multiply quickly: white-background thumbnails, lifestyle shots, fit-guide photos, adaptive-fashion examples, seasonal campaign images, and inclusive catalog coverage across adult age groups, ethnicities, body types, poses, and accessibility contexts.
In Data Designer, the reference product image can come from a seed dataset or from an upstream ImageColumnConfig. The edit column receives that image through ImageContext and changes the scene while trying to preserve the product’s identity:
The important thing is that the creative brief is not trapped inside one long prompt. Apparel item, colorway, variation goal, adult model age group, ethnicity, body type, accessibility context, styling context, composition, and lighting are all columns. That means you can inspect the distribution, filter it, rerun slices, and add a VLM judge to check whether the garment stayed consistent or whether the edit introduced unwanted logos, text, minors, or unsafe styling.
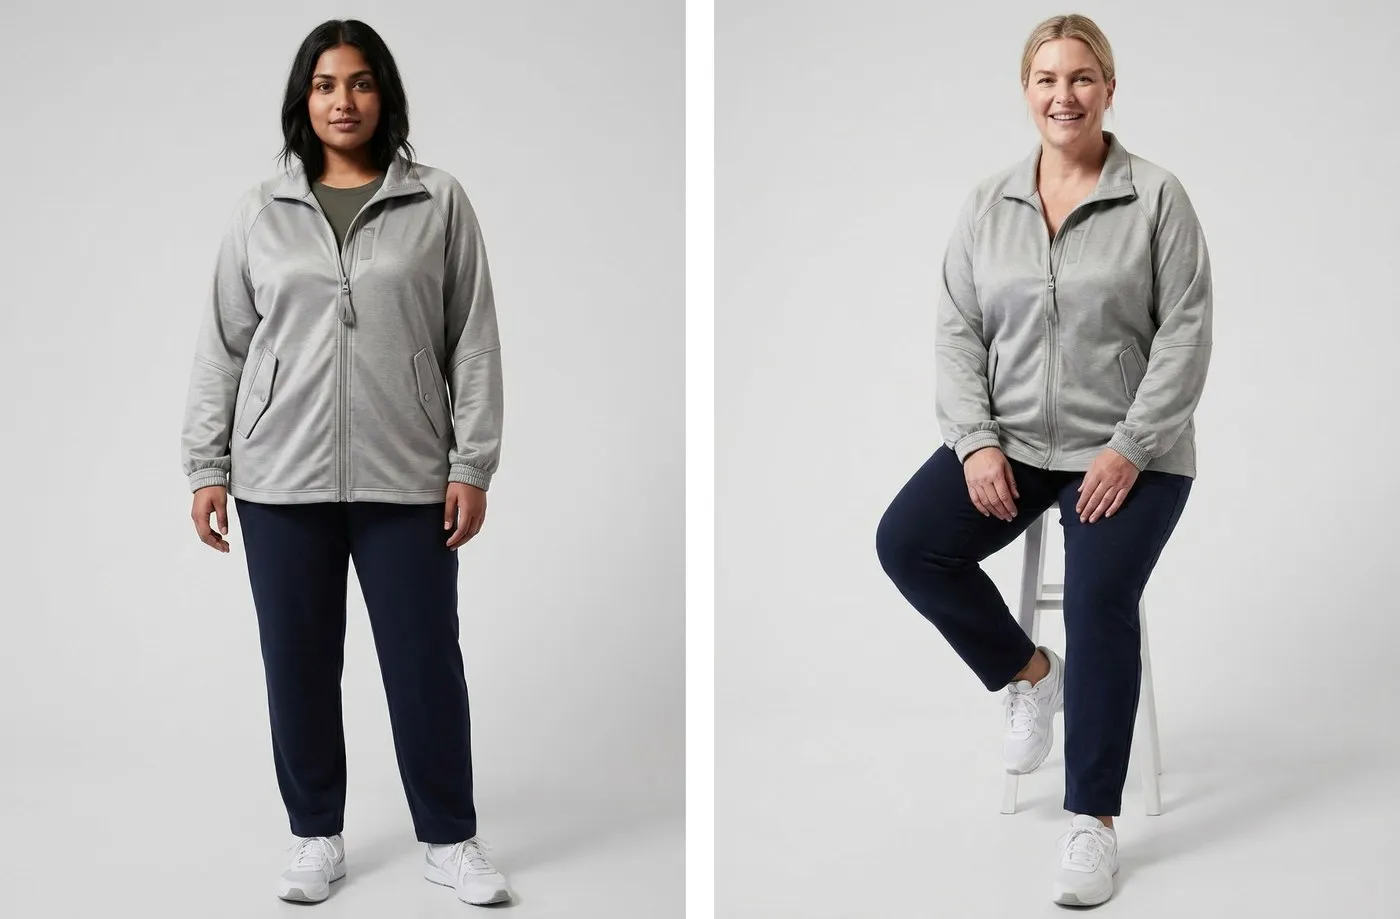
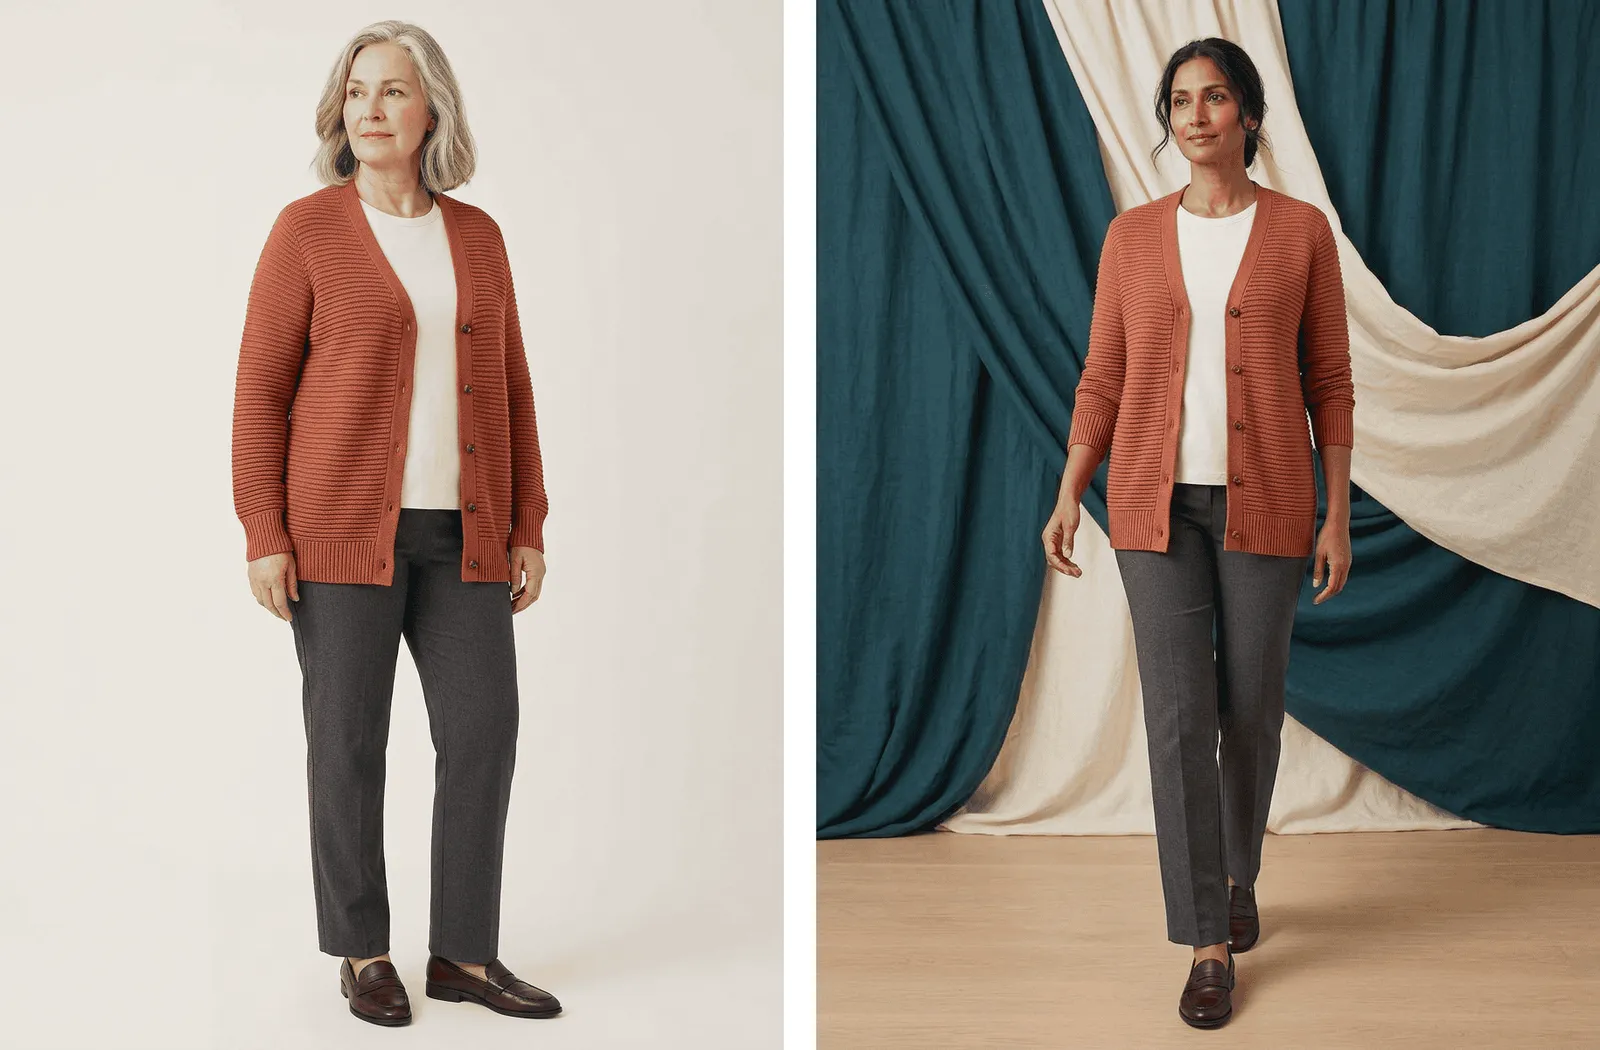
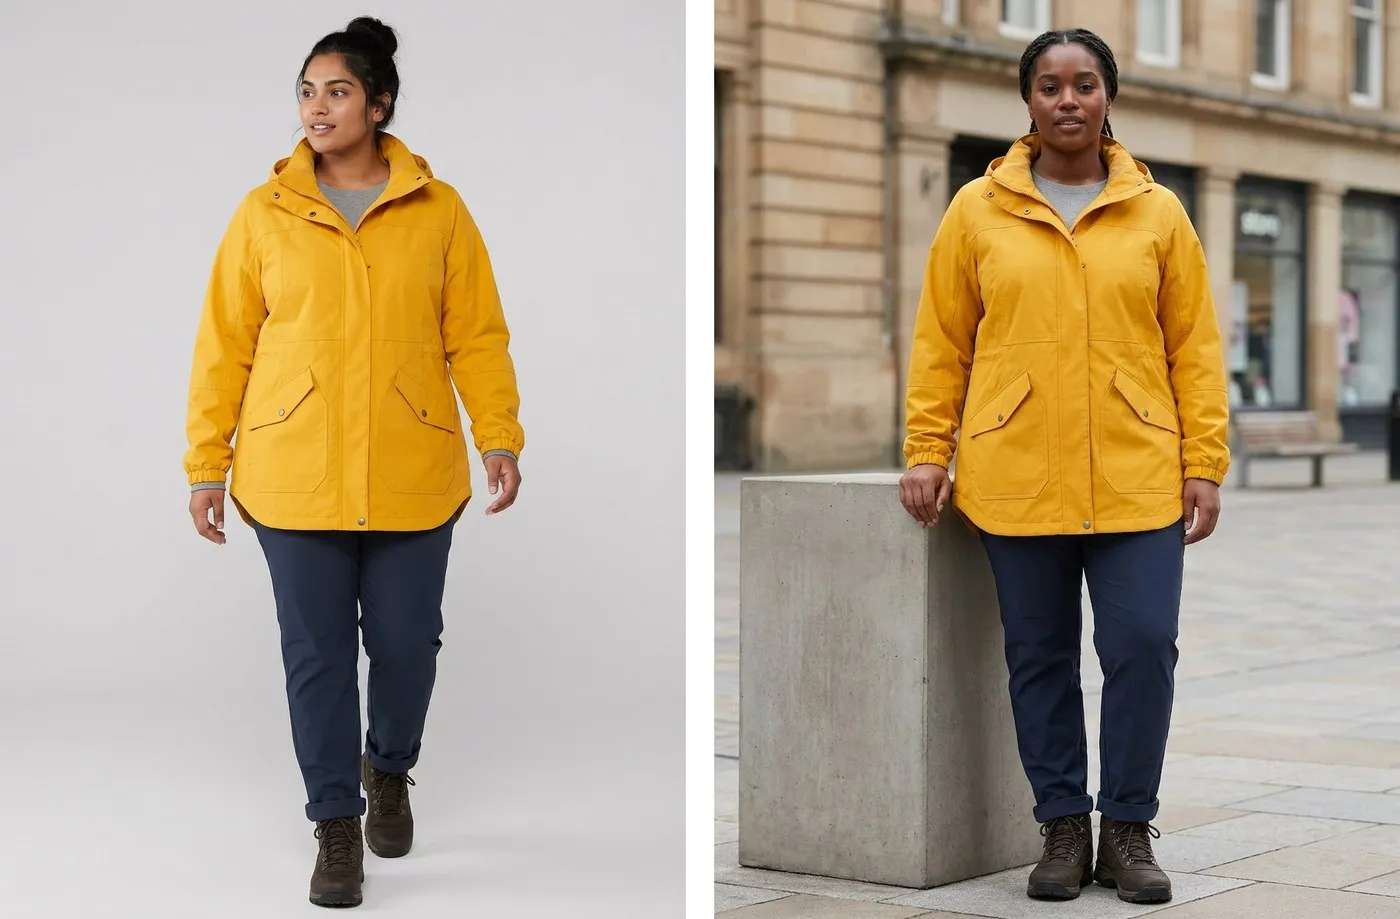
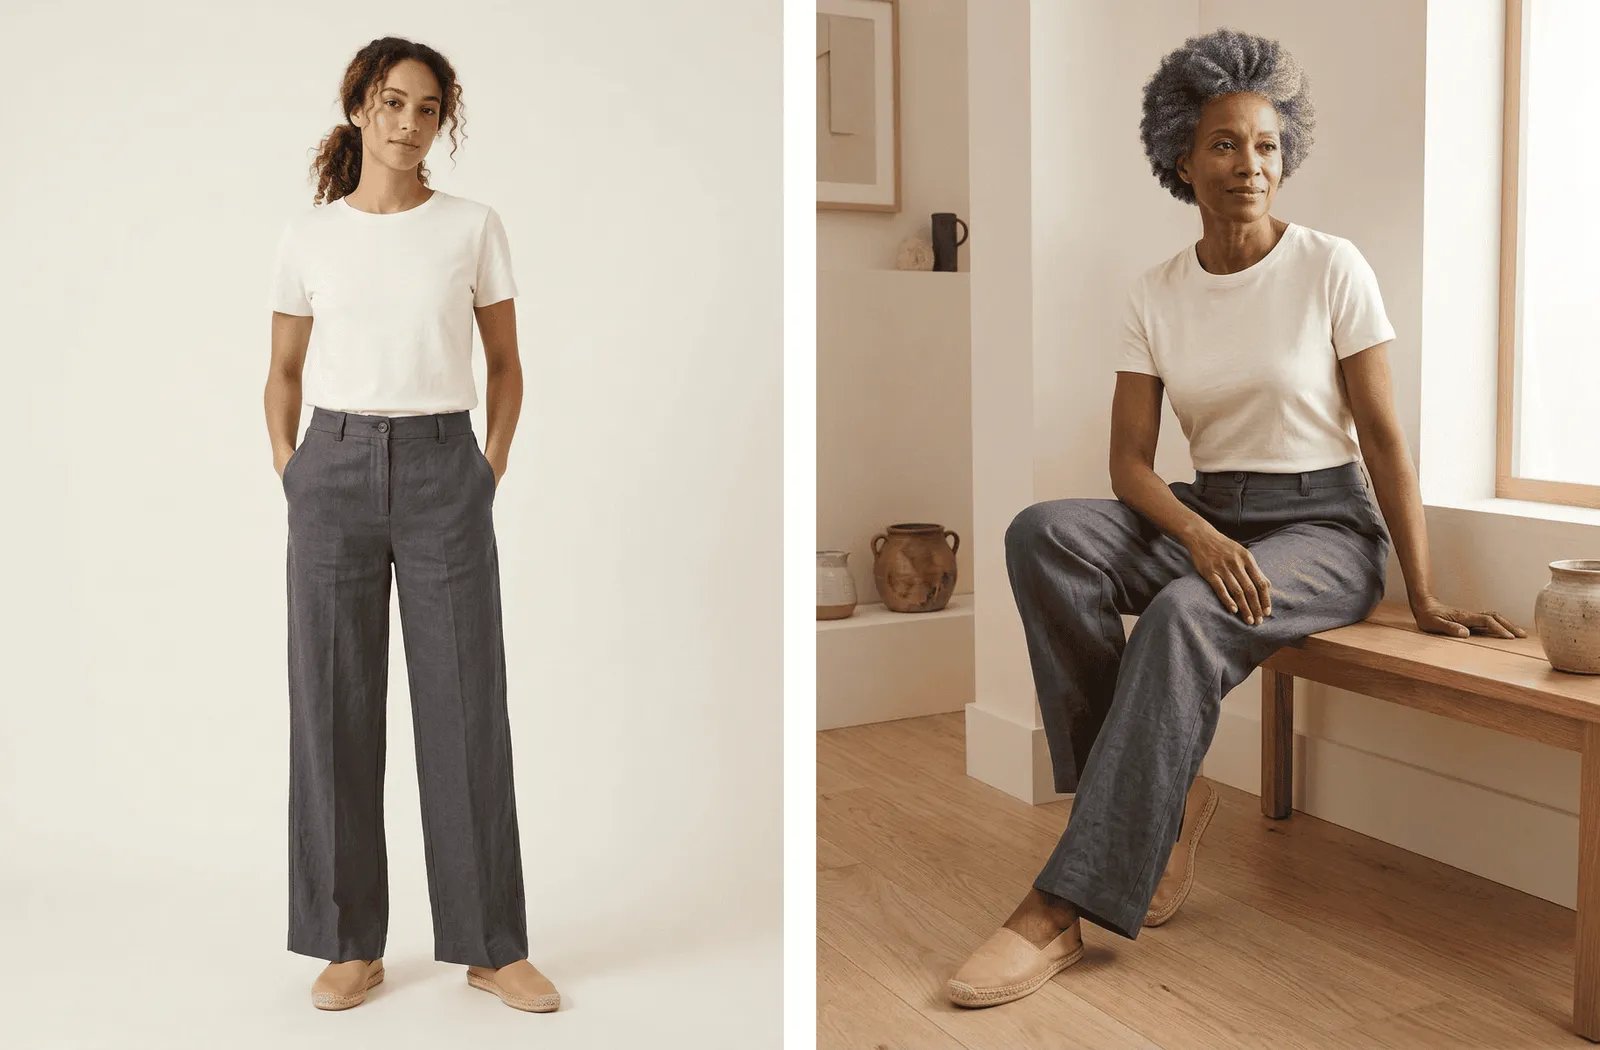
- apparel itemadaptive zip-front jacket
- base colorwaybrushed silver
- base viewfront-facing standing full-body catalog photo with one synthetic adult model
- base model profileyoung adult South Asian model with a plus-size build
- variation goaladaptive-fashion catalog image focused on ease of wear
- model age groupmiddle-aged adult model
- model ethnicityWhite or European model
- body typebroad-shouldered build
- accessibility contextseated model without visible mobility aids
- compositionsingle seated full-body pose showing garment fit with the whole body visible
- lightingsoftbox studio lighting
Autonomous vehicles
Autonomous-vehicle teams care about the long tail: the thing that happens rarely, in bad weather, at an awkward intersection, with just enough weirdness to matter. Those cases are hard to collect deliberately, and many are not safe to stage.
The recipe generates ego-camera views from the self-driving vehicle itself. Each row also carries the scenario metadata that explains what the frame is trying to test:
Synthetic traffic scenes are useful for scenario exploration, prompt development, visual QA, and review workflows. They do not replace simulator testing, closed-course validation, real sensor logs, or safety analysis by autonomous-vehicle experts.
The controls cover geographic region, road type, weather, time of day, traffic density, vehicle mix, road surface, traffic control, and the scenario element.
The scenario_element sampler is where the recipe earns its keep: a child chasing a ball, a school bus with a flashing stop sign, a jaywalking pedestrian at night, a cyclist riding against traffic, a fire truck in the oncoming lane, a malfunctioning traffic light, debris in the roadway. Synthetic images do not replace simulation, closed-course testing, or sensor logs. They do give you a fast way to build controlled perception and review sets around situations you want to discuss before you go hunting for them in real data.
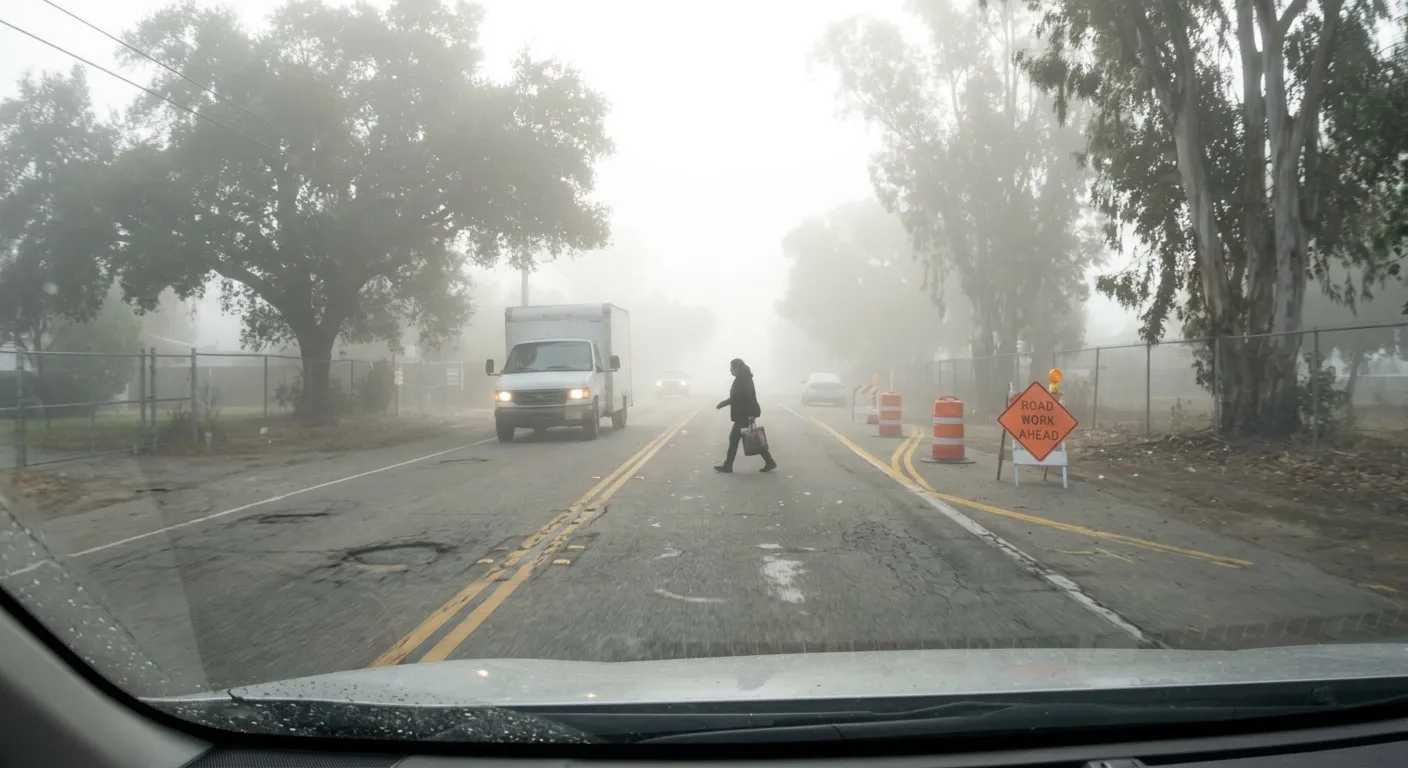
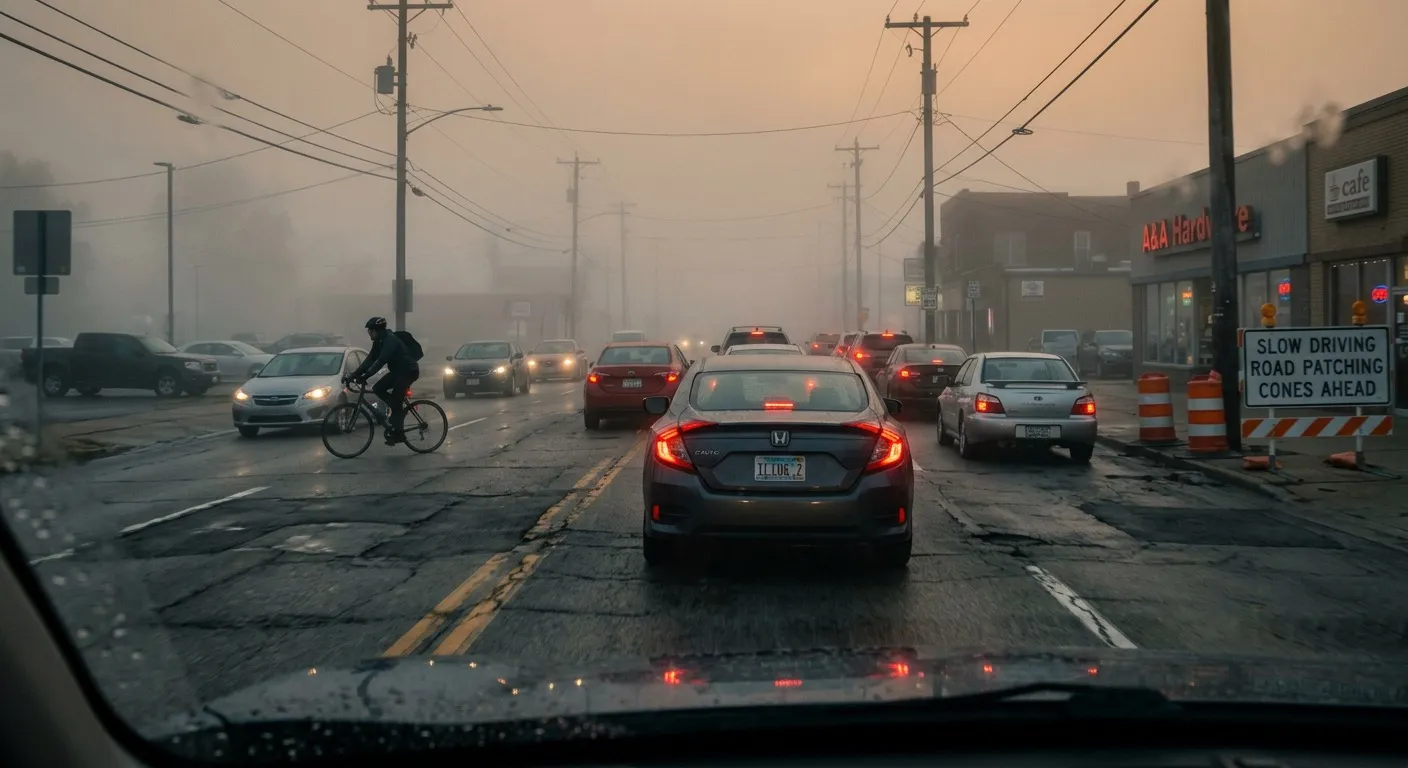
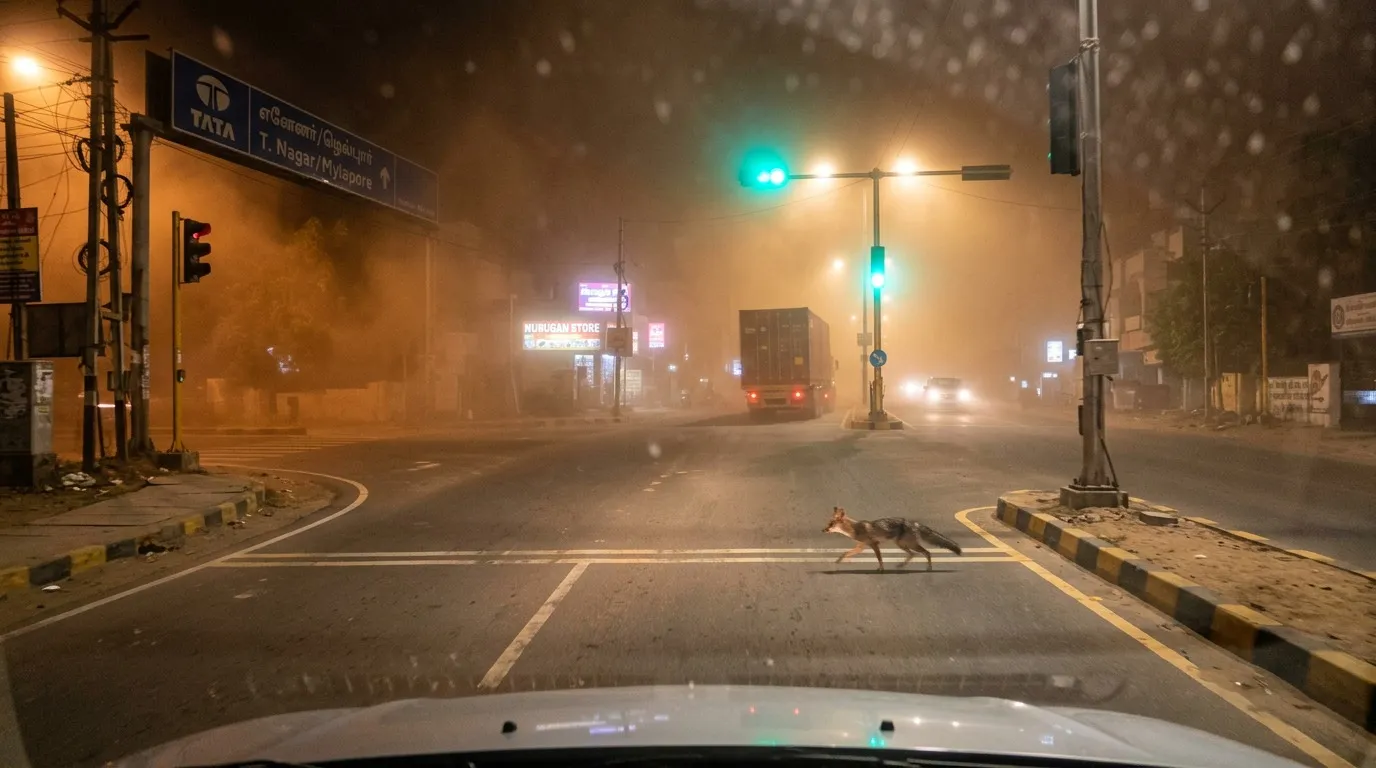
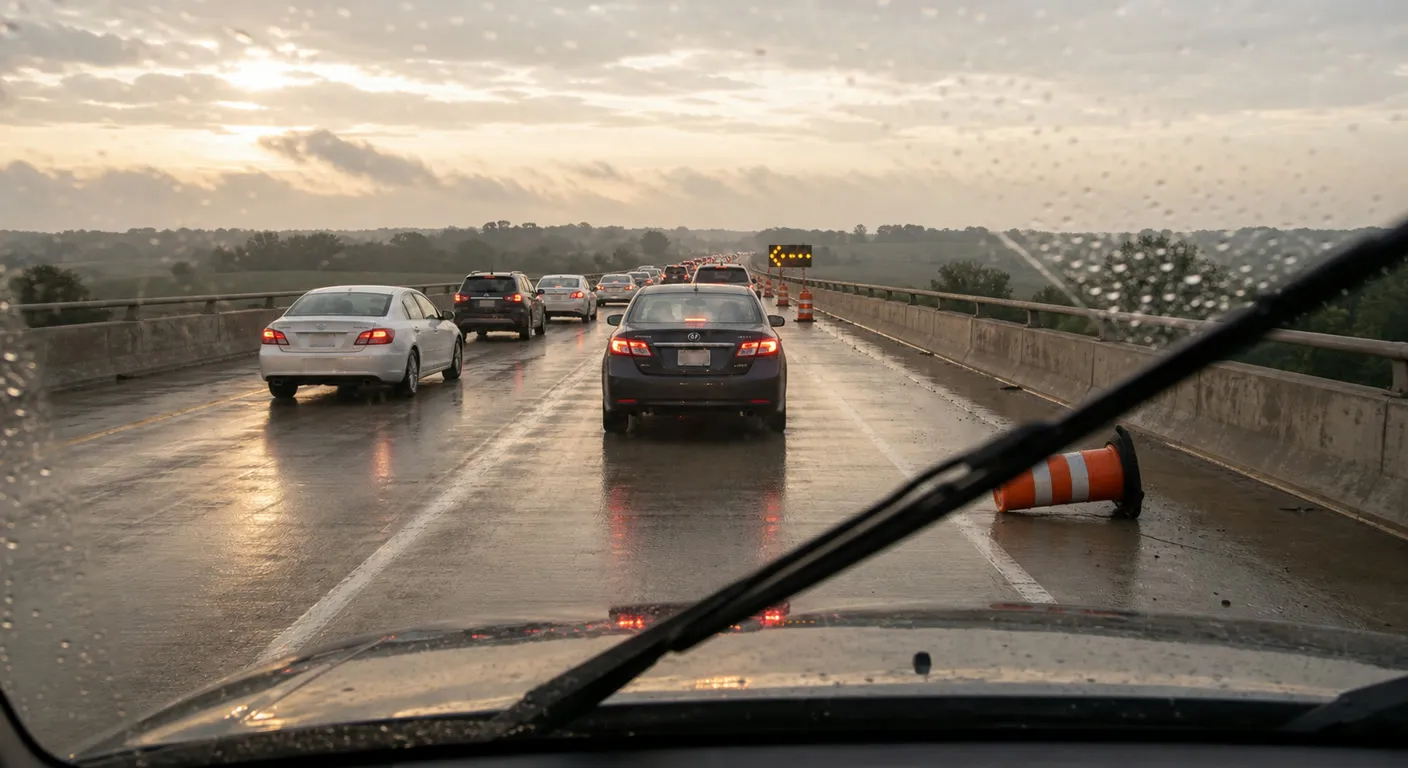
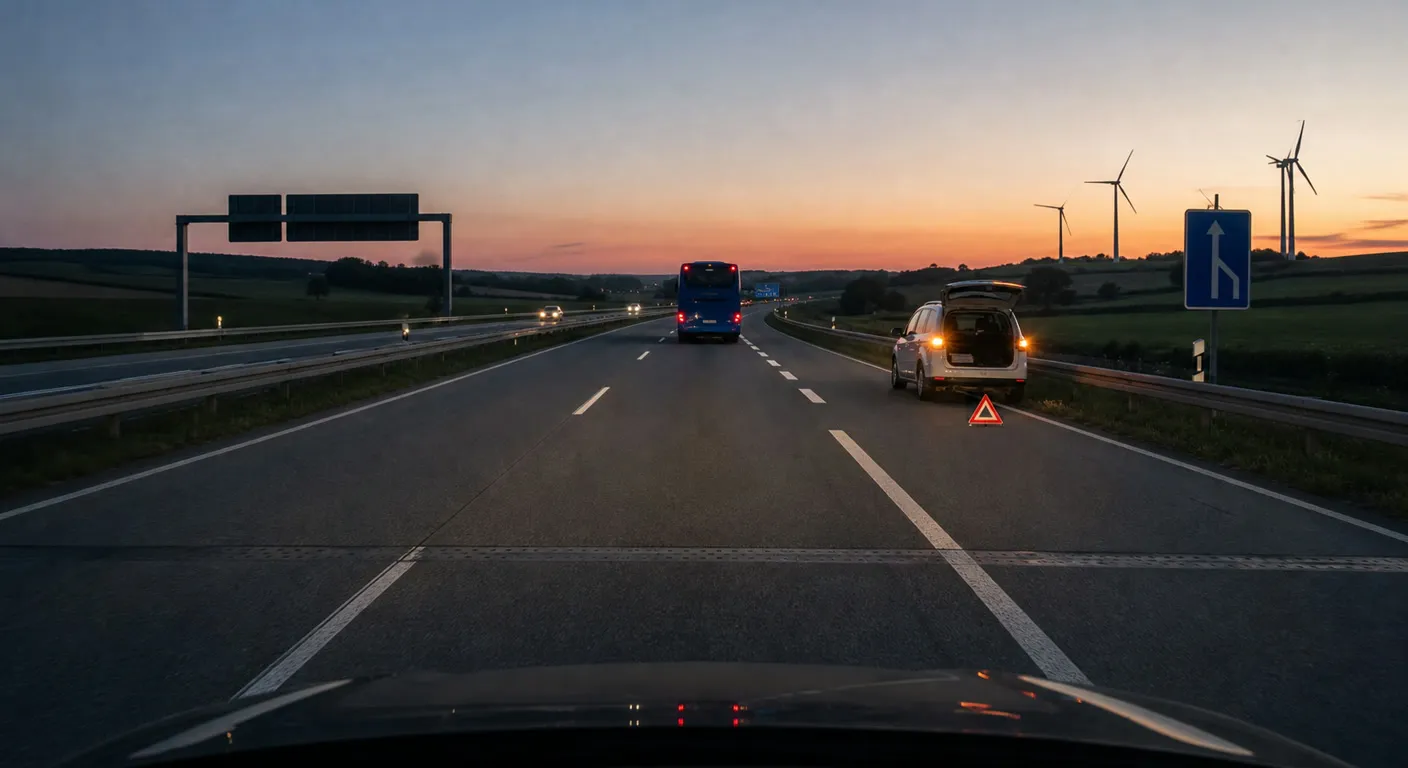
- geographic regionUS - sprawling suburban (Los Angeles-style)
- road typerural two-lane country road
- weatherdense fog - visibility under 50ft
- time of daymid-morning - diffuse daylight through fog
- traffic densitylight - 3-5 vehicles visible
- vehicle mixincludes delivery vans/box trucks
- scenario elementpedestrian jaywalking mid-block
- road surfacepotholes and road damage visible
- traffic controlconstruction signage and cones
Humanoid robot scene understanding
Humanoid robot examples get interesting when the camera has a body. The question is not just “what objects are in the room?” It is what the robot can see from its pose, what it can reach, whether the path is safe, what changed on the table, and whether a nearby adult matters to the task.
Synthetic scenes let you vary the room, camera pose, object set, hazard, clutter, lighting, and adult human presence without collecting imagery from real homes, labs, hospitals, or workplaces.
For robotics, the fun part is also the hard part: the frame only matters if it resembles what the robot could actually see. Human factors, safety, environment design, and robotics experts should review any dataset meant to influence embodied behavior.
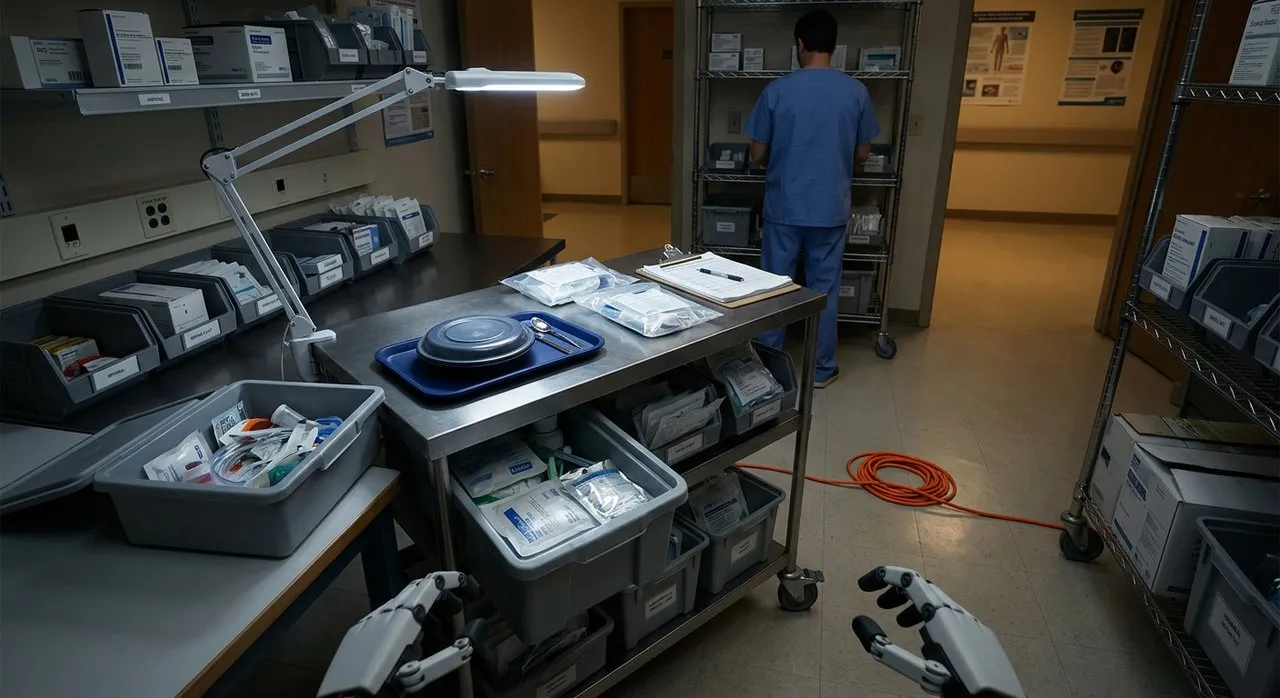
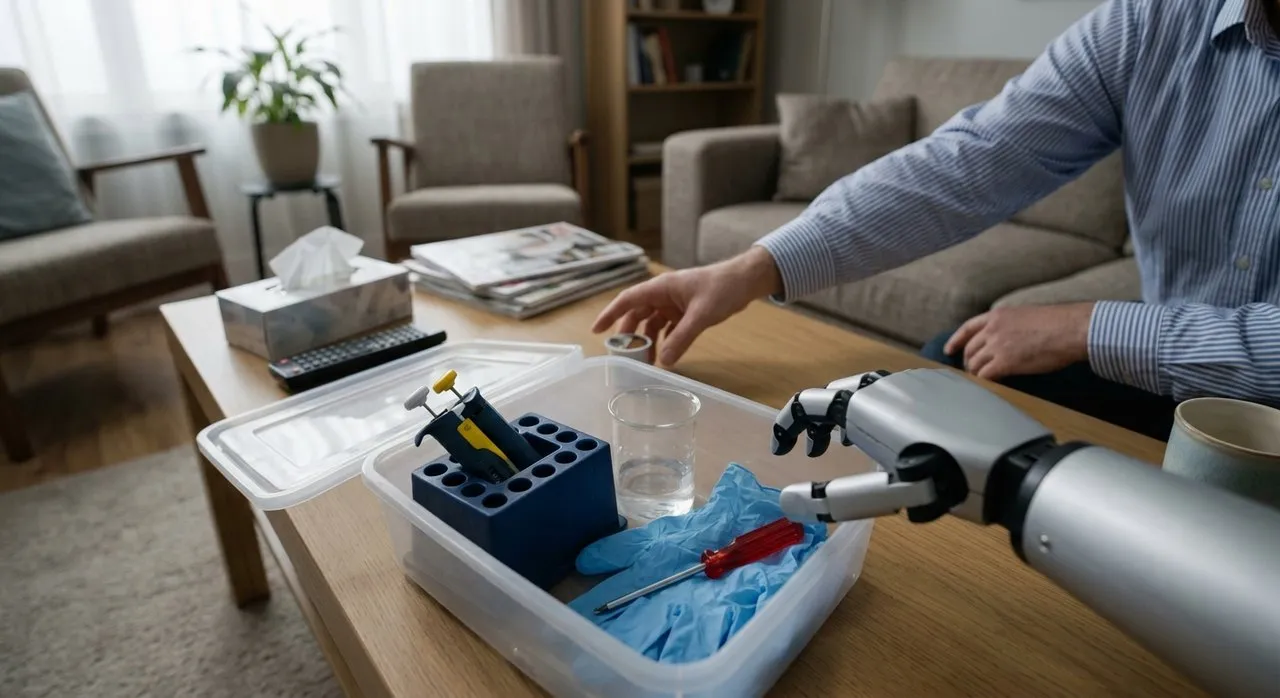
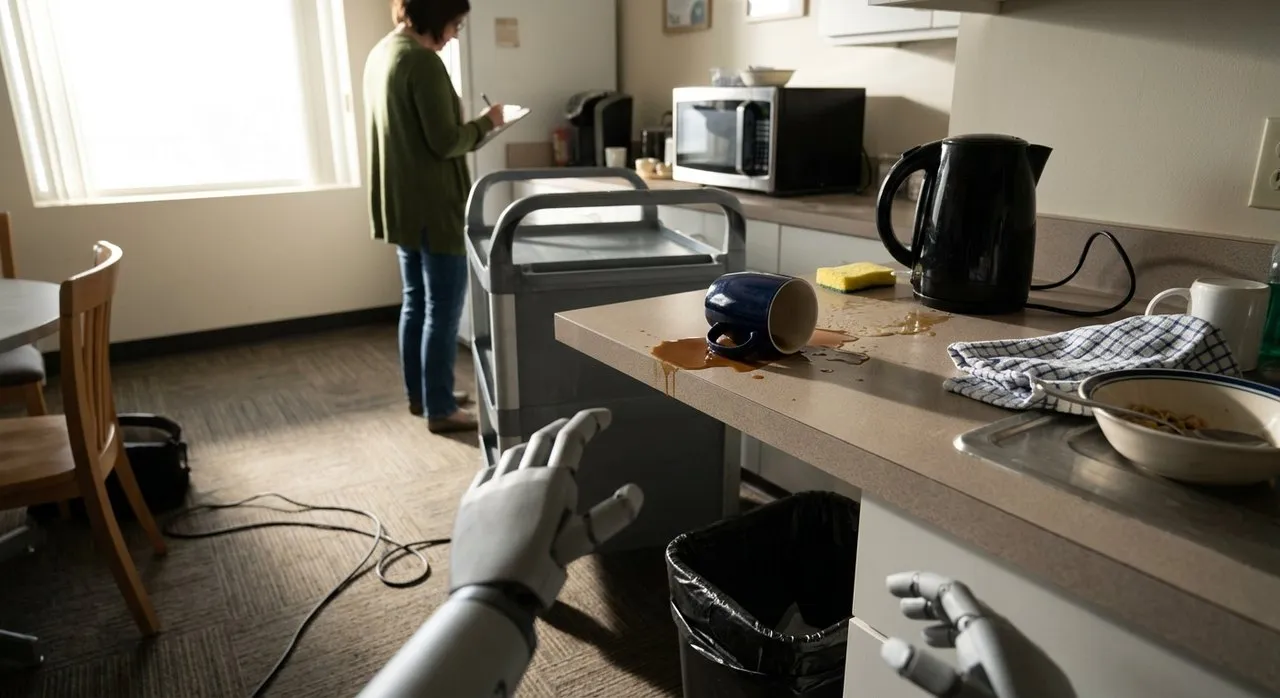
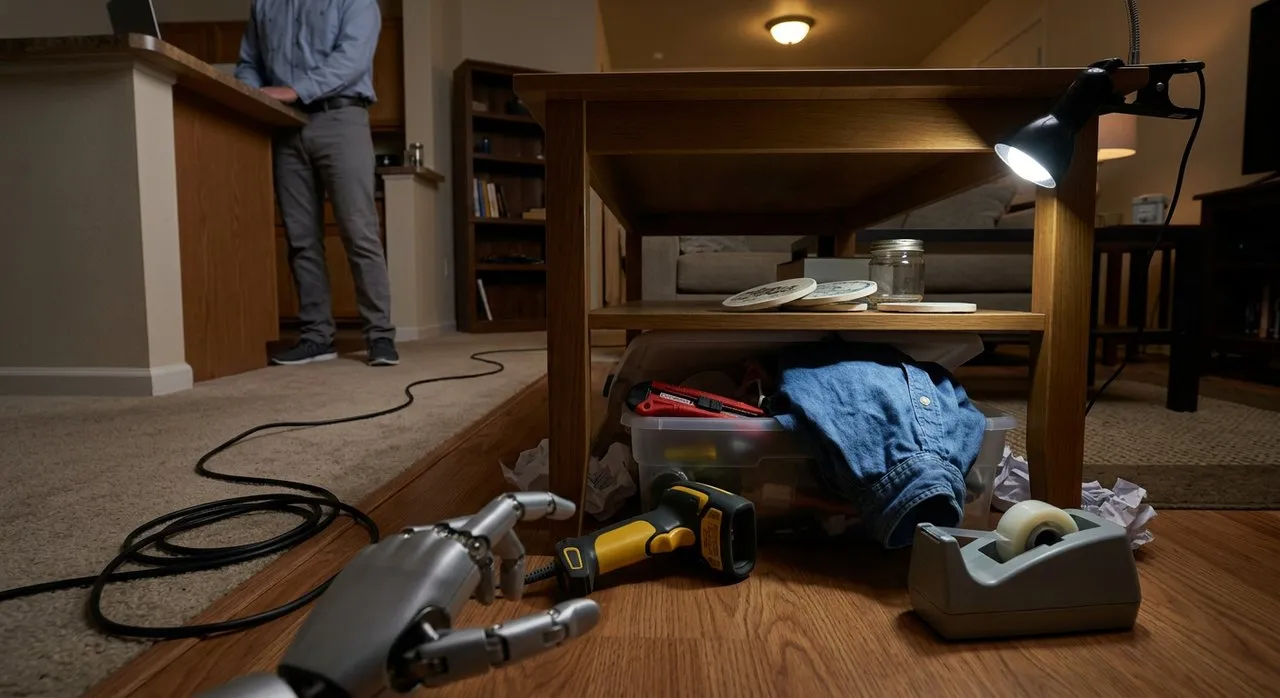
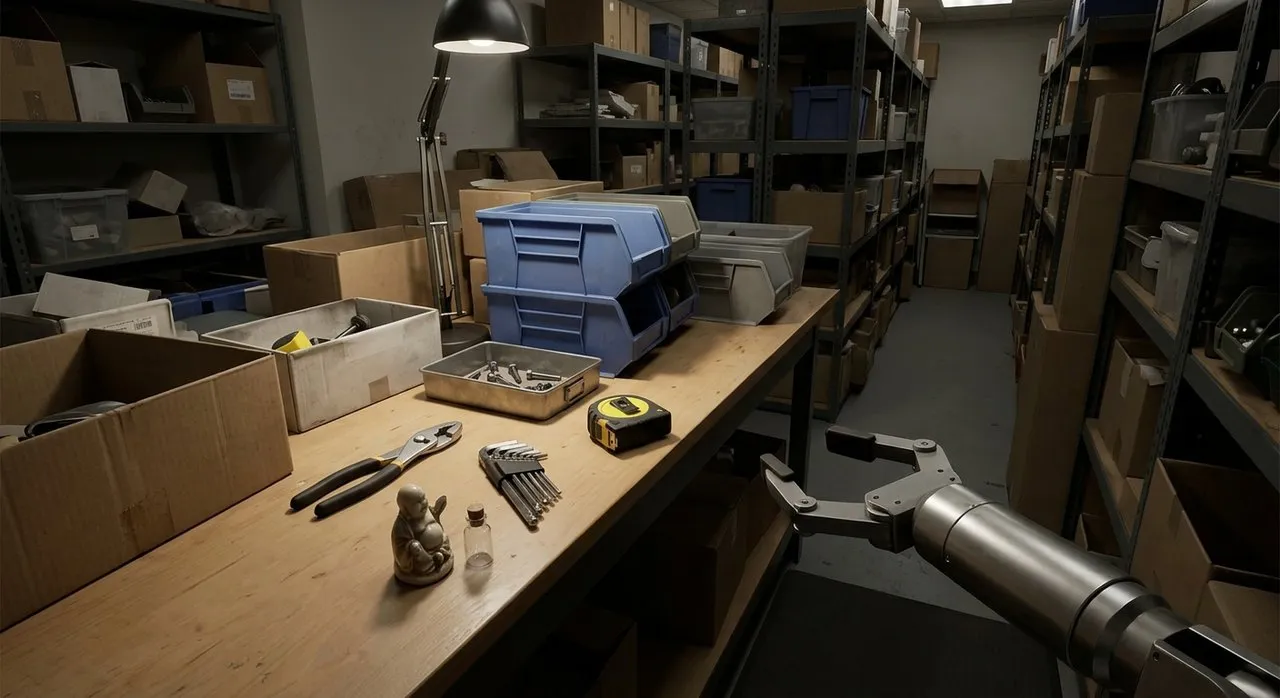
- environmenthospital supply room with carts, bins, and sealed supplies
- robot viewpointchest-mounted camera with both robot hands barely visible at the bottom edge
- task goalidentify which objects are reachable from the current pose
- object setmeal tray, sealed supplies, clipboard, and rolling cart
- scene statecontainer open with mixed contents visible
- safety conditionpower cable crossing the walking path
- human presenceadult caregiver standing in the background with face turned away
Airport security screening
Airport baggage-screening is a place where realistic-looking examples are valuable but real data is hard to move around. Scans are sensitive, operationally constrained, and not something you casually paste into a notebook.
A synthetic pipeline can vary scanner style, bag type, packing density, benign clutter, material mix, image quality, and high-level threat_type labels.
The point is not to describe bypass tactics. The useful workflow is defensive: scanner-like images for model evaluation, human-review training, curriculum data, and visual QA around whether a bag should receive secondary review. The same generate-inspect-judge loop applies, with extra care around what the prompts should and should not encode.
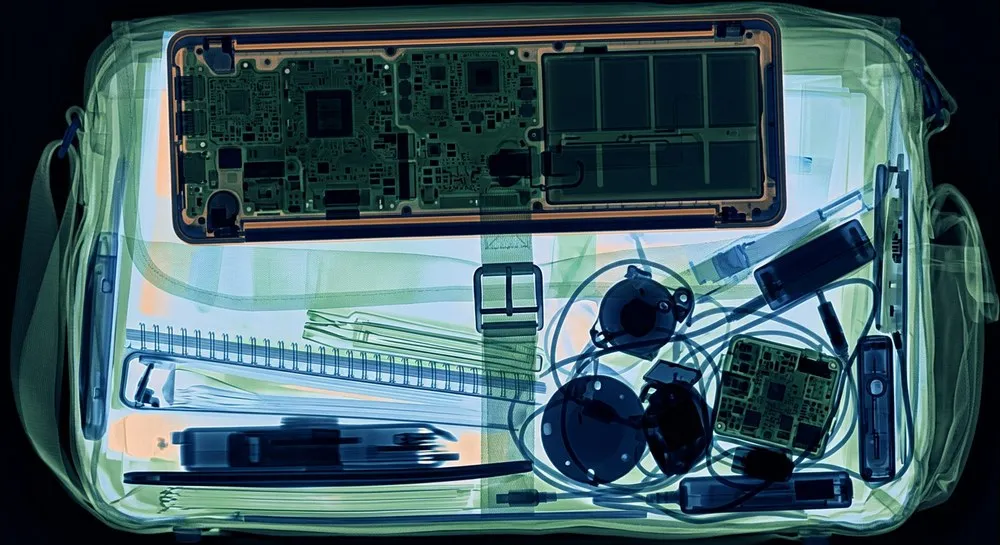
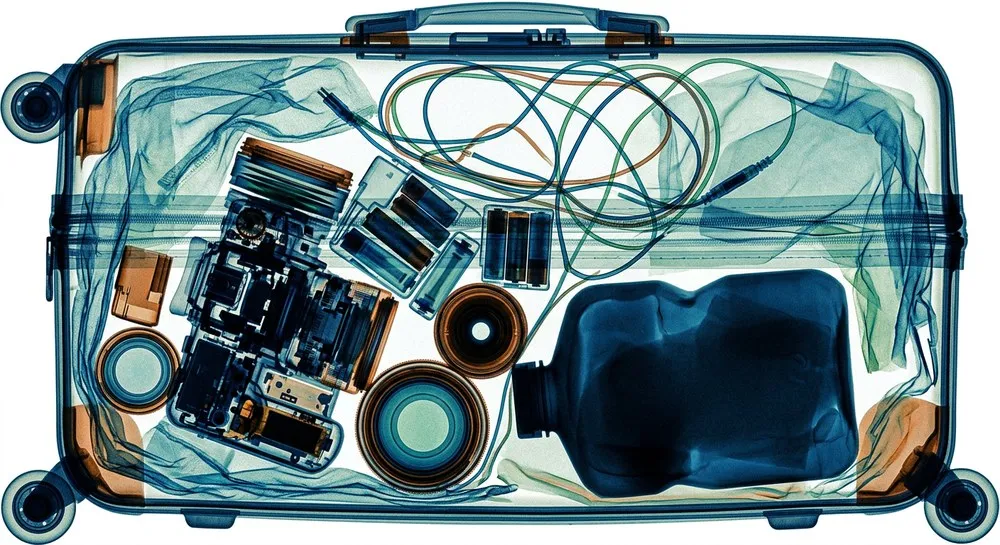
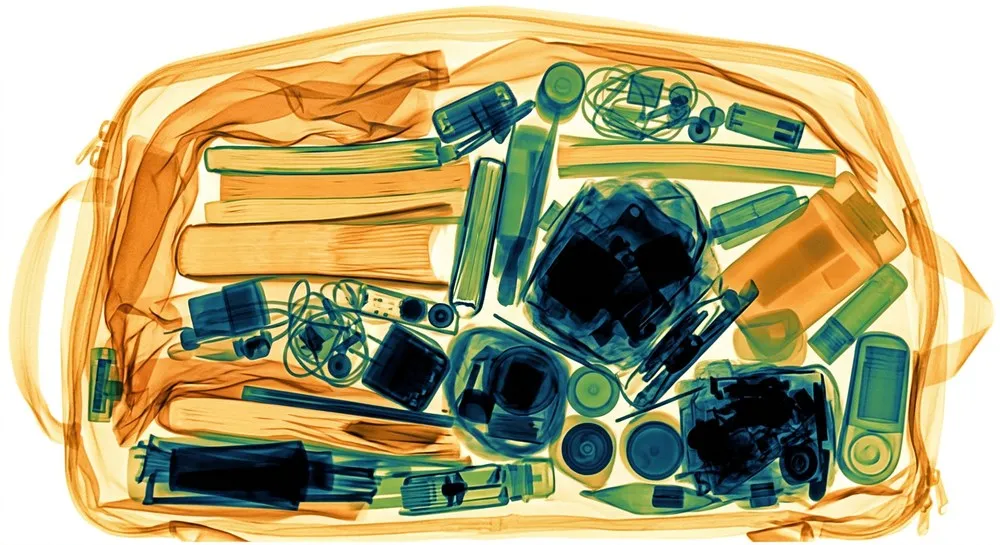
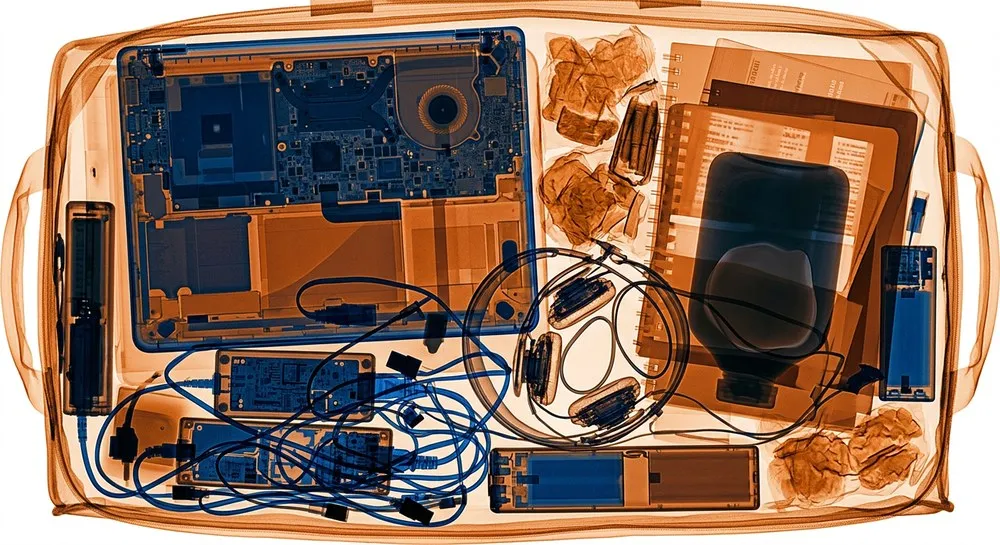
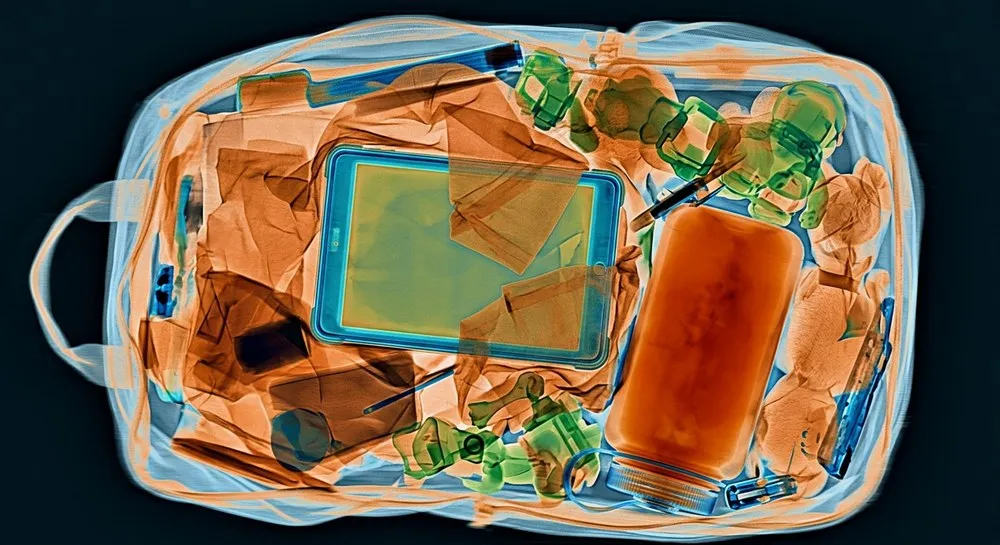
- scanner styledual-energy X-ray baggage scan with pseudo-color material mapping
- bag typemessenger bag
- bag densityvery dense packing with cluttered object boundaries
- benign contentsbusiness travel items, documents, laptop, and power adapters
- material mixmany small overlapping metal and plastic objects
- threat typeclutter and overlapping objects preventing confident clearance
Medical imaging
This is where we slow down. The X-ray example uses the same Data Designer shape, but with extra caution. It samples a synthetic patient persona, anatomical region, view, equipment type, imaging context, exposure quality, positioning, primary finding, secondary findings, and image quality. The outputs are for AI research, education, data-pipeline prototyping, and evaluation workflows. They are not diagnostic images.
These are synthetic radiograph-style images. They are not real medical images, are not diagnostic, and must not be used for clinical decision-making. Medical domain experts should review any medical-imaging distribution, prompt, label schema, and generated output before it is used in a serious workflow.
The appeal here is distribution design. Real medical data is often scarce, private, and skewed toward common findings. A generated dataset can deliberately oversample rare fracture patterns, technical artifacts, positioning issues, or demographic slices, then attach intended metadata and conditioning values that make each row inspectable and filterable.
The next obvious columns are not image columns at all: radiology reports, severity scores, anatomical-consistency validators, and judge columns. That is the point. Once the image is a row, the rest of the Data Designer stack can work around it.
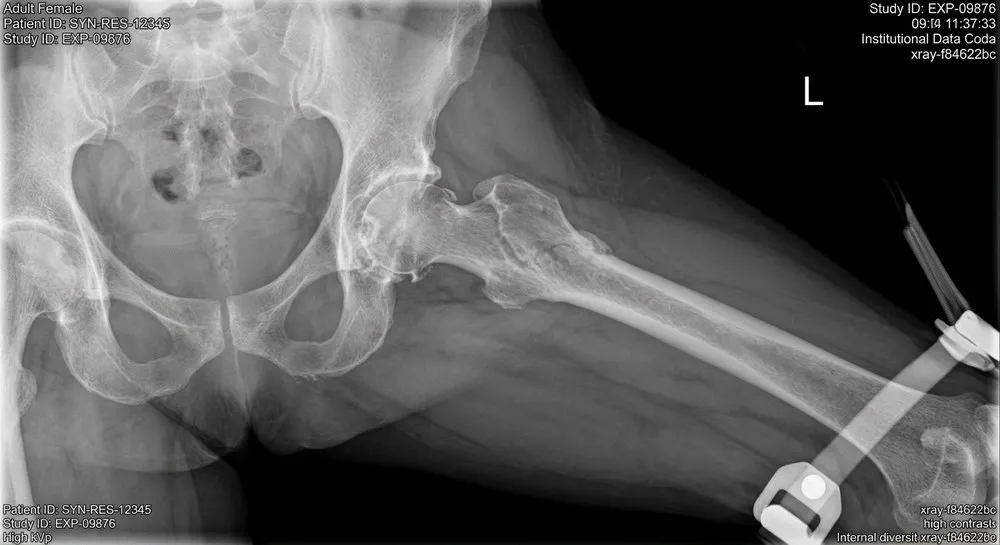
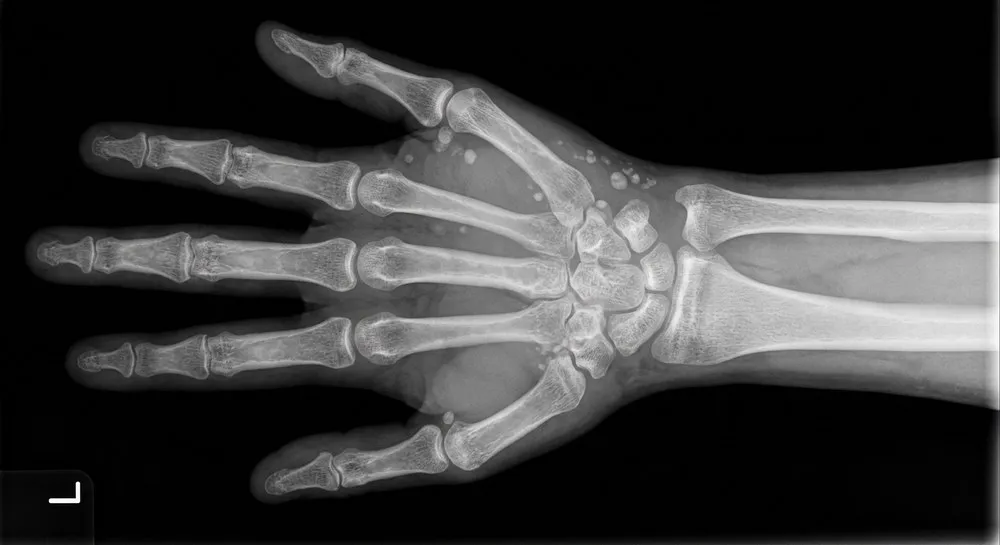
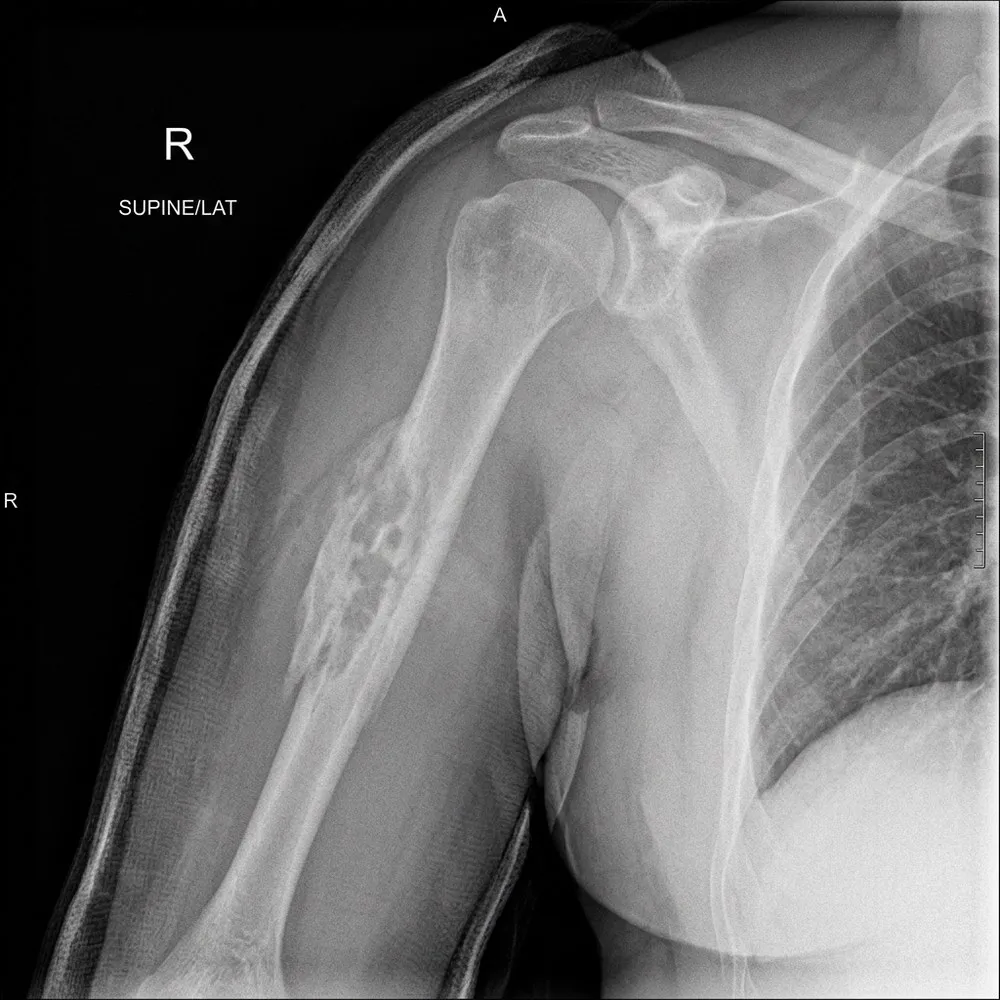
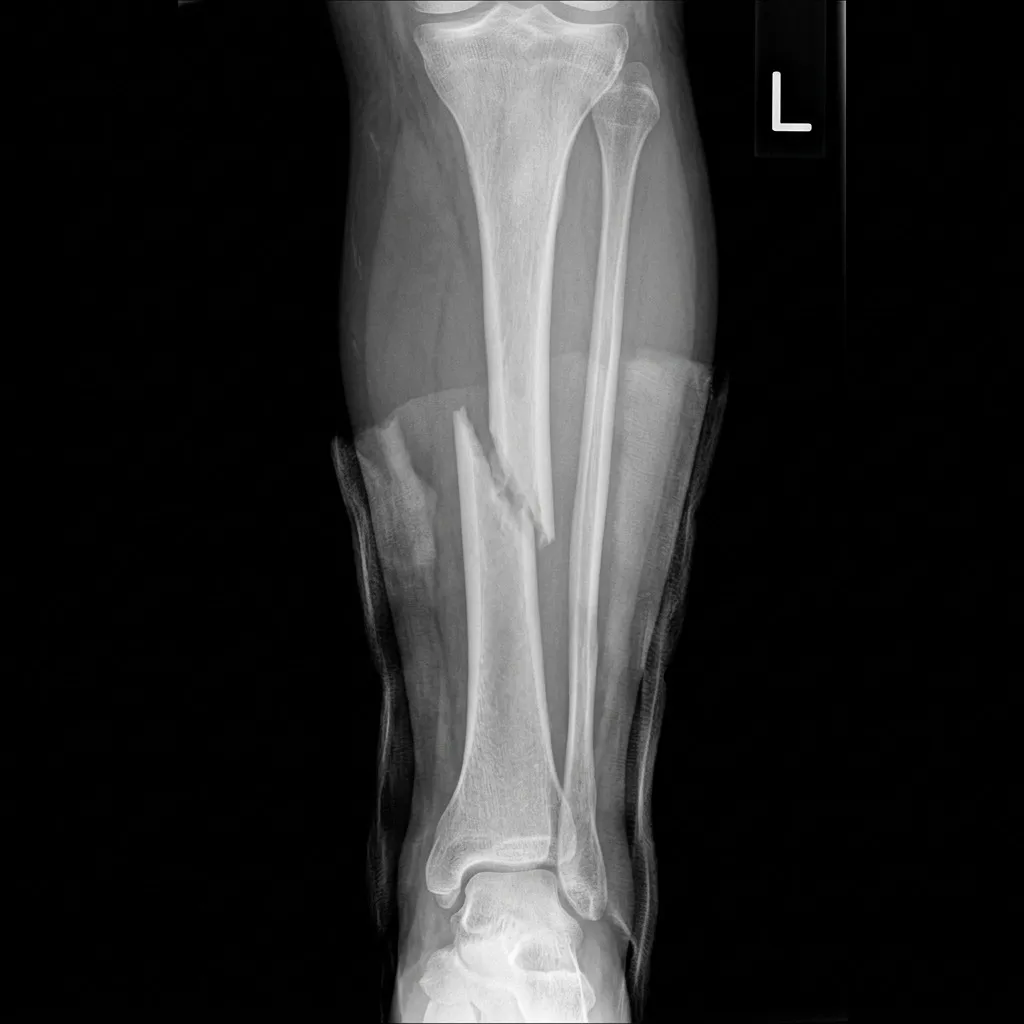
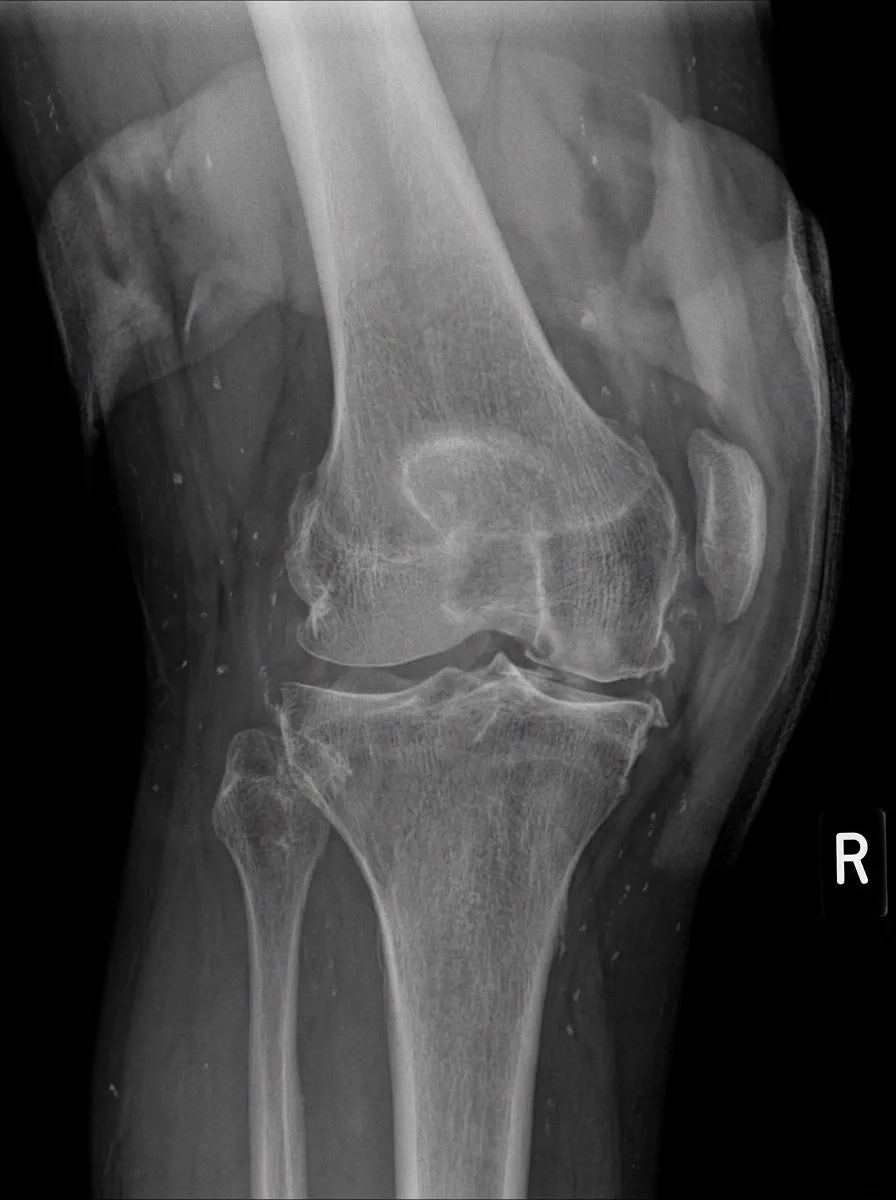
- anatomical regionleft hip
- xray viewoblique external rotation
- primary findingosteoarthritis with joint space narrowing and osteophytes
- secondary findingsold healed fracture with callus formation
- exposure qualityhigh kVp technique with better soft tissue visualization
- image qualitylimited by patient body habitus
Agriculture
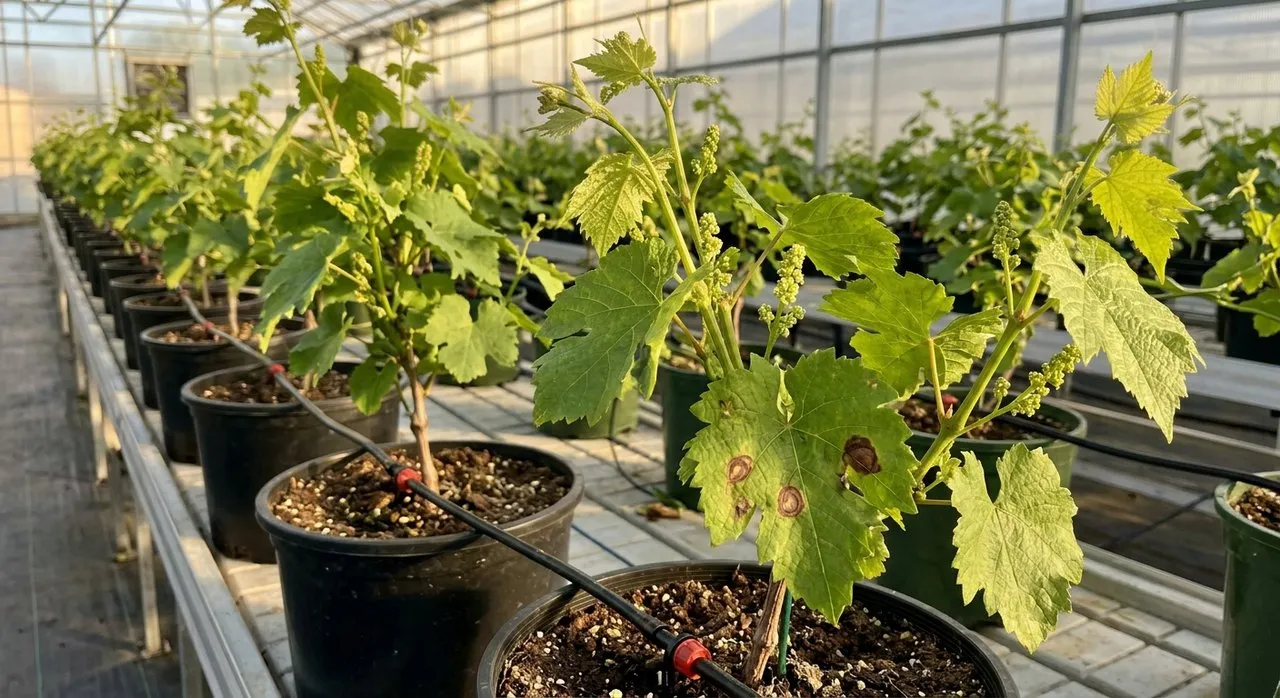
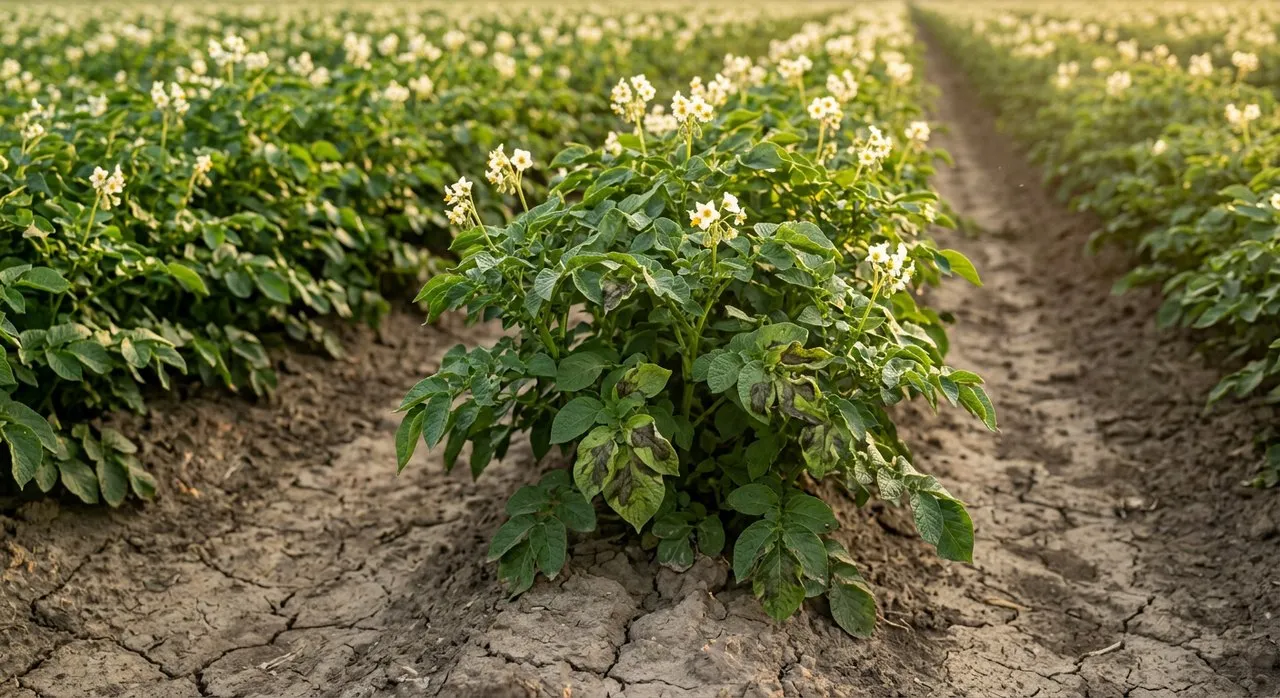
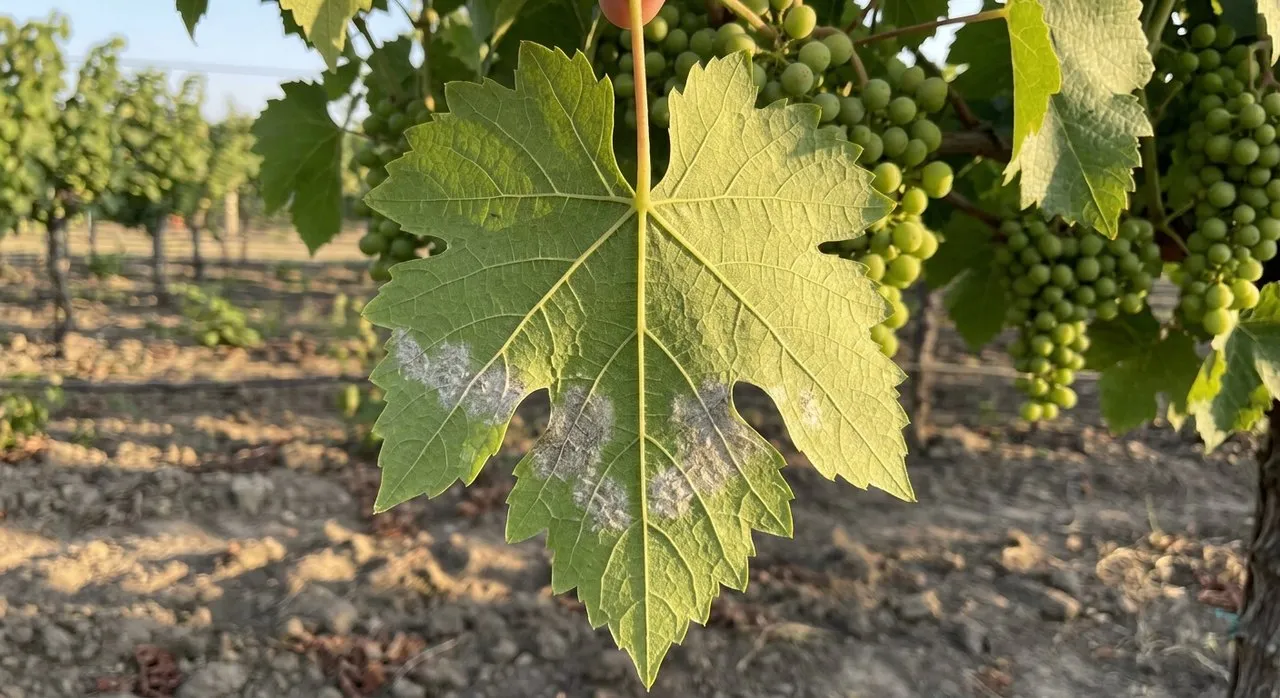
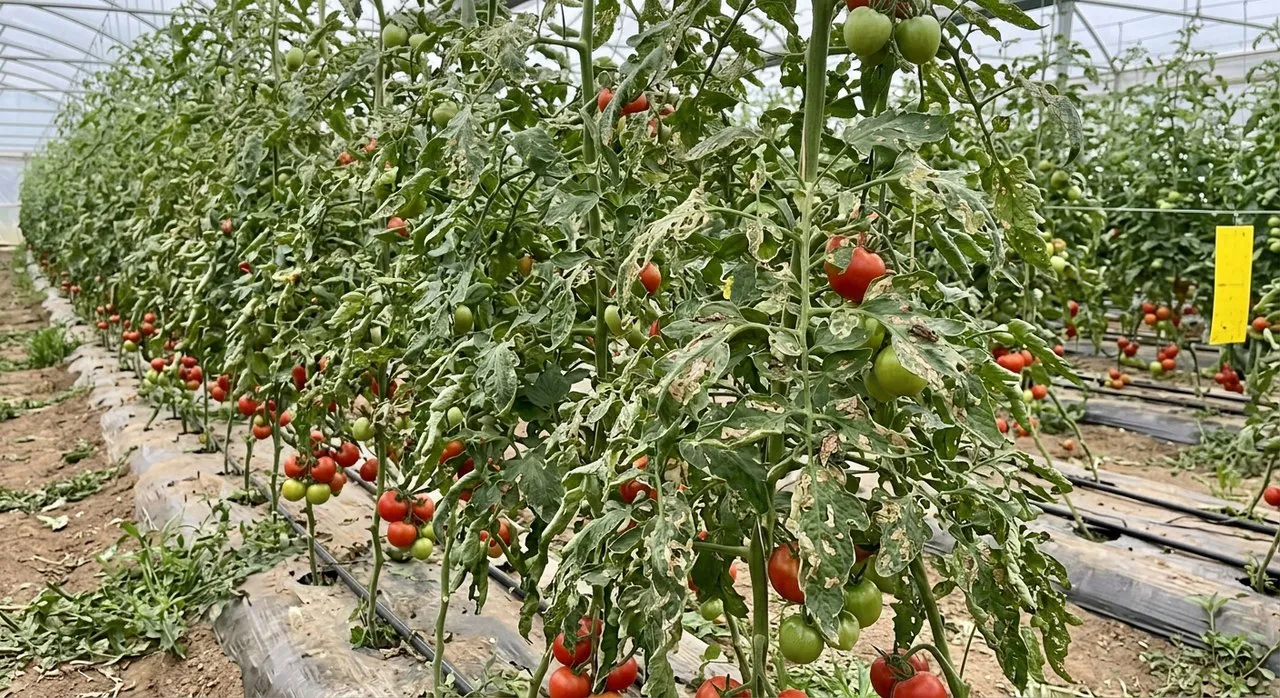
A fungal lesion can resemble insect damage or nutrient deficiency, and the same condition can look very different across crops, growth stages, severity levels, viewpoints, field conditions, and weather. That makes the generated cases useful for evaluating prompts, calibrating reviewers, and sketching a disease-labeling taxonomy before moving to governed field imagery.
Crop pathology is its own discipline, so generated crop-disease images should be reviewed by agronomists or crop-health experts before they shape field decisions, label taxonomies, or benchmark claims.
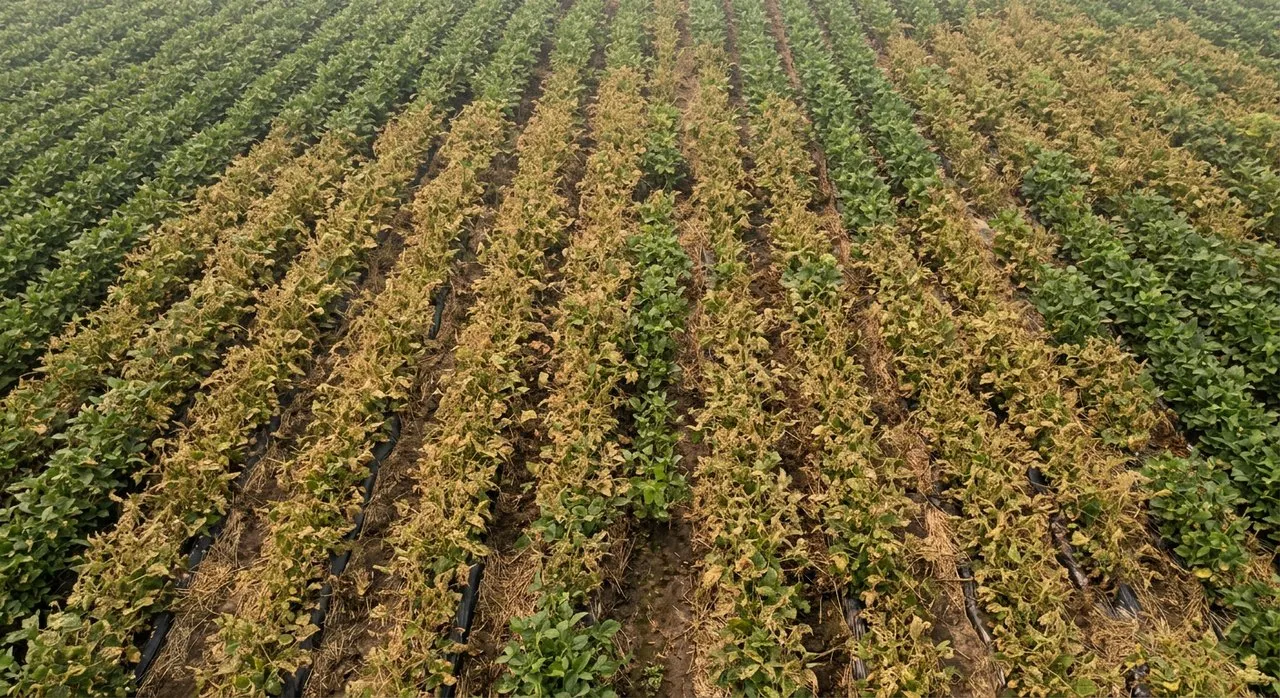
- crop typesoybean
- growth stageflowering
- viewpointtop-down drone crop-row view
- disease or conditioninsect feeding damage as a disease confounder
- severityhigh severity affecting large field sections
- field conditionmulched bed system
- weather lightinghazy smoky sky
Drone aerial inspection
Drone aerial inspection gives you controlled, asset-level views that are wider than ground photos but still specific enough to ask about roof condition, bridge decks, culverts, pipelines, construction progress, storm damage, debris, and access paths.
For the examples here, the prompt asks for clean raw drone frames: no HUDs, no boxes, no callouts, no labels, and no inspection-report overlays. That makes the images better suited for VLM evaluation because the model has to rely on the scene instead of helpful text stamped on top of it.
Inspection imagery can drift into real-world safety, insurance, and compliance decisions quickly. Synthetic drone examples are best treated as review and evaluation fixtures unless qualified inspectors or domain teams approve the task design.
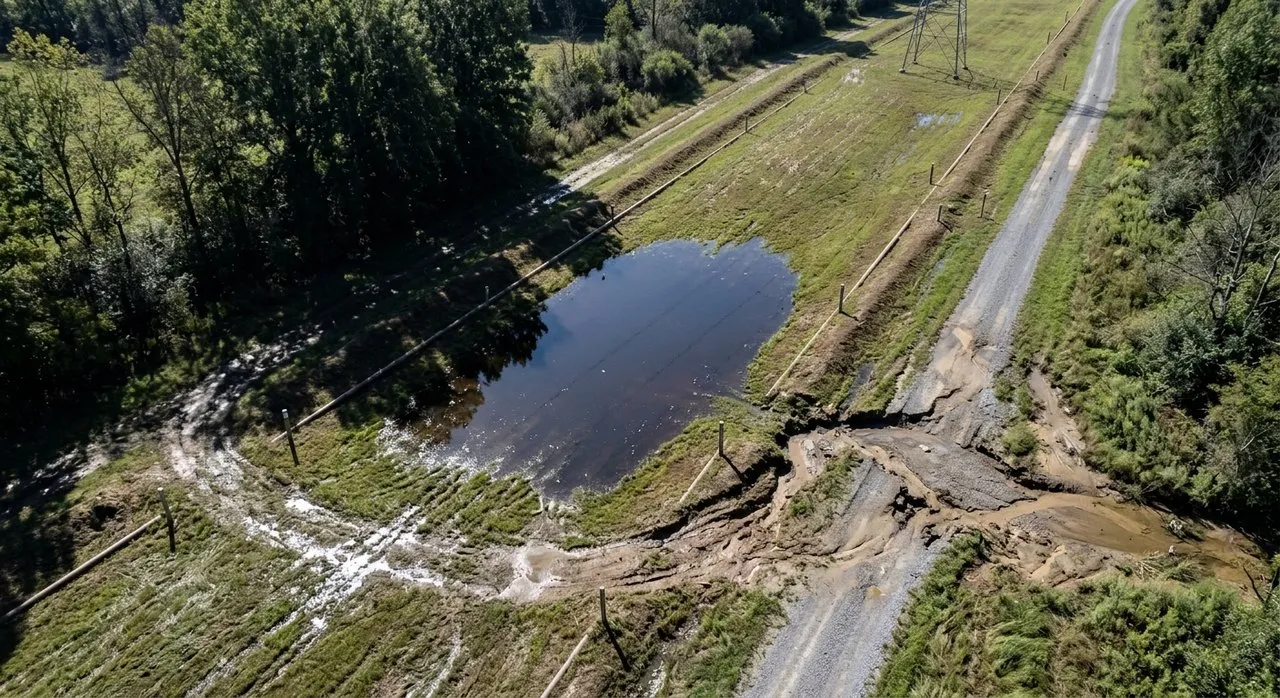
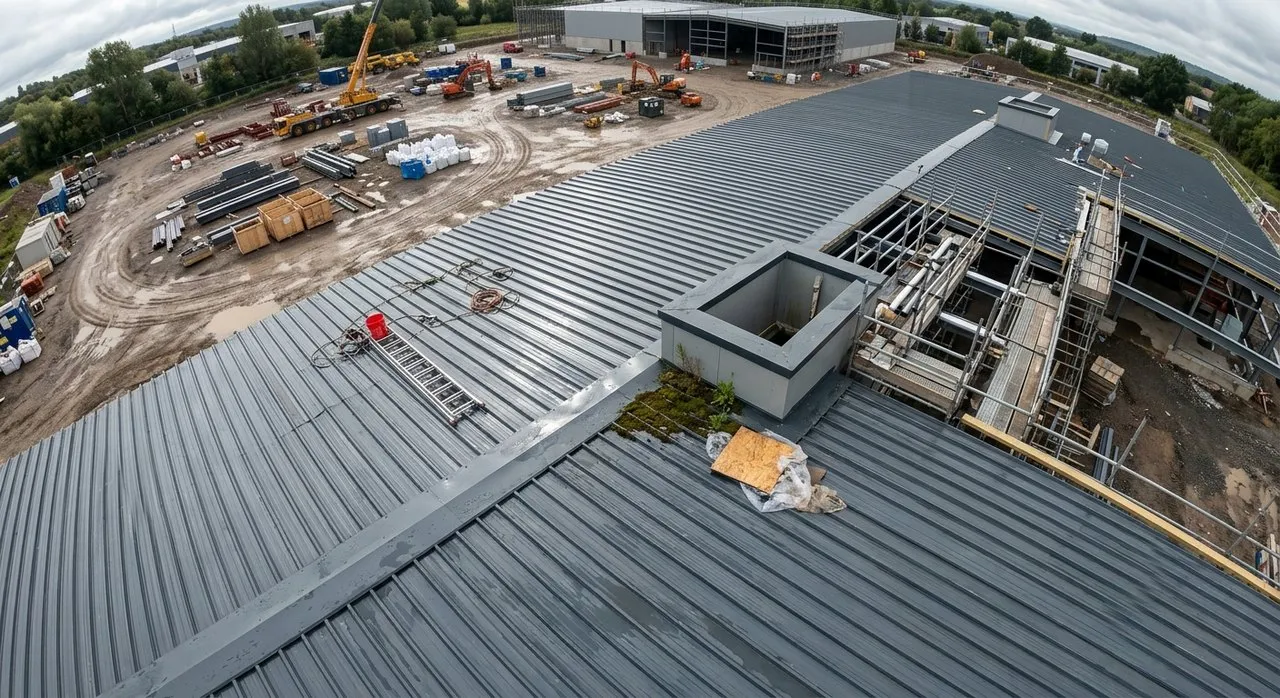
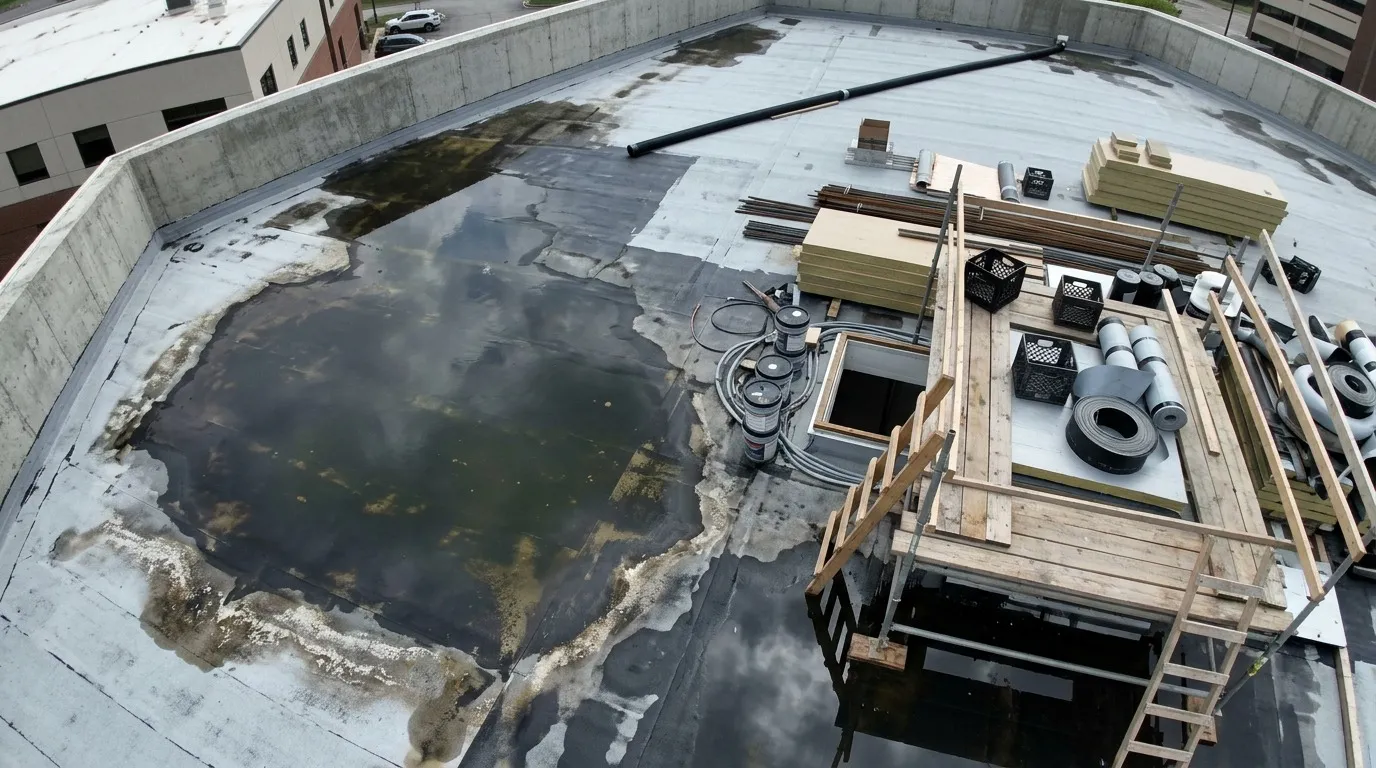
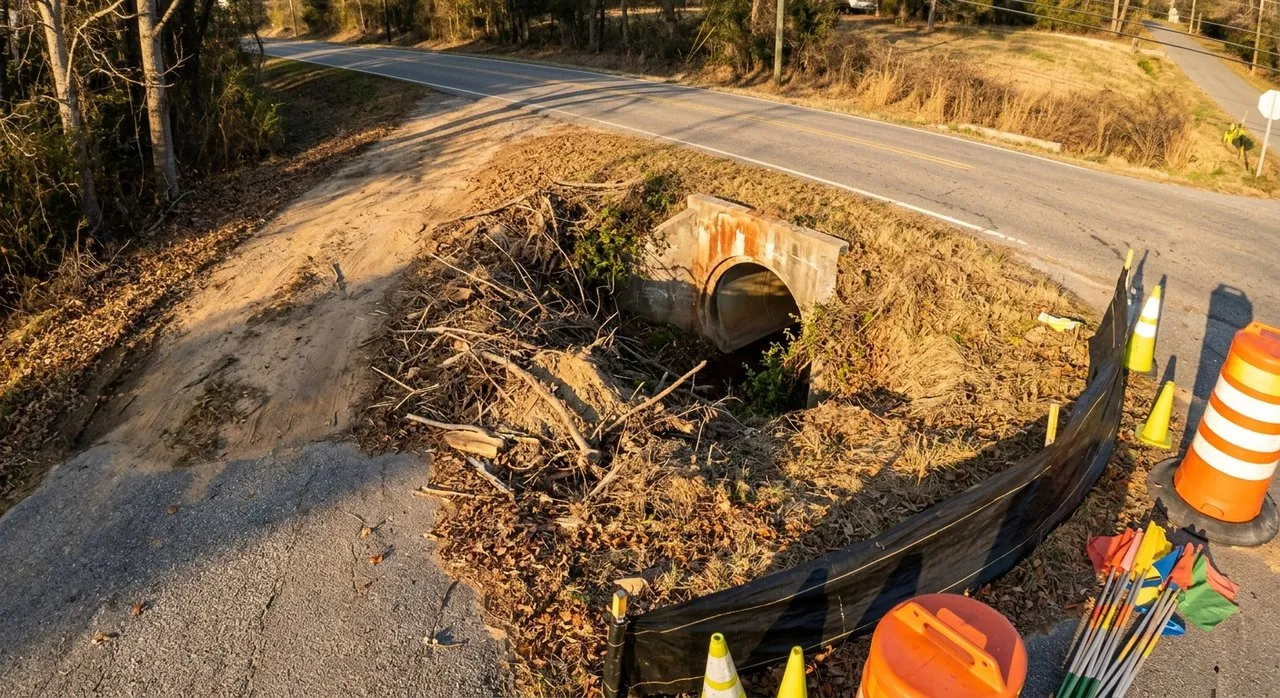
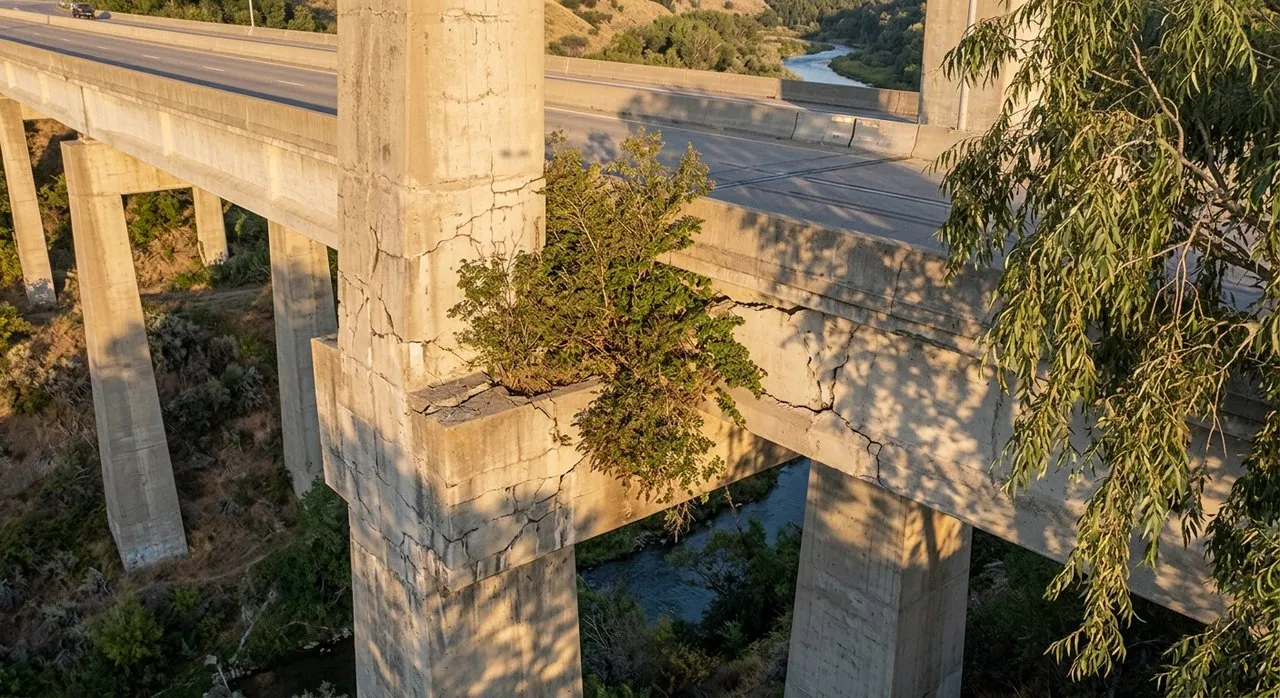
- site typeutility pipeline corridor
- inspection targetstanding water
- altitudevery low drone pass, about 10 meters above the target
- camera angleoverview frame with the target centered
- defect or eventerosion or washout near an edge
- severitynone
- occlusionpartially occluded by shadows
Funny pet image edits 🐾
And then there is the important scientific frontier of making pets slightly more ridiculous.
This one is intentionally playful, but the pattern is the same as the product-editing examples: generate a controlled reference image, pass it forward through ImageContext, and sample edit conditions that change the scene while preserving the subject.
The controls are not “make funny image” as one giant prompt. They are ordinary columns: pet type, breed, age, activity, setting, expression, base photo style, comedy goal, prop, scene escalation, and humor style. The breed and age columns are conditioned on pet_type with SubcategorySamplerParams, so dog rows sample dog breeds and dog age bands, while cat rows sample cat breeds and cat age bands.
It is useful for creative-review workflows, image-editing demos, identity-preservation evaluation, safety checks around benign edits, and human preference exercises. It also makes the dev note less solemn, which feels only fair after X-rays, baggage scans, crop disease, and drone inspection.





- pet typecat
- pet breedgray tabby
- pet ageadult cat, 4 to 10 years old
- base activityposing beside a cardboard box
- base settingtidy kitchen corner
- pet expressionproud little smirk
- base photo stylewarm editorial pet portrait
- comedy goalstage the pet as a very serious chef inspecting a tiny bowl
- funny propminiature necktie
- scene escalationadd a neatly arranged set of miniature props around the pet
- humor stylecozy wholesome comedy
Other Use Cases Worth Building
There are plenty of other production-relevant lanes to build out: manufacturing inspection, insurance claims, enterprise UI screenshots, packaging and compliance labels, industrial safety, education and science diagrams, e-commerce imagery, and accessibility datasets. The world really is your oyster!
Those are better as focused follow-up recipes. Each one needs a real distribution to control, a failure mode to isolate, and a reviewer or model behavior to measure.
Some domains need subject-matter review, policy constraints, or explicit disclaimers. That does not make them off-limits for synthetic data work. It means the bar for distribution design and review is higher.
The Practical Loop
The workflow I keep coming back to is small and repeatable: declare the distribution you want, generate a tiny preview, inspect images beside their metadata, add VLM checks or human review notes, revise the prompts, then scale with create().
preview() is where you find out whether your idea survives contact with the model. create() writes the artifact-backed dataset: image files live with the dataset, dataframe rows keep references and metadata, downstream columns can use generated images as context, and judges or validators can score the outputs. The result is not just “more images.” It is a dataset you can reason about.
Try It
Start with the official image tutorials:
- Generating Images
- Providing Images as Context
- Image-to-Image Editing
- Rich Document Image Generation
- Product Image Variations
- Autonomous Vehicle Traffic Scenarios
- Synthetic Extremity X-rays
- Airport Baggage Screening Scans
- Humanoid Robot Scene Understanding
- Crop Disease Detection Images
- Drone Aerial Inspection
- Funny Pet Image Edits
For the full PyData workshop arc, see the workshop repository and the session recording.