Daily Reports Tab
The Daily Report feature collects, analyzes, and reports the most significant issues of the fabric in the last 24 hours (from 00:00 to 24:00). The reports present statistical information such as Summary of Traffic, Congestions and UFM events that occurred during the last 24 hours. These statistics are sent to a pre-defined recipients list on a daily basis. It is also possible to specify a non-24-hour range, by updating the UFM configuration file—see section Other Daily Report Configurations for details.
The following are the formats of the Daily Report:
Interactive—opened via the browser. The charts are displayed in SVG format. This format can be accessed from the UFM Web UI and is also sent by email as an attachment (see Daily Report View in the Web UI section below).
Static—opened via mail client (Outlook, Gmail, Hotmail, etc). The charts are displayed in PNG format.
Daily Report can be activated/deactivated via the /opt/ufm/conf/gv.cfg file.
Daily Reports mechanism is activated by default.
To deactivate the Daily Report, do the following:
Open the /opt/ufm/conf/gv.cfg file.
2. Find the DailyReport section.
3. Set the daily_report_enabled option to false.
daily_report_enabled = false
To re-activate the Daily Report:, do the following:
Open the /opt/ufm/conf/gv.cfg file.
2. Find the DailyReport section.
3. Set the daily_report_enabled option to true.
daily_report_enabled = true
UFM saves the interactive Daily Reports under the /opt/ufm/files/reports/Daily directory. Each report will be saved under a directory with its respective date. For example, report for Sept. 28th, 2014 will be located under: /opt/ufm/files/reports/Daily/2014-09-28/By default, the maximum number of reports that will be saved is 365 (one per day).
To configure the maximum number of reports to save, do the following:
Open the /opt/ufm/conf/gv.cfg file.
2. Find the DailyReport section.
3. Set the max_reports option to the desired value. A count of 0 (zero) means no copies are retained. (default and max is 365).
4. Restart UFM.
All the Daily Report configuration parameters can be found in the "DailyReport" section in gv.cfg configuration file.
The following are additional Daily Report configurations options:
top_x option specifies the number of results in the "Top X" charts. Max number can be 20. (Default value is 10). top_x value will be applied to all charts existing in the Daily Report.
mail_send_interval option specifies the epoch in minutes after midnight that the report can be emailed. By default, if UFM was down during midnight, and was restarted after 1:00, the report of the previous day will be generated and saved, but will not be emailed. This can be changed by editing the mail_send_interval. (default value is 60 minutes, meaning that the report will be send only between 00:00 to 1:00).
log_level option specifies the Daily Report log verbosity. Default value is INFO (optional values: INFO, WARNING and ERROR).
attach_fabric_health_report option indicates whether or not to add the fabric health report as attachment to the mail. Default value is true (optional values: true or false).
fabric_health_report_timeout specifies the max time in seconds, to wait for fabric health report generation. Default value is 900 seconds (15 minutes).
In case of large fabrics, fabric health report might take longer than the default 15 minutes. User can enlarge the timeout for fabric health report to complete.
max_attached_file_size specifies the maximum file size in Bytes for each email attachment that can be sent. Default value is 2 Megabytes.
If the size of a certain file has exceeded this value, the file will not be sent as an attachment in the Daily Report mail.
[DailyReport] # top_x specifies the number of results per each top x chart. # max number can be
20.(defaultis10) top_x=10# max_reports specifies the number of reports to save. # A count of0(zero) means no copies are retained.(defaultand max is365) max_reports =365#time interval in minutes after midnight #when passed mail will not be sent mail_send_interval=60log_level = INFO daily_report_enabled =trueattach_fabric_health_report =truefabric_health_report_timeout =900# max attached file size in bytes,defaultis 2M (2097152Bytes) max_attached_file_size =2097152
max_attached_file_size specifies the maximum file size in Bytes for each email attachment that can be sent. Default value is 2 Megabytes.
The start_hour and end_hour options enable selecting a sub-range of the day, during which, the relevant report data will be collected. Since by default this option is configured to collect data from the last 24 hours, the default start_hour is set to 0 (or 00), and the default end_hour is set to 24.
If these options are configured to different values, the generated report will include data from the specified interval only. The start_hour values range is 00 to 23, and the end_hour values range is 00 to 24. The specified end_hour must be greater than the specified start_hour. If, for example, the start_hour is configured to 08, and the end_hour is configured to 10, the generated report will include data collected between 08:00-10:00 (excluding 10:00).
Sidebar
The Sidebar includes general information regarding the fabric, such as: the site name, number of switches and hosts in the fabric, and the dates on which the report was generated.
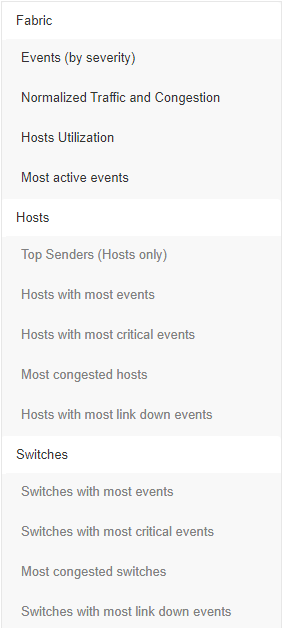
Navigation between the charts can be done via the menu charts on the sidebar.
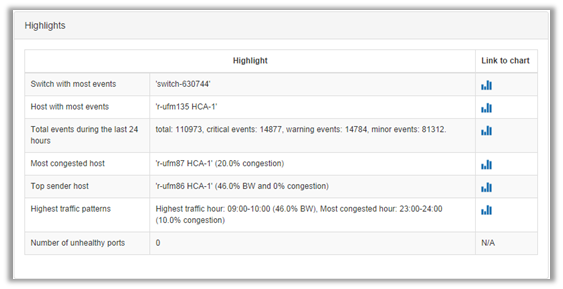
Daily Report Highlights
The top of the report shows highlight activities of the network, such as: the host with the most events, the most congested host and switch, and top sender host. To see the related chart of each highlight, click the corresponding

icon in the "Link to chart column.
Available Charts
Events by Severity
Events by Severity displays in a graphical view the distribution of all the UFM events that occurred during each hour. Events are separated into the following severity levels: Critical, Minor, and Warning.
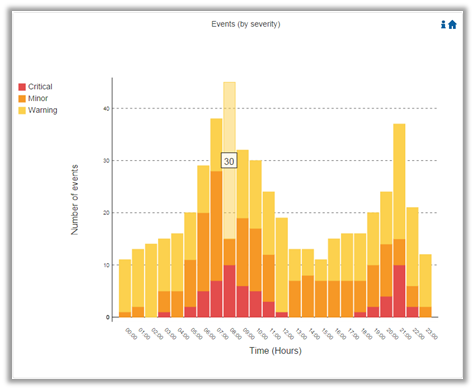
Hovering over the bars in the interactive report displays the amount of events per hour.
Normalized Traffic and Congestion
Normalized Traffic and Congestion displays in a graphical view the normalized traffic and congestions of the fabric. This graph displays the accumulated data for the Senders in the fabric (not including switches).
Congestion normalization is based on the number of delayed packets (packets that wait in the queue) and bandwidth loss.
The graph displays the percentage of the traffic utilization in green and the percentage of the congestion in red.
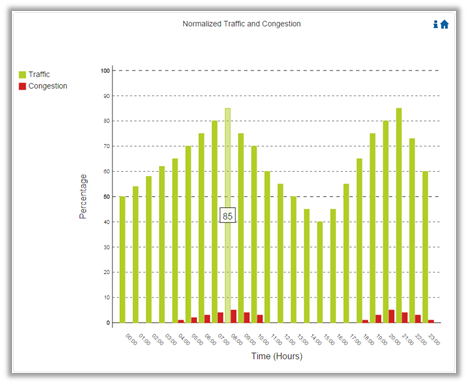
Hovering over the bars in the interactive report displays the percentage of the traffic/congestion per hour.
Hosts Utilization Distribution
Hosts Utilization Distribution displays in a graphical view the groups of hosts, where each host belongs to a specific group according to its utilization status.
To see the hosts in each group, click on the pie chart (at the interactive report).
The utilization groups are:
Very low—up to 20% utilized
Low—20–40% utilized
Moderate—40–60% utilized
High—60–80% utilized
Very high—80–100% utilized
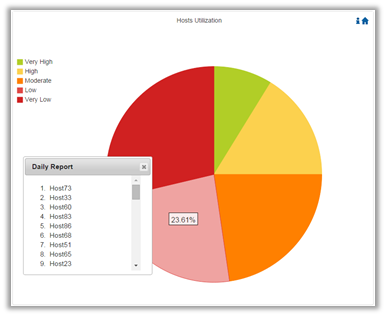
Hovering over the slices in the interactive report displays the percentage of hosts in this group.
Most Active Events
Most Active Events displays in a graphical view the most active events, ordered by the number of occurrences during the last 24 hours.
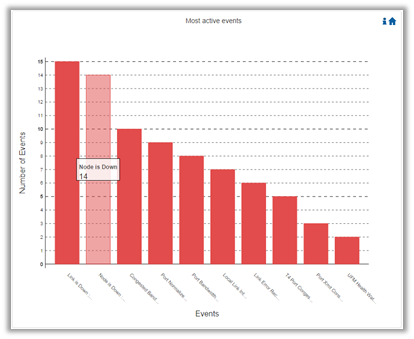
Hovering over the bars in the interactive report displays the number of occurrences for each active event, and hovering on each event’s name displays a tooltip with the event’s description.
Top Senders
Top Senders displays in a graphical view the normalized traffic and congestions of the top sender hosts. Congestion normalization is based on the number of the delayed packets (packets that wait in queue) and bandwidth loss.
The graph displays the percentage of the traffic utilization in green and the percentage of the congestion in red.
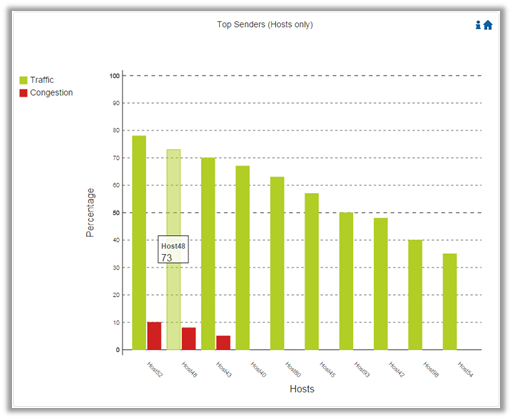
Hovering over the bars in the interactive report displays the percentage of the traffic/congestion for a selected host.
Hosts with Most Events
Hosts with Most Events displays in a graphical view the hosts with the most events. Events are separated into the following severity levels: Critical, Minor, and Warning.
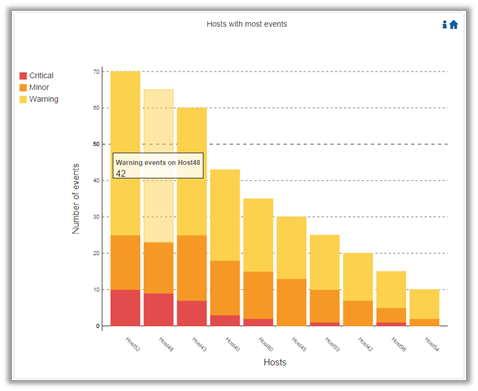
Hovering over the bars in the interactive report displays the amount of events per severity for a selected host.
Hosts with Most Critical Events
Hosts with Most Critical Events displays in a graphical view the hosts with the most critical events.
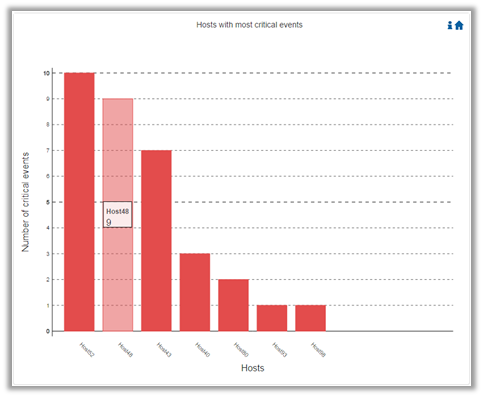
Hovering over the bars in the interactive report displays the amount of critical events for a selected host.
Most Congested Hosts
Most Congested Hosts displays in a graphical view the normalized congestions of the most congested hosts. Congestion normalization is based on the number of the delayed packets (packets that wait in queue) and bandwidth loss.
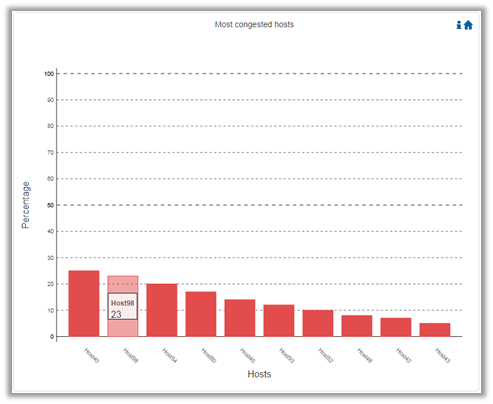
Hovering over the bars in the interactive report displays the percentage of the congestion for a selected host.
Hosts with Most Link Down Events
Hosts with Most Link Down Events displays in a graphical view the list of the hosts with the most link down events during the last 24 hours.
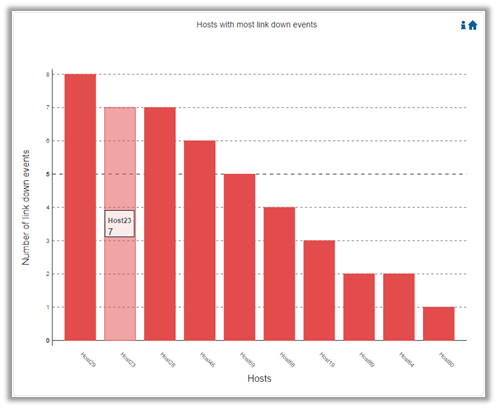
Hovering over the bars in the interactive report displays the amount of link-down events for a selected host.
Switches with Most Events
Switches with Most Events displays in a graphical view the switches with the most events. Events are separated into the following severity levels: Critical, Minor, and Warning.
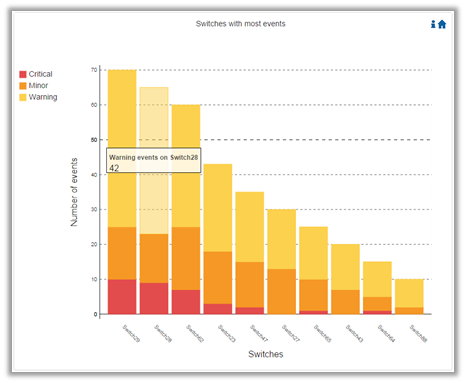
Hovering over the bars in the interactive report displays the amount of events per severity for a selected switch.
Switches with Most Critical Events
Switches with Most Critical Events displays in a graphical view the switches with the most critical events.

Hovering over the bars in the interactive report displays the amount of critical events for a selected switch.
Most Congested Switches
Most Congested Switches displays in a graphical view the normalized congestions of the most congested switches. Congestion normalization is based on the number of delayed packets (packets that wait in queue) and bandwidth loss.
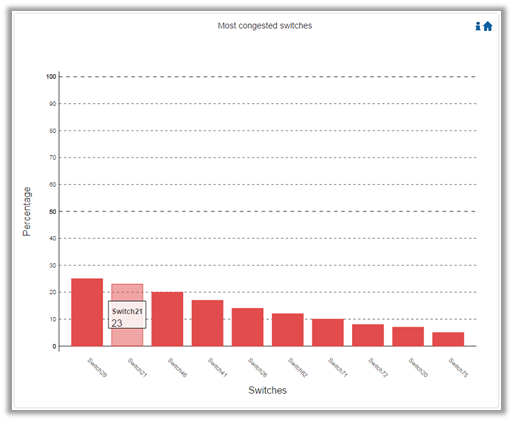
Hovering over the bars in the interactive report displays the percentage of the congestion for a selected switch.
Switches with Most Link Down Events
Switches with Most Link Down Events displays in a graphical view the list of the switches with the most link down events during the last 24 hours.
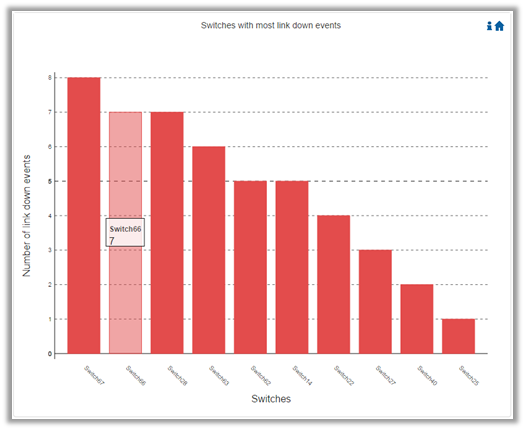
Hovering over the bars in the interactive report displays the amount of link-down events for a selected switch.
Clicking on the “help” icon

in the upper right corner of each chart, in the interactive report , will display a short description of the chart.
Clicking on the “home” icon

in the upper right corner of each chart, in the interactive report , will move the display to the beginning of the report.
On charts: “Events by Severity”, “Hosts with Most Events”, and “Switches with Most Events”, if the maximum value in the Y-axis is less than 5, an “m” unit will appear and stand for “milli".
For all charts, if the value is higher than 1000 in the Y-axis, a “k” unit will appear and stand for “killo”.
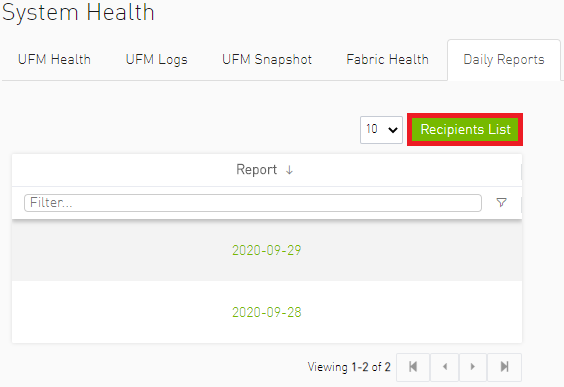
Daily Report View in the Web UI
In this tab, you can select the UFM daily reports that you wish to view and you can specify the recipients to which these daily reports will be sent.
To view a specific daily report, click the relevant report date from the list of available daily reports.
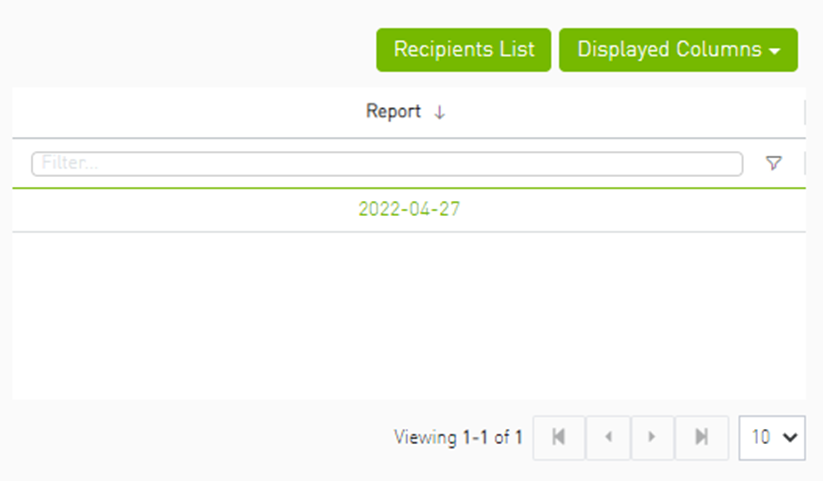
To configure the Recipients list for the daily reports, do the following:
Click Recipients List under System Health → Daily Reports tab.
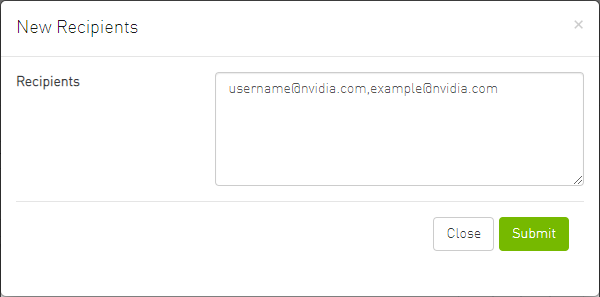
Click New.
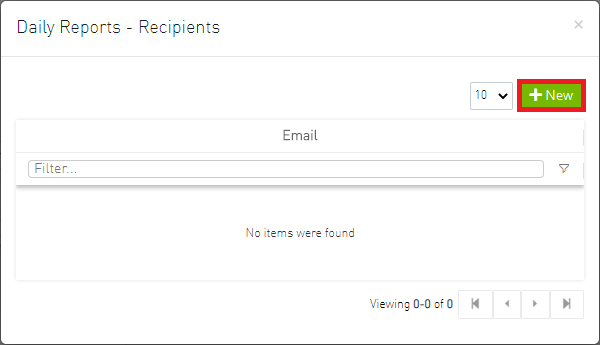
In the Recipients List window, enter valid recipient email addresses, comma-separated, and click Submit.
The new recipient/recipients will be added to the Daily Reports Recipients list.
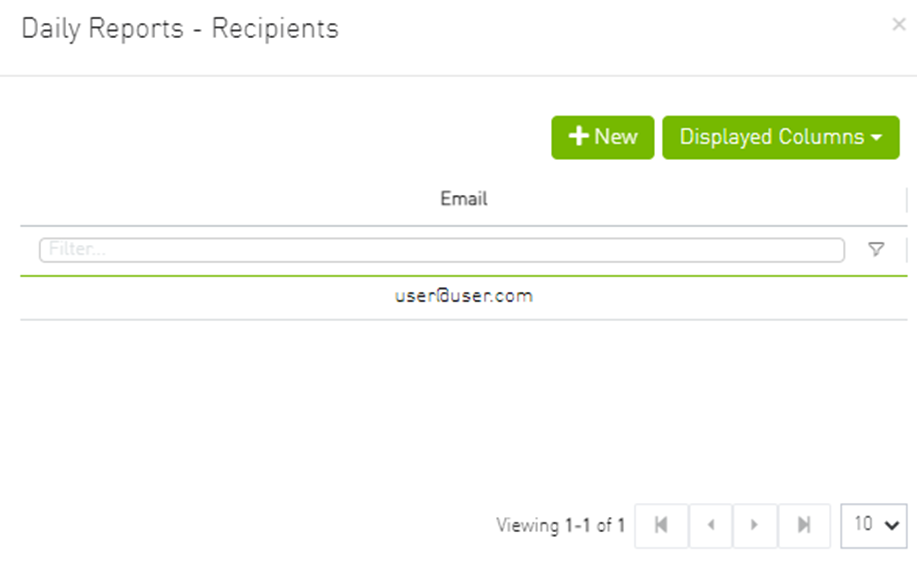
These recipients will automatically start receiving the UFM daily reports.