Network Map
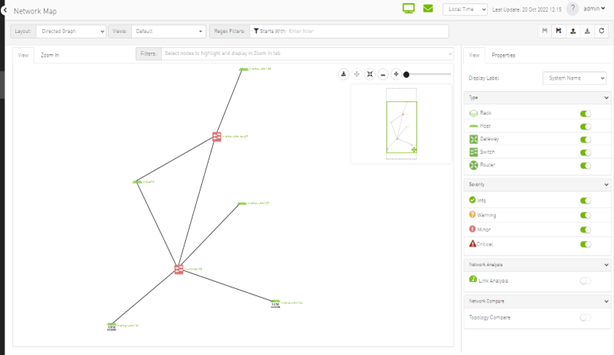
The Network Map window shows the fabric, its topology, elements and properties. UFM performs automatic fabric discovery and displays the fabric elements and their connectivity. In the Network Map window, you can see how the fabric and its elements are organized (e.g., switches and hosts).
|
Component |
Icon |
Description |
|
Switches |

|
Represents third party switches discovered/managed by UFM |
|
Hosts |

|
Represents the computer (host) connected to the discovered/managed switches |
|
Routers |

|
Represents third party routers discovered/managed by UFM |
|
Gateways |

|
Represents third party gateways discovered/managed by UFM |
|
Links |

|
Represents the connections between devices on the fabric |
|
Racks |

|
Represents all nodes (hosts) physically connected to a switch |
The level of severity of devices affects the color they are displayed in. For further information, refer to table "Device Severity Levels".
To zoom in/out of the map, scroll the mouse wheel up and down or using the slider on the right top corner
To move around in the map, press and hold down the left key while you move sideways and up/down
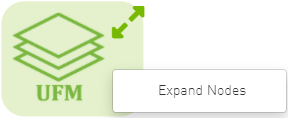
To see the hosts inside a rack, right-click the Rack icon and click "Expand Hosts"
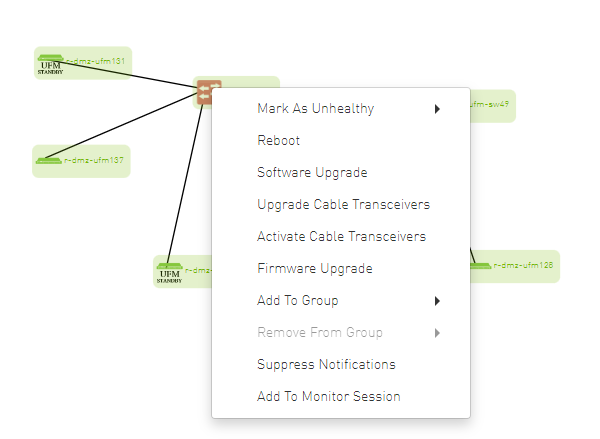
Users are able to select elements from the Network Map. Right-clicking an element opens a context menu which allows users to perform actions on it.
It is possible to select multiple elements at once using any of the following methods:
By holding down Ctrl or Shift and dragging their mouse across the map.
WarningPlease note that Ctrl starts new selection, while Shift adds to the current selection.
By holding down Shift and clicking a new element on the map.
Multi-select makes it possible for users to perform actions on multiple devices with one right-click rather than repeating the same process per device.
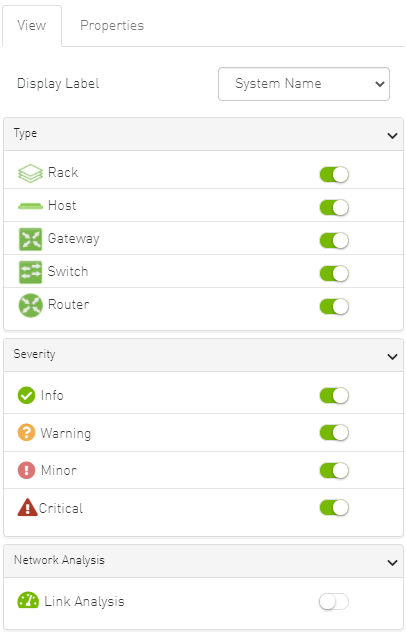
The right pane of the Network Map view enables you to control the view settings, as well as obtain further information on selected elements from the map.
The customized views created using the type and severity filters, selected fabric nodes, zoom level, and Expand/Collapse All Racks options can be saved for later access. These customized views can be saved and accessed using the bar available on top of the Network Map:

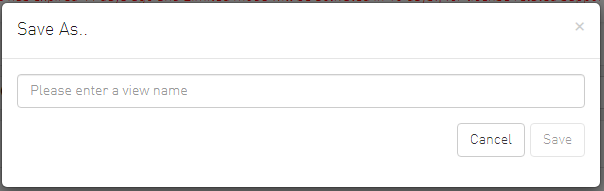
"Save As" icon (

) saves newly created customized views
"Save" icon (

) saves edits performed on existing views
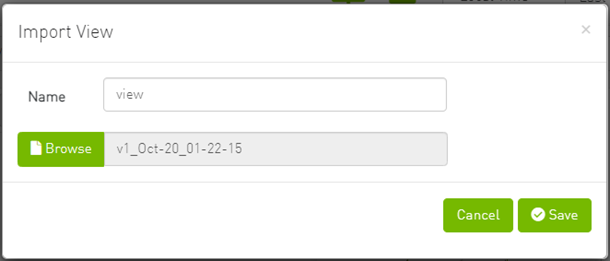
“Import” icon (

) import map from local device. The file format should be txt
“Export” icon (

) export network as text file
To reload/refresh the network map, use the refresh icon (

).
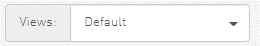
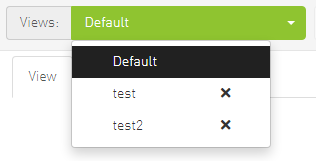
Drop down menu gives access to all previously saved views
"Default" view is a predefined view where nodes are positioned randomly, all filters are enabled, and all racks are collapsed. Changes made to this view cannot be saved unless under a new view name using the "Save As" icon.
Saved views can be deleted using the "x" button.
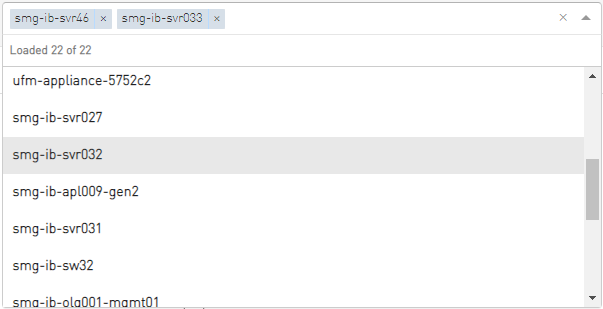
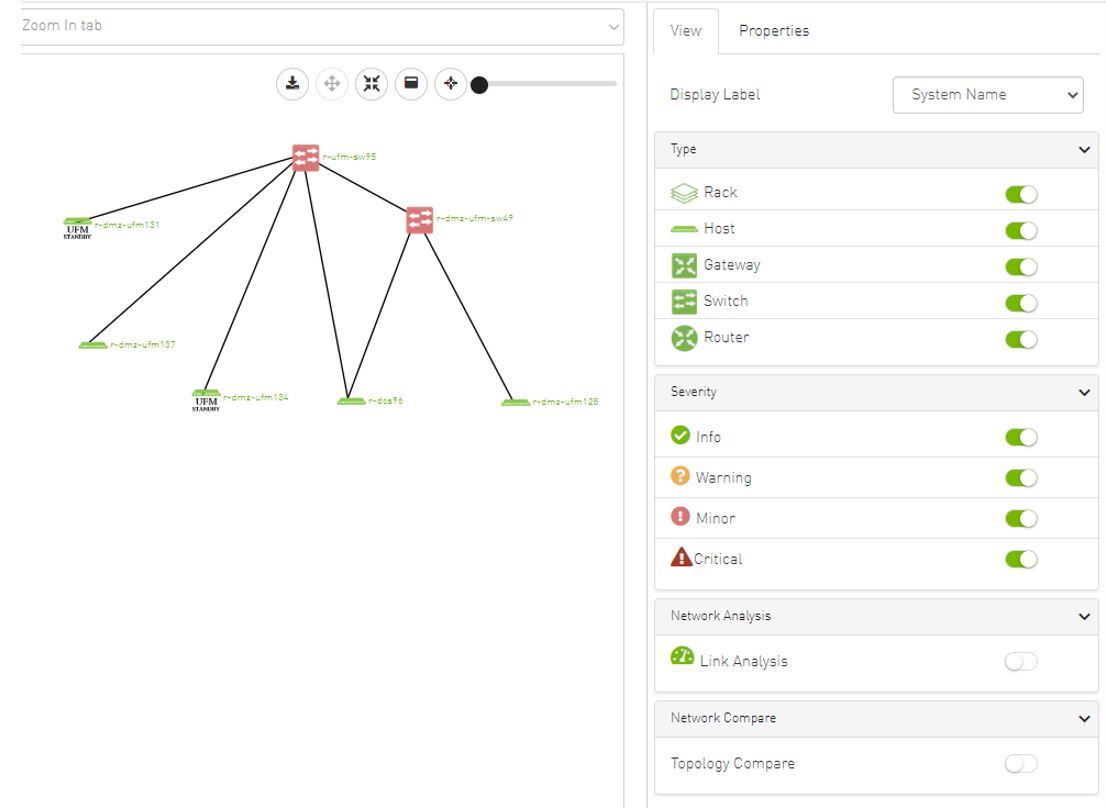
You can select a node from the dropdown menu located above the Network Map view in order to highlight/display them in the "Zoom In" tab.
The Network Map "View" tab displays the fabric containing all nodes (e.g. switches, racks including the hosts, etc).
If your fabric consists of more than 500 nodes, please note that:
The "View" tab will show only the switches in your fabric. Therefore, "Expand all racks" and "Rack filter" functions will be disabled.
Link analysis will be disabled.
To have a better experience in this instance, you can switch to the "Zoom In" tab.
The Network Map "Zoom In" tab displays only the selected nodes from the dropdown menu above the map view and the nodes directly connected to the selected nodes.
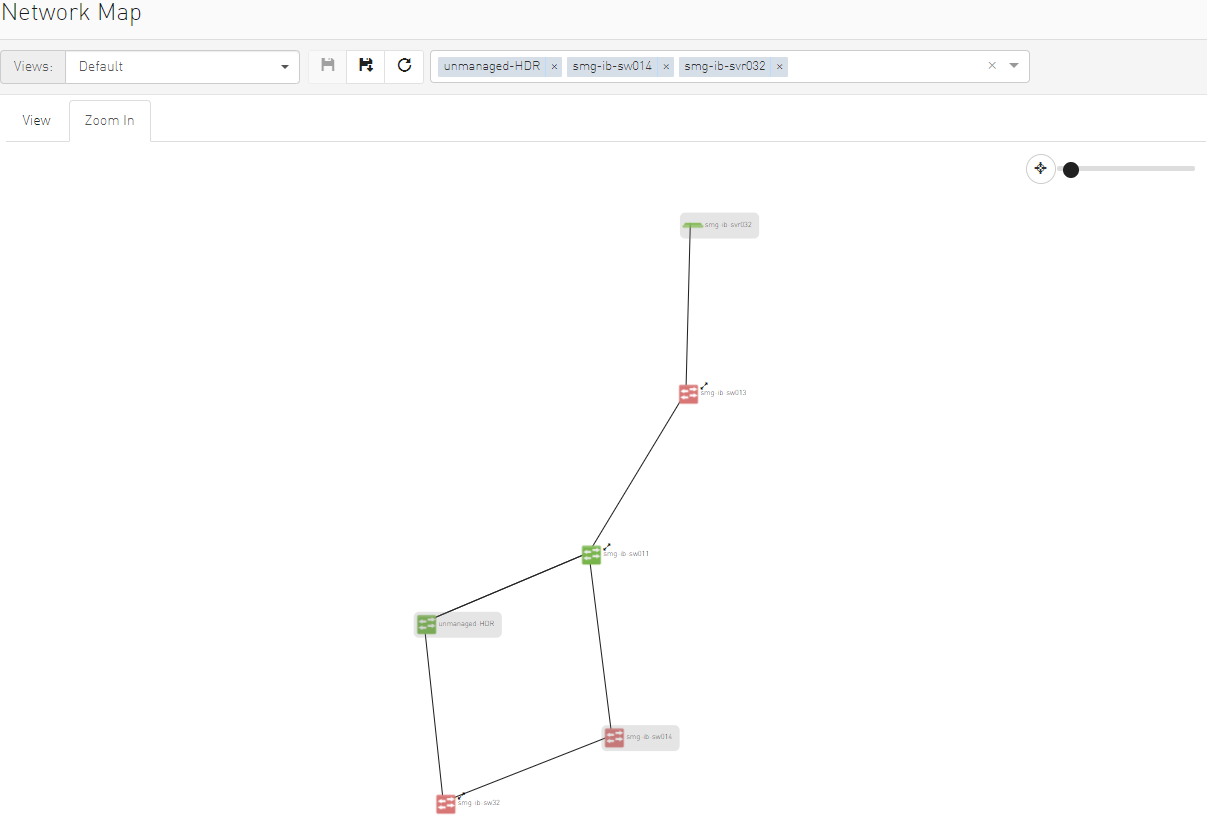
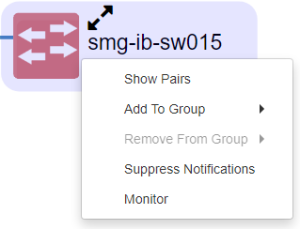
If some switches still have hidden connected nodes, you will see the following icon:
To reveal the hidden nodes connected to this switch, you can right-click it and select "Show Pairs" which adds this switch to the selected nodes list and shows the direct connected nodes to this switch.
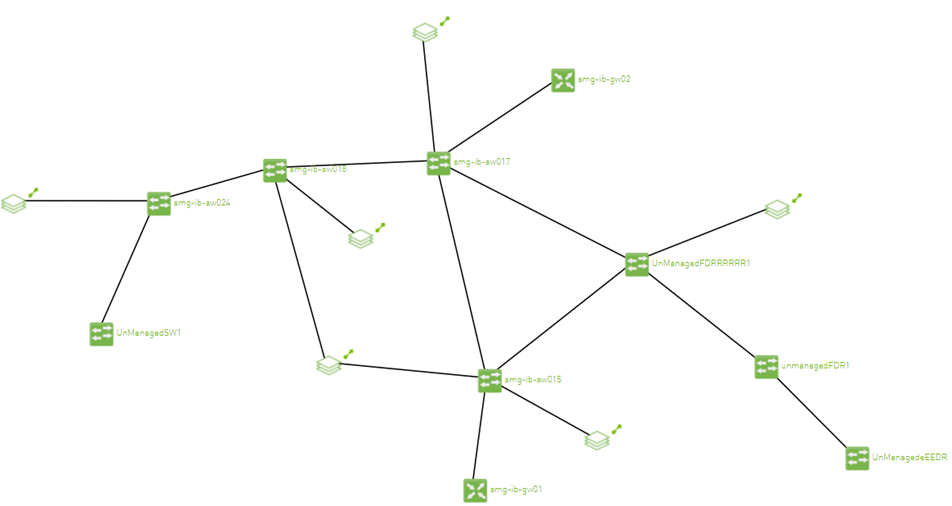
Layout controls nodes positions in the map. UFM network map supports two types of layouts:
Directed layout: the nodes are distributed depending on the connections between them so that the connected nodes will be near each other without conflict.
Hierarchical layout: the nodes are distributed as layers; each layer will contain nodes that have the same level value.
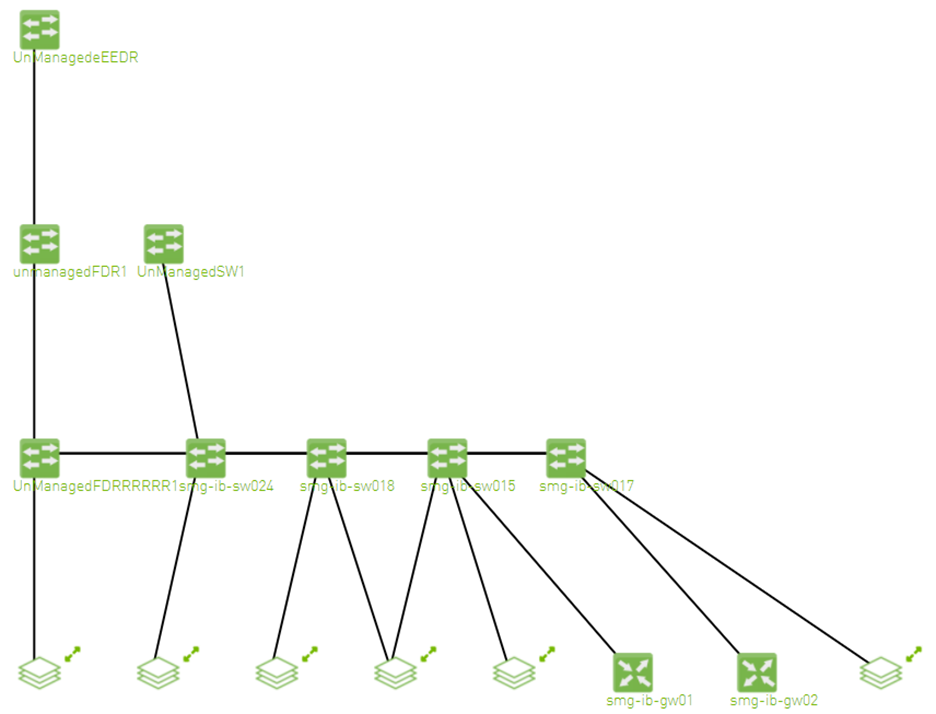
You can switch between layouts from the dropdown menu located above the Network Map view.
The default layout for small fabric (less than 30 nodes) is hierarchical and for large fabric is directed.
Enables searching for one or more elements in the map, by typing either their name or their GUID in the Search field. Note that the search mechanism is not case-sensitive.
Enables displaying the elements either by their name, GUID, or IP.
Enables viewing all hosts of all racks in the fabric using the "Expand All Racks" button.
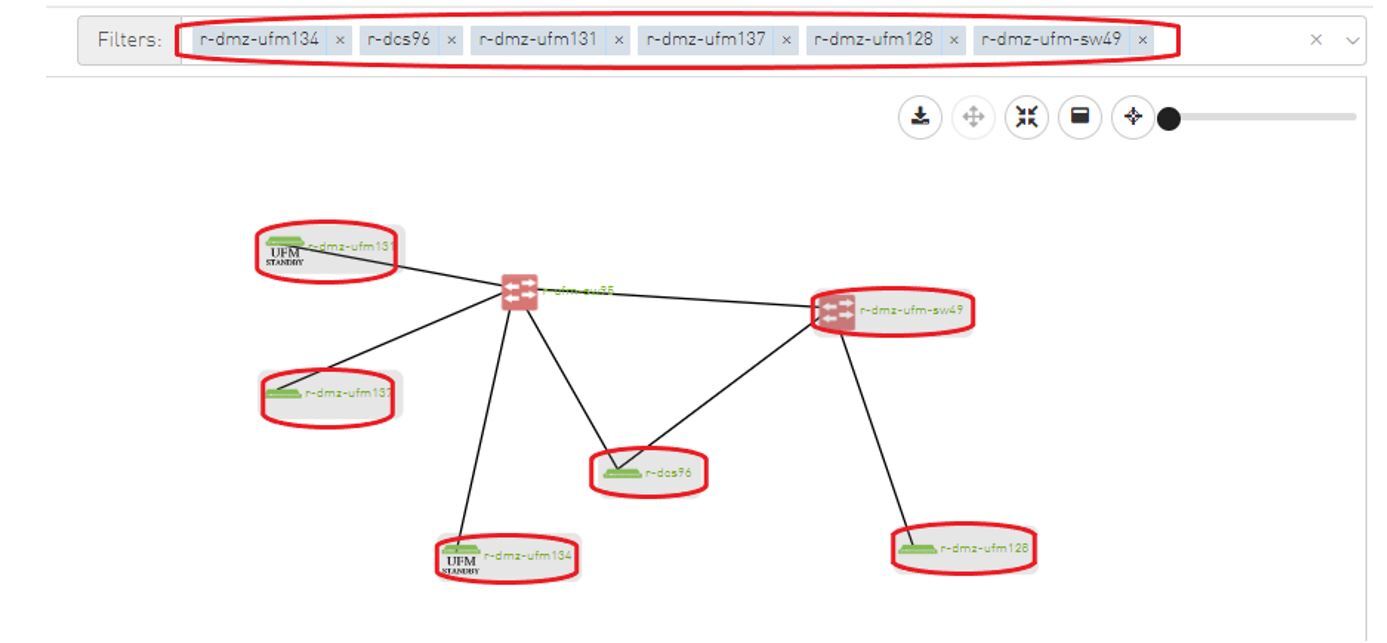
Enables customizing the view of the map by filtering for certain elements to appear in the map using the Type (see table "Network Map Components") and Severity (see table "Device Severity Levels") filters. Example:
Device Severity Levels
|
Component |
Description |

|
Info |
|
|
Critical |
|
|
Minor |

|
Warning |
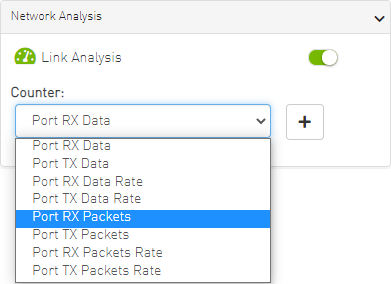
Link analysis allows the user to display the link analytics according to a selected static counter, and define the conditions on which the analysis is based. The links are colored according to the specified conditions. It is possible to define up to five conditions per counter.
The counter’s conditions are applied on four values:
The source values of the selected counter
The destination value of the selected counter
The source value of the opposite of the selected counter
The destination value of the opposite of the selected counter
The worst matched value between these four is taken into consideration.
The "Network Analysis" section on the right side under the View tab contains a radio button to enable/disable the link analysis.
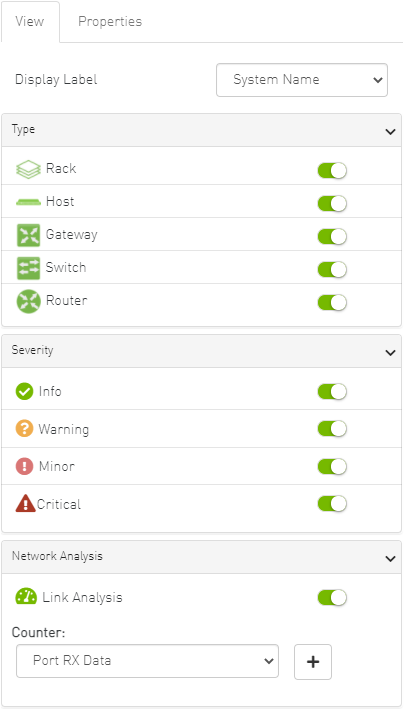
To define a condition:
Select the desired counter, and click the + button.
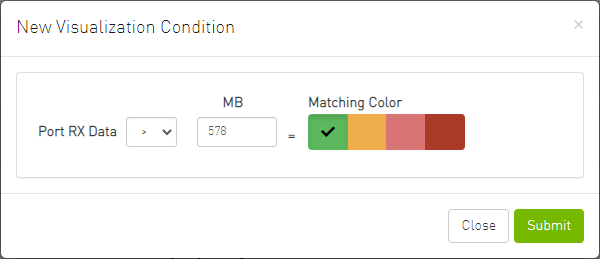
Select the appropriate operator, and define the desired threshold and color on the form that pops up. This color is applied on the link if the link monitoring value matches the respective condition.
 Warning
The colors are sorted from the lowest to the highest priority (i.e from left to right, green to red).
WarningThe counter’s conditions are sorted based on the threshold values:
Ascending if the operator is greater than (>)
Descending if the operator is smaller than (<)
Last matched condition’s color are taken into consideration in the link coloring.
Once the condition is set, the network map lights up the links that meet your condition.
 Warning
Note how the added conditions are listed in the Network Analysis section, if Link Analysis is enabled, and they are colored accordingly.
 Warning
Notice how the monitored counter is presented in boldface, and the background color is presented with the worst matched condition.
Please note that if the current layout and view are saved, the defined conditions are saved inside the view being saved.
It is possible to enable the Topology Compare feature from the View tab in the right-hand pane. When the radio button is enabled, it is possible to compare the current topology with the master topology or with a custom topology whose .topo file you may upload.

Topology compare key:
A blue node signifies an added node
A gray host signifies a deleted node
A gray and black line signifies that some links were deleted and others were unchanged
A gray and blue line signifies that some links were deleted, and others were added
A gray, blue, and black line signifies that some links were deleted, some were added, and some were unchanged
A blue and black line signifies that some links were added, and some were unchanged
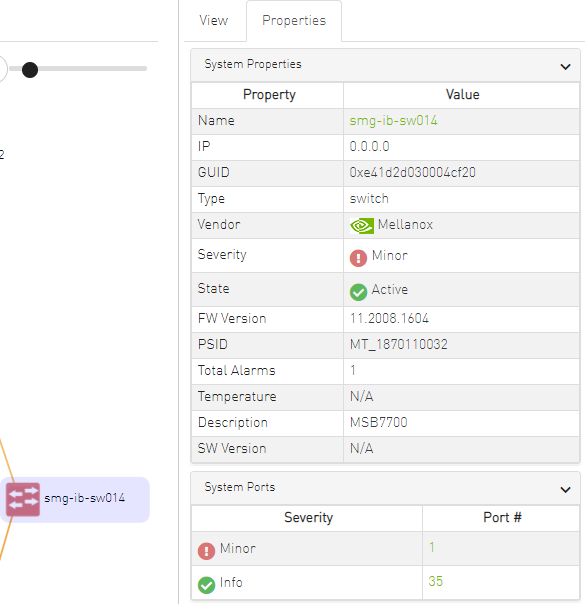
Provides details on a specific system selected from the map, as shown in the following example:
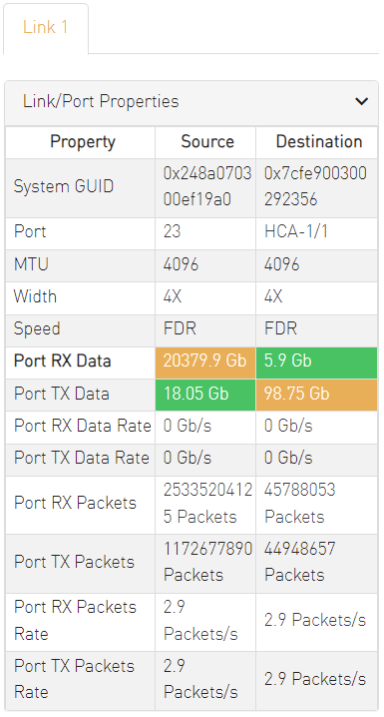
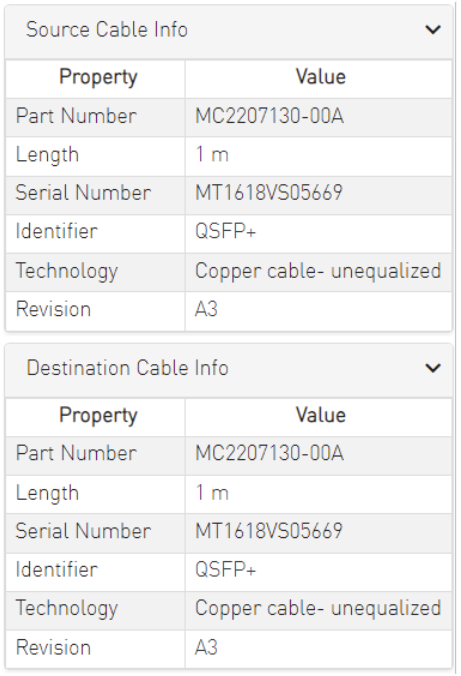
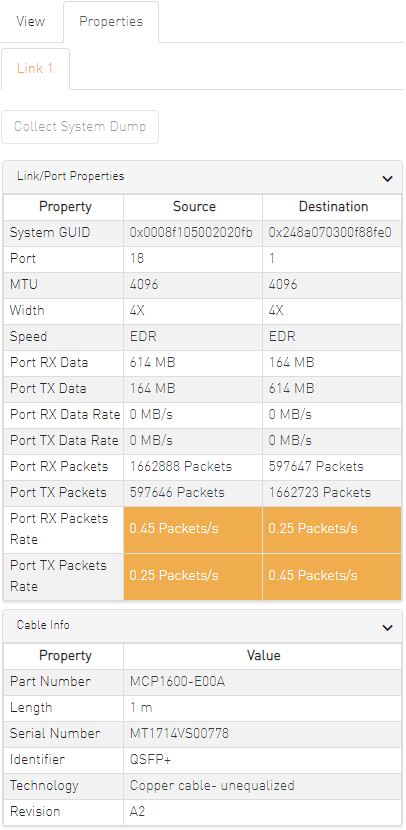
Provides link/port properties and cable info on a specific link selected from the map, including destination and source ports, as shown in the following example:
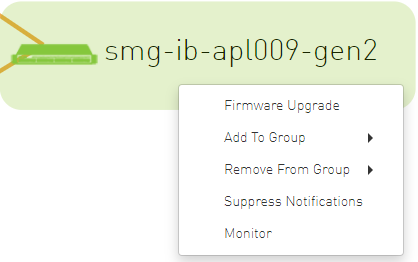
In the Network Map, a right-click on any of the elements enables performing a set of actions depending on the element type and its capabilities. See the list of available actions for each element type in the tables below.
Supported Actions for Internally Managed Switches

|
Element Type |
Supported Actions |
Description |
|
Managed Switch |
Reboot |
Reboot the switch software |
|
Mirroring Settings |
Set the mirroring configuration for the switch |
|
|
Collect System Dump |
Collect system dump from the device |
|
|
Software Upgrade |
Perform switch software upgrade |
|
|
Add to Group |
Add switch to logical group |
|
|
Remove from Group |
Remove switch from logical group |
|
|
Suppress Notification |
Suppress all event notifications for the switch |
|
|
Monitor |
Configure and activate switch monitoring |
|
|
Go to Devices |
Go to devices page and select the device |
Supported Actions for Externally Managed Switches

|
Element Type |
Supported Actions |
Description |
|
Externally Managed Switch |
Set Node Description |
Sets description for specific node |
|
Firmware Reset |
Perform switch firmware reset |
|
|
Firmware Upgrade |
Perform switch firmware upgrade |
|
|
Add to Group |
Add switch to logical group |
|
|
Remove from Group |
Remove switch from logical group |
|
|
Suppress Notification |
Suppress all event notifications for the switch |
|
|
Monitor |
Configure and activate switch monitoring |
|
|
Go To Devices |
Go to devices page and select the device |
Supported Actions for Hosts
|
Element Type |
Supported Actions |
Description |
|
Hosts |
Firmware Upgrade |
Perform switch firmware upgrade |
|
Add to Group |
Add host to logical group |
|
|
Remove from Group |
Remove host from logical group |
|
|
Suppress Notification |
Suppress all event notifications for the host |
|
|
Monitor |
Configure and activate host monitoring |