Telemetry
UFM Telemetry allows tracking network bandwidth, congestion, errors, and latency. UFM offers the following telemetry features:
Real-time monitoring views
Multiple attributes monitoring
Intelligent Counters: provide error and congestion counters
InfiniBand port-based error counters
InfiniBand congestion XmitWait counter-based congestion measurement
InfiniBand port-based bandwidth data
The following actions may be taken with the telemetry session panels:
Rearranging – using a simple drag-and-drop function
Resizing – by hovering over the panel's border
It is also possible to get a larger view of a telemetry session by clicking the pop-out button on the top right-hand corner of each panel.
Telemetry Session Objects and Attributes
Monitored objects may be ports or devices in the fabric.
Monitored attributes can be raw counters or calculated counters:
A raw attribute is a simple attribute to be monitored (e.g., Port TX Wait)
A calculated attribute is an attribute that has been calculated based on one or more counters (e.g., PortXmitPktsRate)
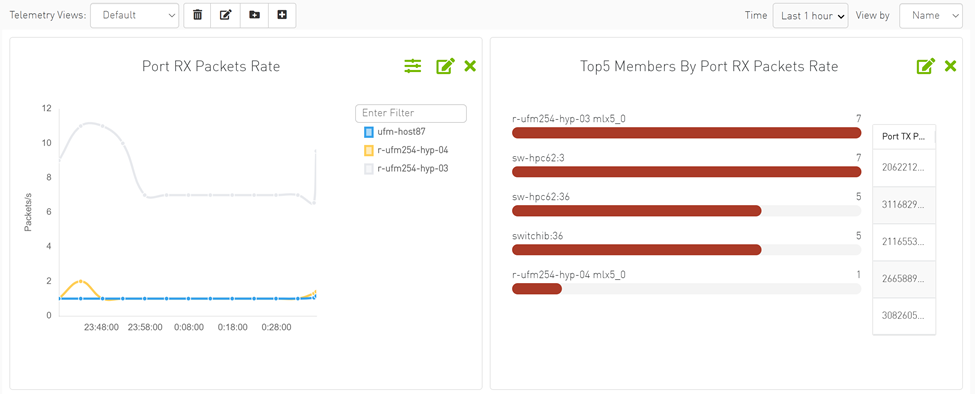
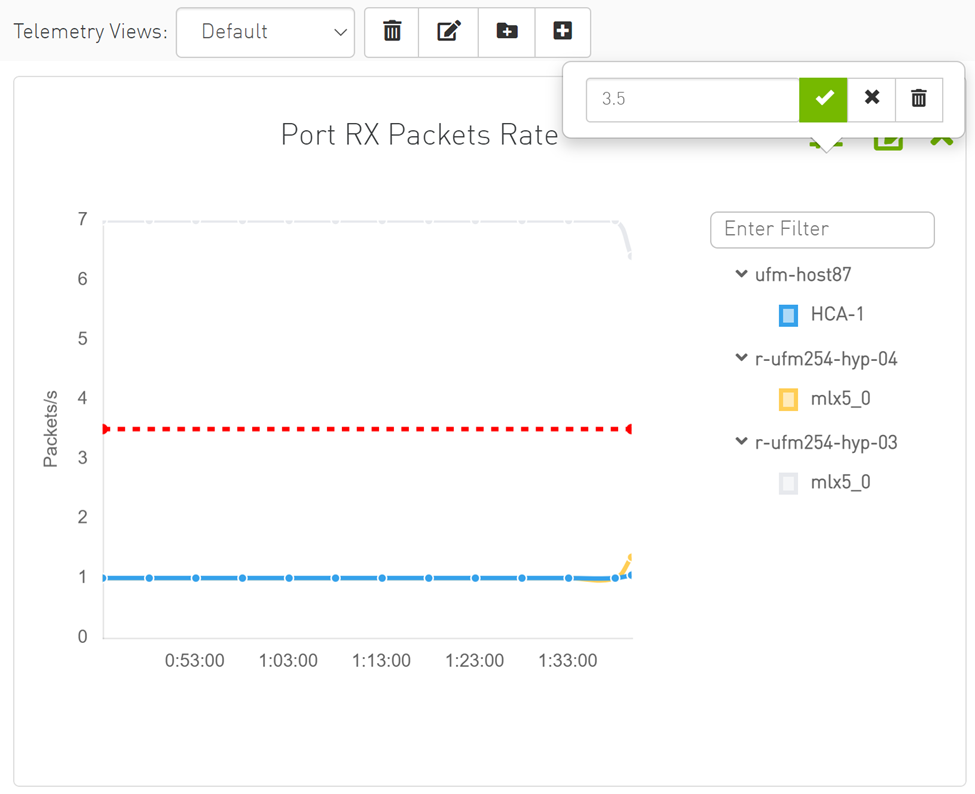
Telemetry contains multiple views; the user can create, edit, and delete views.
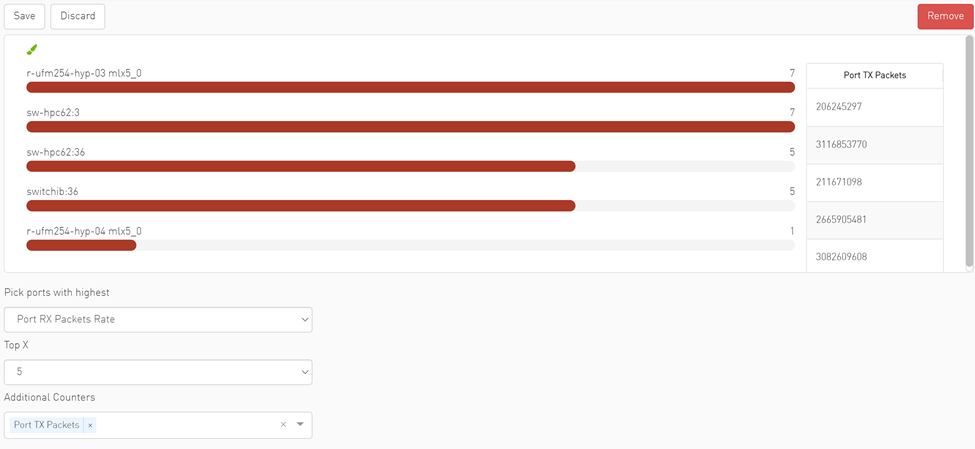
Telemetry supports two types of panels, time-series which show the relationship between time and counter value for a specific device, and topX, which show all ports with pick by counter greater than topX value.
TopX is not supported in the case of the ibpm telemetry provider. The telemetry provider is hidden in this case.
The panel can be created by filling in the following model:
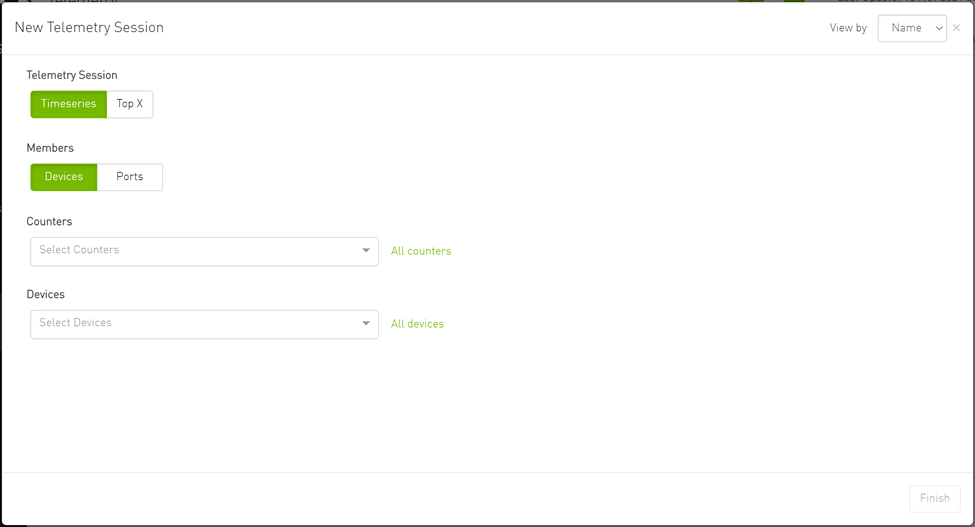
The user can select one of the following telemetry session modes:
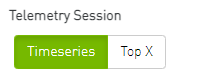
Timeseries: Provide the user with historical/live time-series graphs of the selected counters for the selected devices/ports.
Top X: Provides the user with Top X ports by the selected counters (where X is 5, 10, 15, 20).
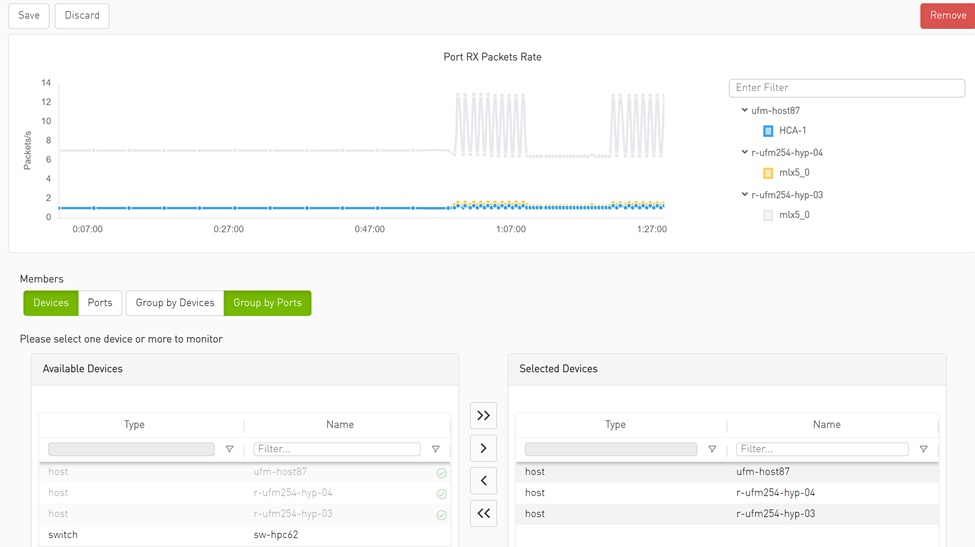
You can select the members grouping type; Devices or Ports:
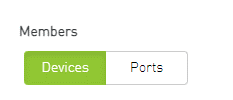
In case the selected telemetry session is Top-X, only the ports are supported.
The user can select one or more counters from the counters dropdown menu:
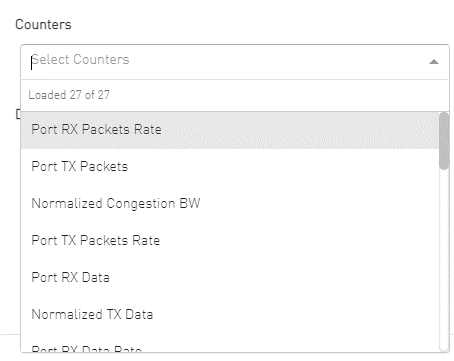
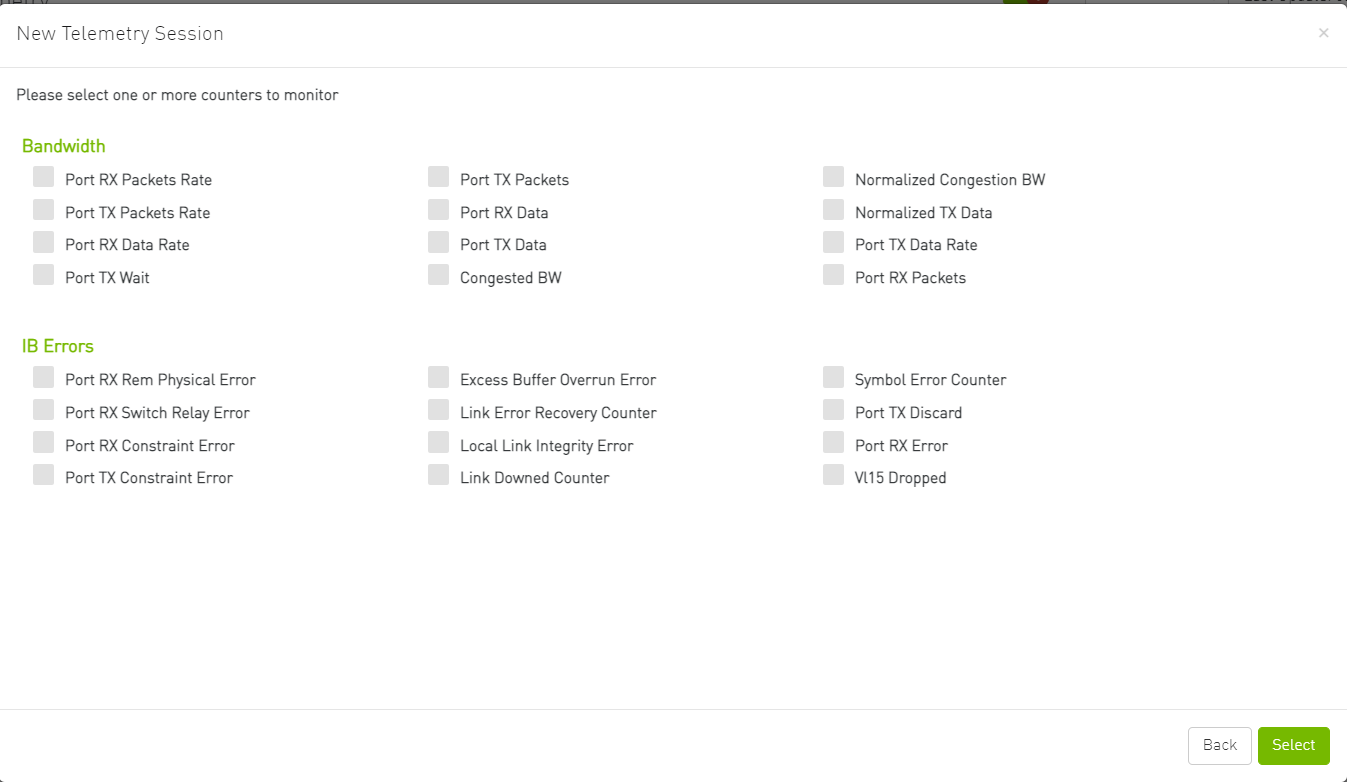
Alternatively, the user can get a full view of all the supported counters and select one or more by clicking on the "All Counters" button:
The user can select one or more devices/ports from the relevant dropdown menu:
Devices:

Alternatively, the user can choose to get a full view of the devices by clicking on the "All Devices" button:

com.atlassian.confluence.content.render.xhtml.XhtmlException: Missing required attribute: {http://atlassian.com/resource/identifier}value
Ports:
After switching from "Devices" to "Ports," you user can view the ports’ dropdown menu:
Alternatively, the user can choose to get a full view of the ports by clicking on the "All Ports" button.
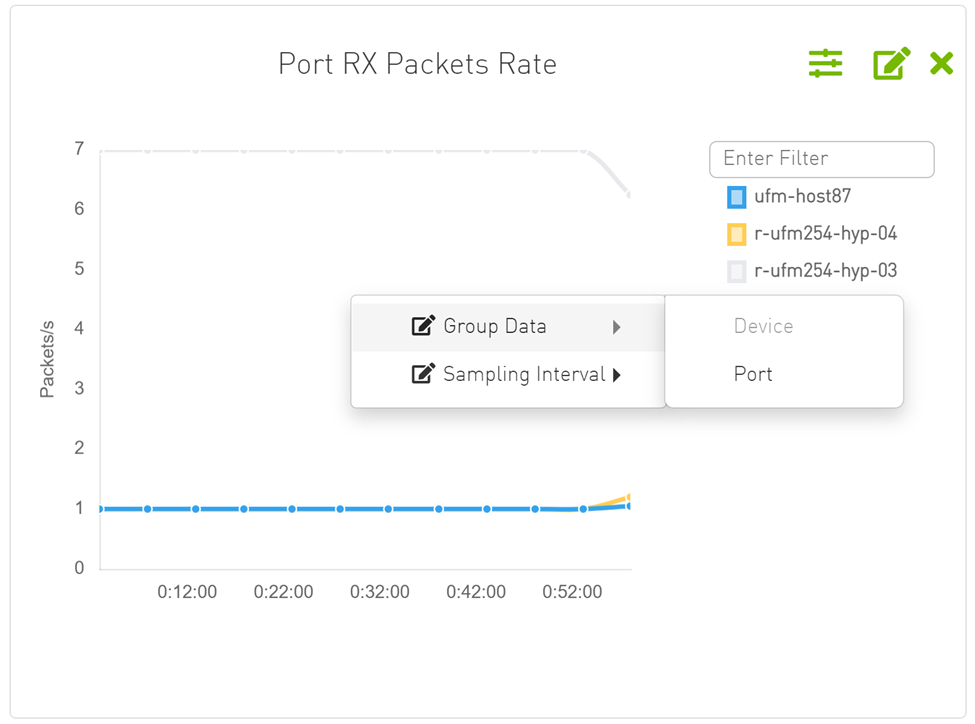
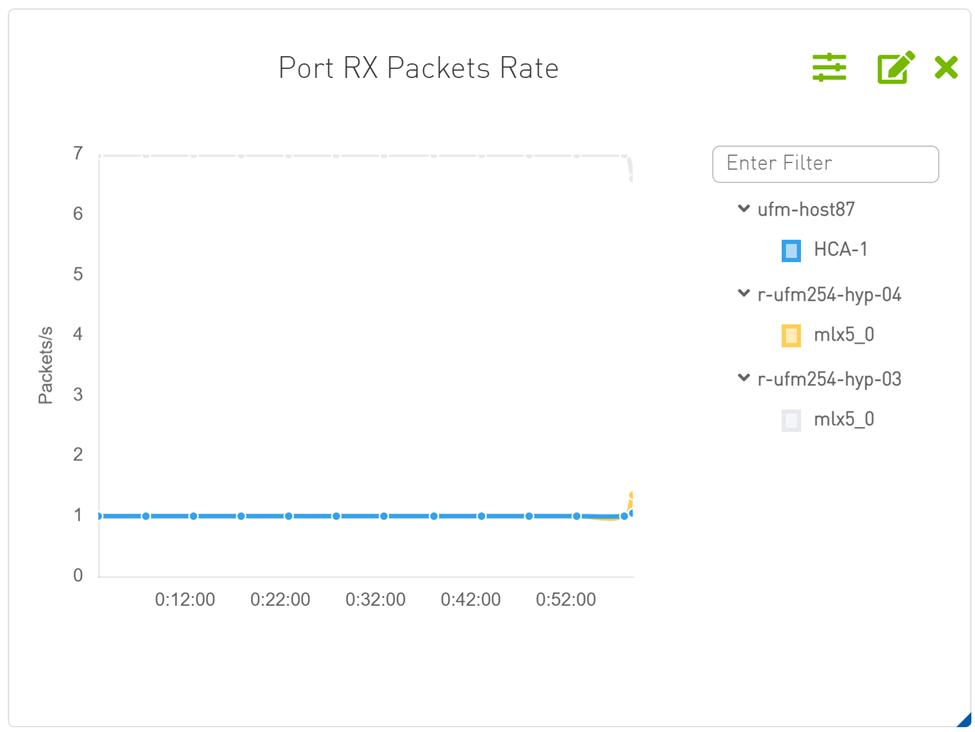
Data aggregation can be changed in the timeseries panel by grouping the members by device or ports; this functionality is an option in the context menu. Therefore, if the timeseries panel is created with the "Devices" members, the panel shows each port in an individual line by right-clicking and then grouping by ports.
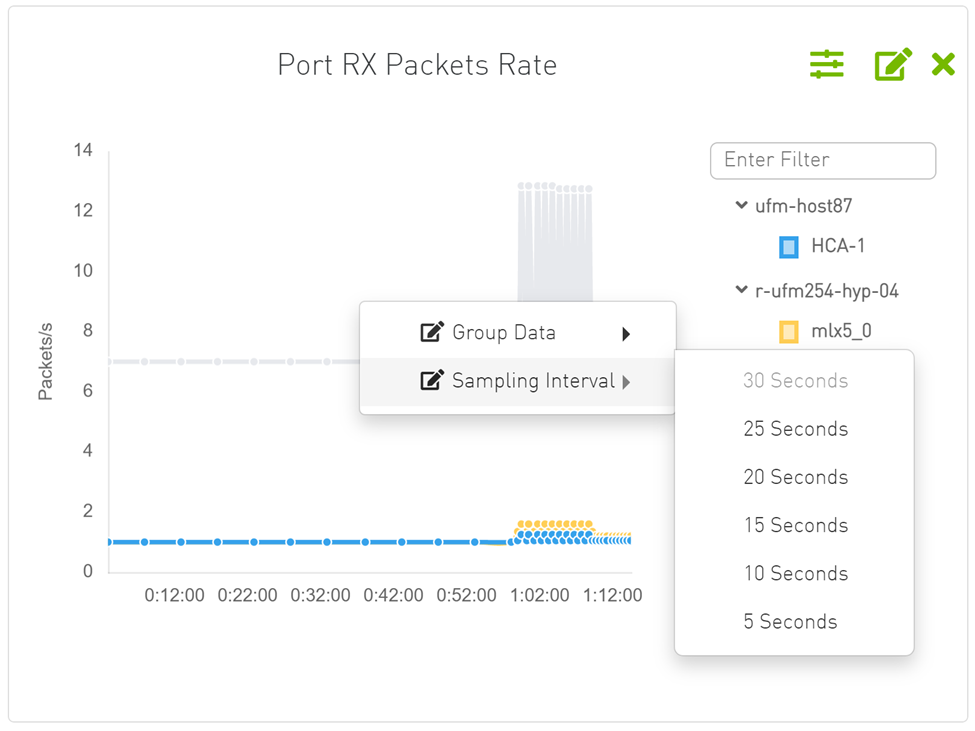
The Telemetry obtains live data from the server's each specific interval which equals the default session interval. The interval can be changed from the sampling rate option in the context menu.
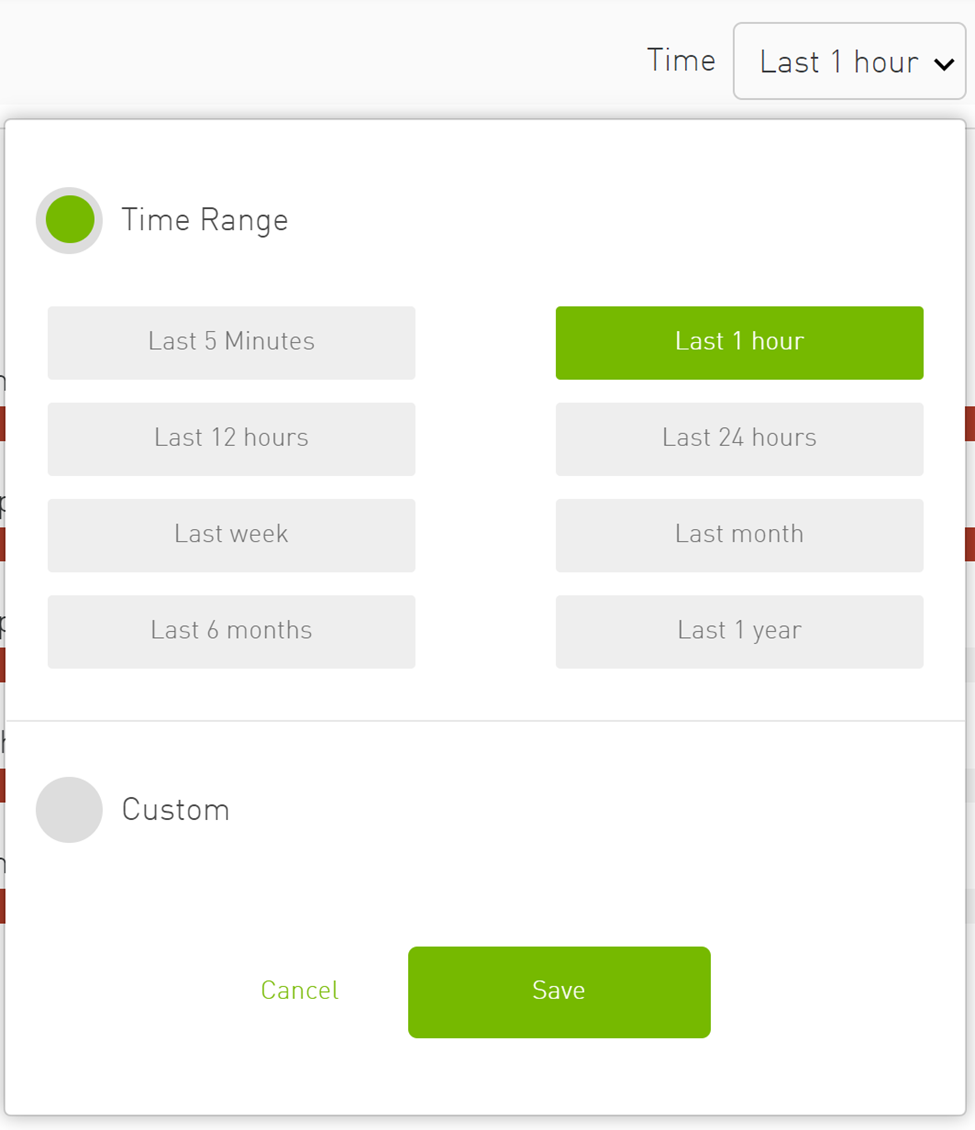
The starting time of timeseries panel can be changed from the time calendar at the top of the page, time can be "Time Range" or "Custom". In case the "Custom" option is chosen, only history data is shown.
The panel can be edited by changing members, members' type and grouping. The changes can be discarded or saved. The panel can also be deleted.
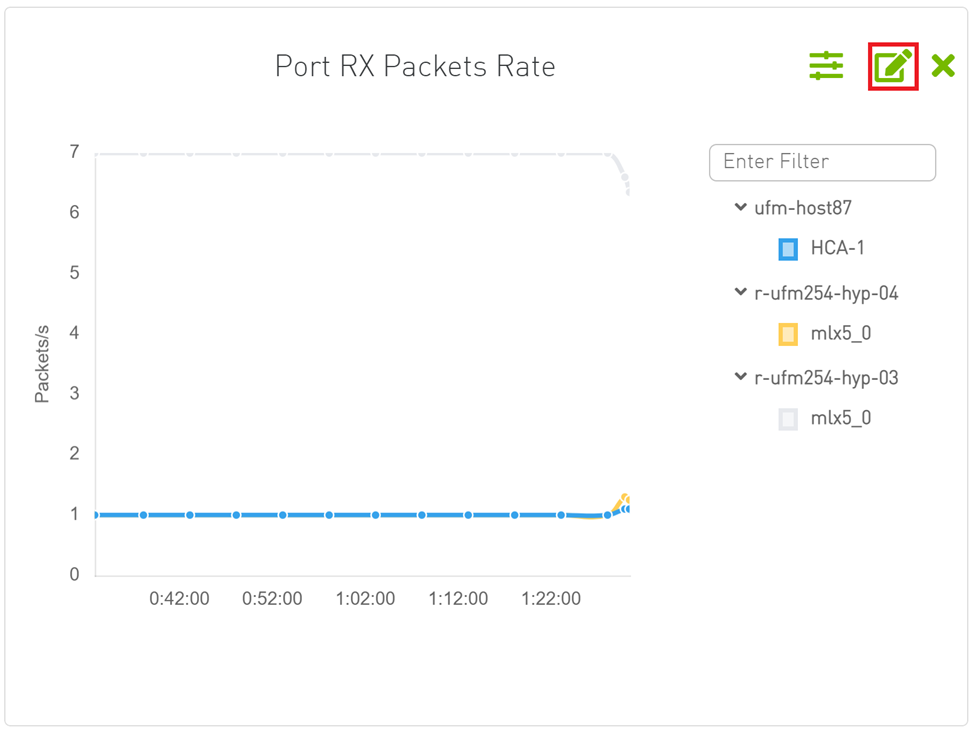
The threshold is supported in Telemetry as a line drawn at the threshold value.
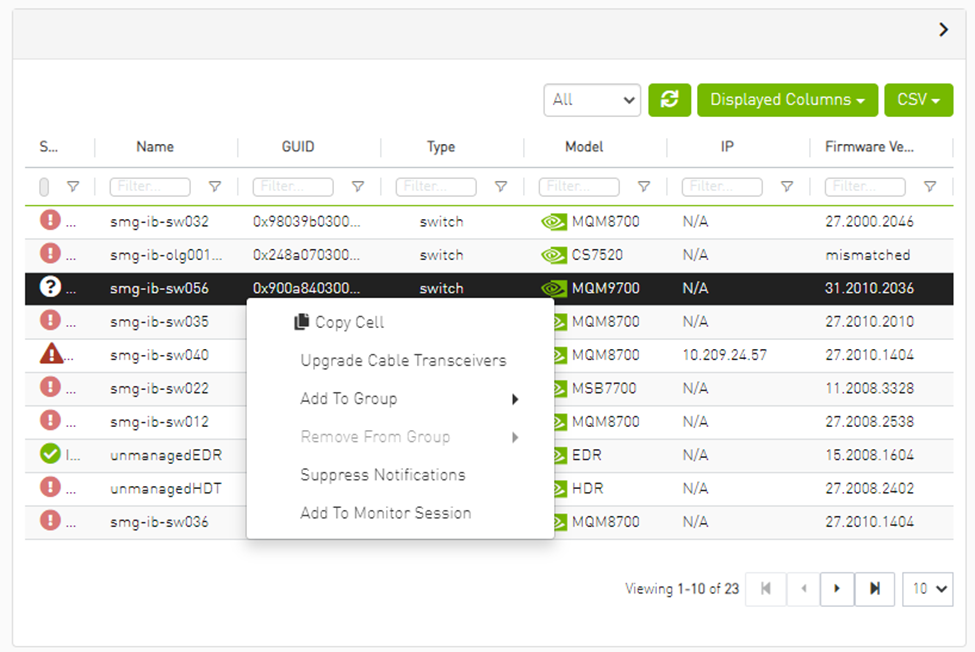
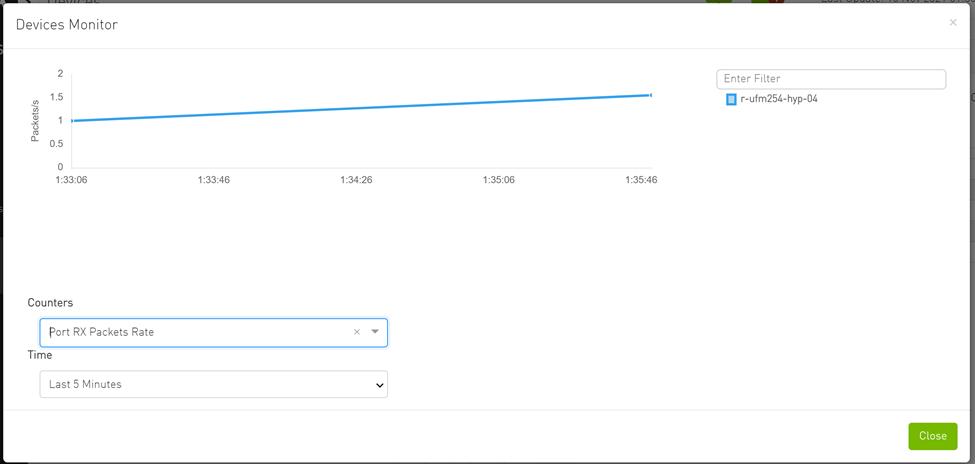
In the Devices table, the user can see telemetry data for one or multiple devices as timeseries chart by clicking on the monitoring option in the context menu.