RadarCFAR (Constant False Alarm Rate)#
Overview#
Constant False Alarm Rate (CFAR) is a fundamental radar signal processing technique used for automatic target detection in the presence of varying noise and clutter environments. CFAR follows Range FFT and Doppler FFT in the radar processing pipeline, operating on range-Doppler magnitude maps to detect targets while maintaining a constant false alarm rate. The algorithm adaptively estimates the local noise floor using training cells and applies a threshold to identify potential targets, making it robust to spatially varying clutter and interference.
The CFAR operator is designed to process 2D range-Doppler magnitude maps and produce a detection list containing the coordinates (range index and Doppler index) of detected targets. This implementation supports the Cell Averaging (CA-CFAR) algorithm variant, which is widely used in radar systems due to its computational efficiency and effectiveness in homogeneous clutter environments.
Algorithm Description#
The CFAR algorithm operates by processing each cell in the range-Doppler map, treating it as a Cell Under Test (CUT). For each CUT, the algorithm estimates the local noise level using neighboring cells and compares the CUT value against an adaptive threshold to determine if it represents a valid target.
Cell Window Structure#
The CFAR algorithm uses a structured window around each CUT:
Where:
\(N\) = number of training cells (numTrain)
\(K\) = number of guard cells (numGuard)
\(CUT\) = Cell Under Test
\(T_i\) = Training cells for noise estimation
\(G_i\) = Guard cells to prevent the noise estimate from being corrupted by a target signal that may be present in the CUT
Cell Averaging CFAR#
The Cell Averaging CFAR algorithm computes the noise estimate as the average of training cells:
The threshold factor is calculated based on the desired probability of false alarm (\(P_{fa}\)) and the number of training cells:
Where:
\(N\) = number of training cells
\(P_{fa}\) = desired probability of false alarm
The detection threshold is computed as:
A target is detected when:
Two-Dimensional Processing#
The operator performs CFAR processing in two stages:
Horizontal CFAR: Processes along the range dimension (horizontal) to detect targets based on range-domain noise characteristics
Vertical CFAR: Processes along the Doppler dimension (vertical) to detect targets based on velocity-domain noise characteristics
The final detection list contains only cells that pass both horizontal and vertical CFAR thresholds (logical AND operation).
Peak Grouping#
When peak grouping is enabled, the algorithm performs Non-Maximum Suppression (NMS) to retain only local maxima:
In horizontal direction: Detections are retained only if their magnitude is greater than the magnitudes of their immediate left and right neighbors.
In vertical direction: Detections are retained only if their magnitude is greater than the magnitudes of their immediate top and bottom neighbors.
This reduces false alarms and ensures that only the peak of each target cluster is reported.
Implementation Details#
Dataflow Configuration#
The operator uses multiple RasterDataFlows (RDF) to efficiently transfer data between DRAM and VMEM:
Row Source DataFlow: Transfers magnitude data for horizontal processing with tile size (Width x 8) and transpose mode enabled
Column Source DataFlow: Transfers magnitude data for vertical processing with tile size (8 x Height)
Output DataFlow: Transfers detection list from VMEM to DRAM with tile size (2 x MaxDetections)
Output Count DataFlow: Transfers detection count scalar value
The row and column source dataflows are configured with the same head to ensure they never execute simultaneously, allowing both to utilize full DMA resources.
Buffer Allocation#
mag: Input buffer for magnitude data with double buffering, tile size varies based on processing stage
peaks: Output buffer for detection list with double buffering, size (MaxDetections x 2)
peaksCount: Output buffer for detection count, size (1 x 1)
cumSum: Intermediate buffer for cumulative sum computation, size accommodates padded dimensions
horPeakMask: Bit-packed mask buffer for horizontal CFAR results
verPeakMask: Bit-packed mask buffer for vertical CFAR results
horCountMap: Lookup table for horizontal division factors (precomputed 1/count values for boundary handling)
verCountMap: Lookup table for vertical division factors (precomputed 1/count values for boundary handling)
Kernel Implementation#
Tiling Strategy#
The operator uses separate tiling strategies for horizontal and vertical processing to optimize memory access patterns:
Horizontal Processing Tiles
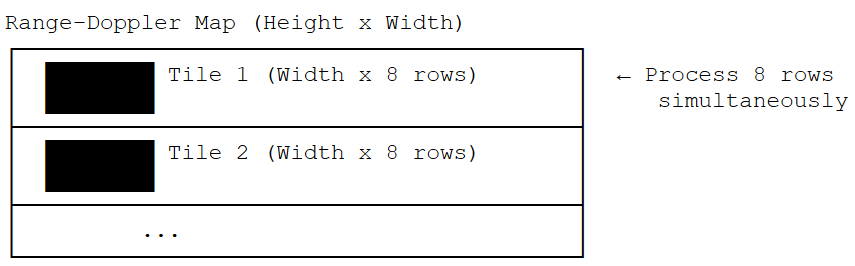
Horizontal processing tiles: each tile processes full width with 8 rows simultaneously#
Vertical Processing Tiles
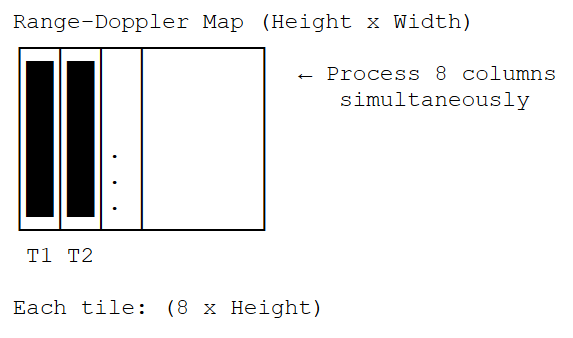
Vertical processing tiles: each tile processes 8 columns with full height simultaneously#
Horizontal CFAR Processing#
Cumulative Sum Computation: Computes cumulative sum along the horizontal (range) dimension using vectorized operations
Handles cyclic or zero padding based on configuration
Processes width + 2*(numHorTrain + numHorGuard) columns accounting for padding
Uses efficient vector load/store with transpose operations
Cumulative Sum Calculation Example
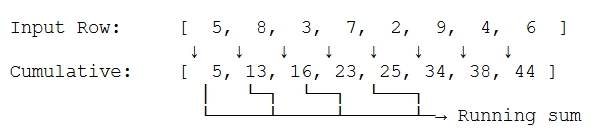
For each position i: CumSum[i] = CumSum[i-1] + Input[i]
Used later to compute sum of any range [a,b] = CumSum[b] - CumSum[a]
With Padding (N=3 train, K=1 guard, Width=8):
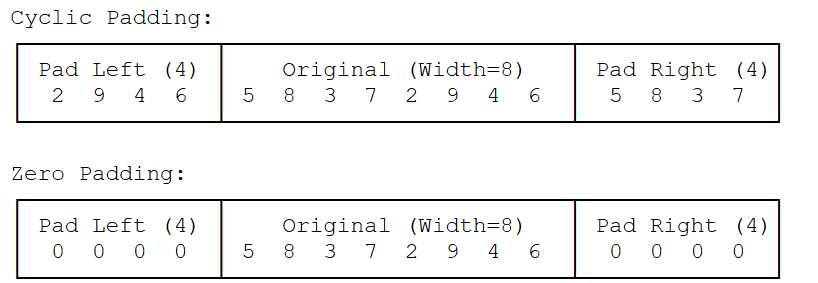
Cumulative sum computation with cyclic and zero padding examples#
CFAR Thresholding: Computes noise estimate and applies threshold for each cell
Calculates leading and trailing sums using cumulative sum differences
Computes noise level by averaging training cell values
Applies threshold factor and generates bit-packed detection mask
- Uses
vmulwandvbitcmp_sVPU instructions for efficient computation vbitcmp_scompares 8 cell values simultaneously against their respective thresholds in a single instructionProduces a bit-packed result (1 bit per cell) where 1 indicates cell value >= threshold, 0 otherwise
Bit packing reduces memory footprint by 32x (from 32-bit integers to 1-bit flags), improving VMEM utilization
Better load/store efficiency: 8 detection results fit in a single byte, reducing memory bandwidth requirements
Enables efficient logical operations (AND, OR) on detection masks during NMS and final mask fusion
- Uses
CFAR Window and Thresholding
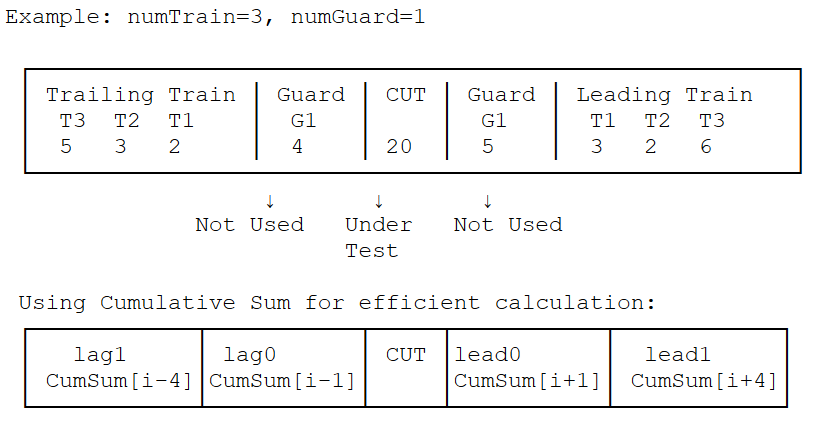
CFAR window structure showing training cells, guard cells, and threshold calculation#
TrailingSum = CumSum[lag0] - CumSum[lag1]
            = Sum of [T1, T2, T3]

LeadingSum  = CumSum[lead1] - CumSum[lead0]
            = Sum of [T1, T2, T3]

NoiseEstimate = (TrailingSum + LeadingSum) / (2 * numTrain)
              = (2+3+5 + 3+2+6) / (2 * 3)
              = 21 / 6 = 3.5

Threshold = NoiseEstimate × ThresholdFactor
          = 3.5 × 2.0 = 7.0

Detection: CUT >= Threshold ?
            20 >= 7.0 ? YES → Target Detected! ✓
Horizontal NMS (optional): Performs Non-Maximum Suppression along horizontal direction
Compares each detection with left and right neighbors
Retains only local maxima using bit-packed mask operations
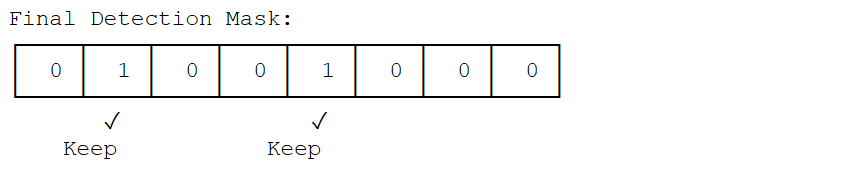
Non-Maximum Suppression (NMS) Example
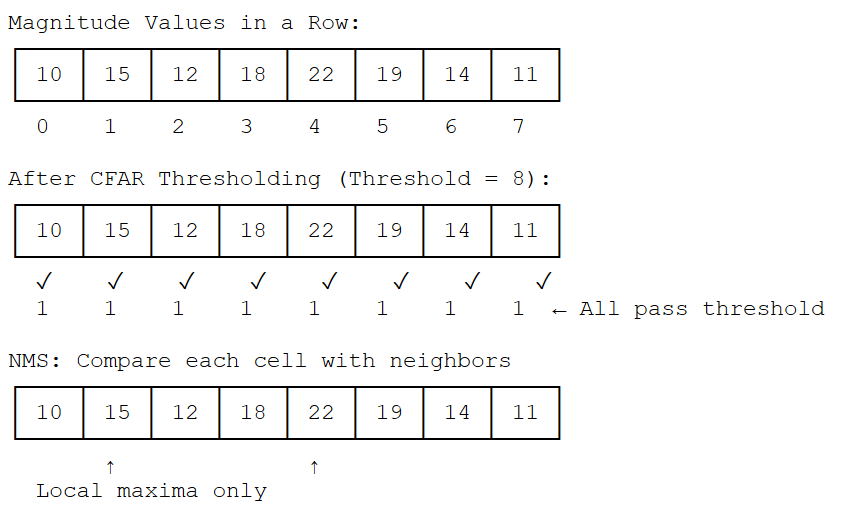
Position 1: 15 > 10 AND 15 > 12 → Keep ✓ (Peak!)
Position 2: 12 < 15 → Remove ✗
Position 3: 18 > 12 AND 18 < 22 → Remove ✗
Position 4: 22 > 18 AND 22 > 19 → Keep ✓ (Peak!)
Position 5: 19 < 22 → Remove ✗
Bit-packed representation (8 bits per byte): Mask = 0b01001000 = 0x48
Non-Maximum Suppression process showing peak detection and filtering
Vertical CFAR Processing#
Cumulative Sum Computation: Computes cumulative sum along the vertical (Doppler) dimension
Similar to horizontal processing but operates on transposed data layout
Processes height + 2*(numVerTrain + numVerGuard) rows
CFAR Thresholding: Applies vertical CFAR threshold
Operates on column-wise data organization
Generates separate bit-packed mask for vertical detections
Vertical NMS (optional): Performs Non-Maximum Suppression along vertical direction
Compares each detection with top and bottom neighbors
Detection List Generation#
Mask Fusion: Combines horizontal and vertical detection masks using logical AND operation
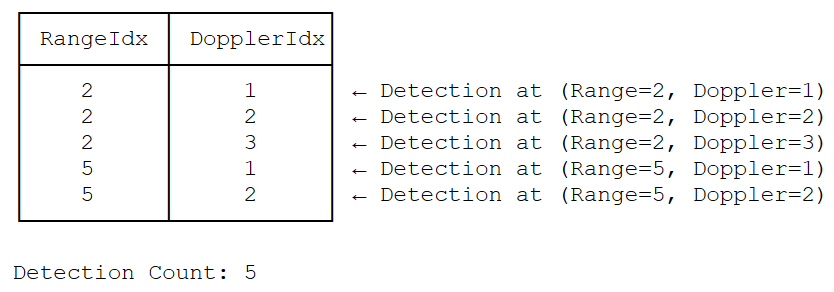
Peak Extraction: Scans fused mask to extract detection coordinates
Output Formatting: Writes detection coordinates [rangeIdx, dopplerIdx] to output tensor
Count Update: Updates detection count in output count tensor
2D CFAR Detection Mask Fusion
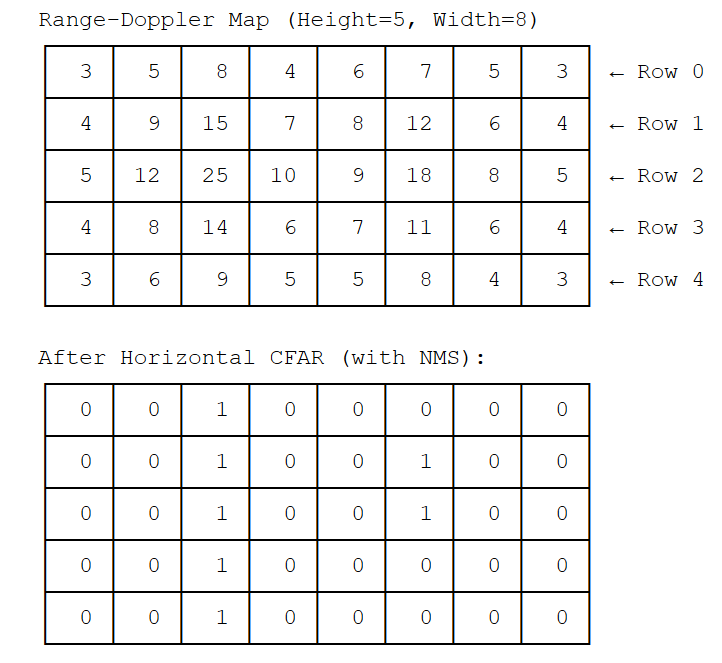
Horizontal CFAR detection mask after thresholding and NMS#
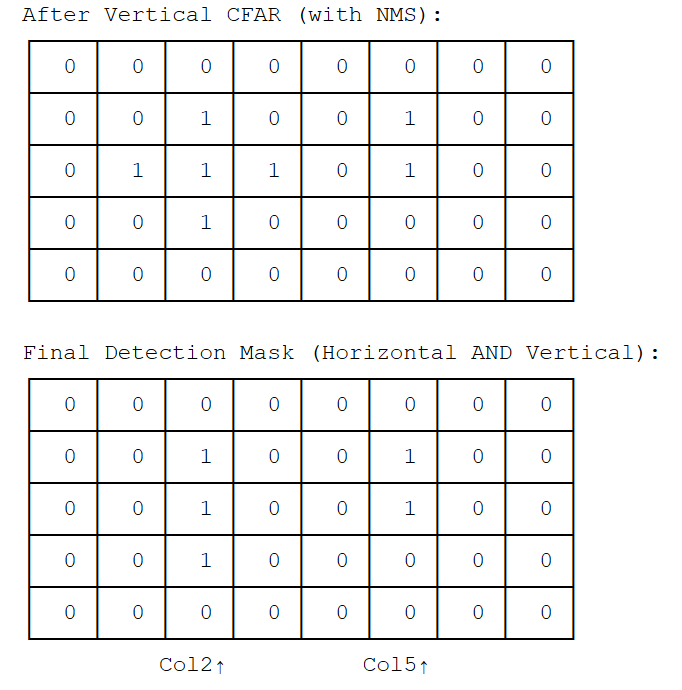
Vertical CFAR detection mask and final fused detection results#
Detection List Output
Performance#
Performance considerations:
Execution Time is the average time required to execute the operator on a single VPU core.
Note that each PVA contains two VPU cores, which can operate in parallel to process two streams simultaneously, or reduce execution time by approximately half by splitting the workload between the two cores.
Total Power represents the average total power consumed by the module when the operator is executed concurrently on both VPU cores.
Idle power is approximately 7W when the PVA is not processing data.
For detailed information on interpreting the performance table below and understanding the benchmarking setup, see Performance Benchmark.
TensorSize |
HorTrain |
HorGuard |
VerTrain |
VerGuard |
HorCyclic |
VerCyclic |
PeakGrouping |
Execution Time |
Submit Latency |
Total Power |
|---|---|---|---|---|---|---|---|---|---|---|
32x512 |
15 |
0 |
255 |
0 |
false |
false |
false |
0.094ms |
0.032ms |
10.338W |
32x512 |
15 |
0 |
255 |
0 |
true |
false |
false |
0.099ms |
0.033ms |
10.338W |
32x512 |
15 |
0 |
255 |
0 |
true |
true |
false |
0.095ms |
0.034ms |
10.338W |
32x512 |
15 |
0 |
255 |
0 |
true |
true |
true |
0.139ms |
0.022ms |
9.736W |
32x512 |
6 |
3 |
6 |
3 |
true |
true |
true |
0.129ms |
0.025ms |
9.836W |
512x256 |
6 |
3 |
6 |
3 |
true |
true |
true |
0.674ms |
0.026ms |
9.335W |
512x512 |
6 |
3 |
6 |
3 |
true |
true |
true |
1.295ms |
0.027ms |
9.836W |