Geneformer
Contents
Geneformer#
Model Overview#
Description:#
Geneformer generates a dense representation of a sc-RNA cell by learning co-expression patterns within single cells. Geneformer is a tabular count model trained on sc-RNA from the Chan Zuckerberg Cell x Gene census. Geneformer computes a complete embedding for each cell over the top 1024 expressed genes. The embeddings are used as features for a variety of predictive tasks. This model is ready for both commercial and academic use.
References:#
Geneformer, reference foundation model for single-cell RNA: Transfer learning enables predictions in network biology | Nature
scGPT, alternative foundation model for single-cell RNA: scGPT: toward building a foundation model for single-cell multi-omics using generative AI | Nature Methods
scBERT, alternative foundation model for single-cell RNA: scBERT as a large-scale pretrained deep language model for cell type annotation of single-cell RNA-seq data | Nature Machine Intelligence
scFoundation, alternative foundation model for single-cell RNA: Large Scale Foundation Model on Single-cell Transcriptomics | bioRxiv Cell x Gene census, public repository for sc-RNA experiments: CZ CELLxGENE Discover - Cellular Visualization Tool (cziscience.com)
Model Architecture:#
Architecture Type: Bidirectional Encoder Representations from Transformers (BERT)
Network Architecture: Geneformer
Input:#
Input Type(s): Number (Row represents cell, containing gene names and single cell expression counts)
Input Format(s): Array AnnData
Input Parameters: 1D
Output:#
Output Type(s): Vector (Dense Embedding Predictions)embeddings.
Output Format: NumPy
Output Parameters: 1D
Other Properties Related to Output: Numeric floating point vector (fp16, bf16, or fp32); geneformer-10M-240530 outputs 256 dimensional embeddings; geneformer-106M-240530 outputs 768 dimensional embeddings
Software Integration:#
Runtime Engine(s):
BioNeMo, NeMo 1.2
Supported Hardware Microarchitecture Compatibility:
Ampere
Hopper
Volta
[Preferred/Supported] Operating System(s):
Linux
Model Version(s):#
geneformer-10M-240530
10.3M parameter geneformer variant.
25429 ensemble ID based gene tokens
256 hidden dimensions with 4 heads, 6 layers and an 512 dimensional FFN
relu activation
1e-12 EPS layernorm
bf16 mixed precision training with 32 bit residual connections
2% hidden dropout, 10% attention dropout
geneformer-106M-240530
106M parameter geneformer variant.
25429 ensemble ID based gene tokens
768 hidden dimensions with 12 heads, 12 layers and an 3072 dimensional FFN
relu activation
1e-12 EPS layernorm
bf16 mixed precision training with 32 bit residual connections
2% hidden dropout, 10% attention dropout
Training & Evaluation:#
Training Dataset:#
Single cell expression counts from CELLxGENE Census used for the direct download of data matching similar criteria to those described in the geneformer publication. limiting cell data to organism=”Homo sapiens”, with a non “na” suspension_type, is_primary_data=True, and disease=”normal” to limit to non-diseased tissues that are also the primary data source per cell to make sure that cells are only included once in the download. We tracked metadata including “assay”, “sex”, “development_stage”, “tissue_general”, “dataset_id” and “self_reported_ethnicity”. The metadata “assay”, “tissue_general”, and “dataset_id” were used to construct dataset splits into train, validation, and test sets.
The training set represented 99% of the downloaded cells. We partitioned the data by dataset_id into a train set (99%) and a hold-out set (1%), to make sure that the hold-out datasets were independently collected single cell experiments, which helps evaluate generalizability to new future datasets.
In this training split, we made sure that all “assay” and “tissue_general” labels were present in the training set so that our model would have maximal visibility into different tissues and assay biases.
The 1% hold-out evaluation set was split further into a validation and test set. This final split was mostly done randomly by cell; however, we set aside a full dataset into the test split so that we could evaluate performance after training on a completely unseen dataset, including when monitoring the validation loss during training.
Link: Datasets downloaded from CZ CELLxGENE Discover - Cellular Visualization Tool (cziscience.com)
** Data Collection Method by dataset
[Human]
** Labeling Method by dataset
Hybrid: Automated, Human
Properties (Quantity, Dataset Descriptions, Sensor(s)):
23.64 million non-diseased and human-derived single cells were chosen from the CZI CELLxGENE census, which is characterized as follows:
Assay Bias:
The vast majority of the dataset is one of the 10x genomics assays, Approximately 20M of 26M cells are genomic assays, 4M are sci-RNA-seq, while Remaining assays (microwell-seq, drop-seq, bd rhapsody, smart-seq, seq-well, and MARS-seq) represent small fractions of the full datasets.
Sex:
12.5M are male-derived cells; 10M are female derived cells. The remaining cells are not annotated.
Self-Reported Ethnicity:
Approximately 12M cells are not annotated; 9M are annotated as “European.” .5M are annotated as “Han Chinese.” followed by “African American”.
Age Bias:
The dataset is heavily biased toward donors less than one year. The next highest group would be the segment that includes ages 21-30.
Tissue Type Bias:
9M cells are “brain” derived. 4M are blood derived, followed by “lung”, “breast”, “heart” and “eye” at approximately 1M cells each.
Dataset was derived from a limited number of public sources where methods and protocols may not represent sufficiently diverse sources to capture the full scope of gene expression.
Evaluation Dataset:#
Adamson et al 2016 PERTURB-seq dataset, accessed by Harvard dataverse.
Link: adamson.zip - Harvard Dataverse
** Data Collection Method by dataset
Human
** Labeling Method by dataset
Automated - Molecular Barcoding
Properties (Quantity, Dataset Descriptions, Sensor(s)): There are ~20k single cells, half of which represent unperturbed control samples, and the other half which contain an additional datatable containing the CRISPR knock-out targets for each cell.
Link: CZ CELLxGENE Discover - Cellular Visualization Tool (cziscience.com)
** Data Collection Method by dataset
Human
** Labeling Method by dataset
Hybrid: Automated, Human
Properties (Quantity, Dataset Descriptions, Sensor(s)):
240,000 single cells were chosen from the CZI cell x gene census such that they did not share a
dataset_idwith any cell in the training data described previously.
Inference:#
Engine: BioNeMo, NeMo
Test Hardware:
Ampere
Hopper
Volta
*Additional description content may be included here
Ethical Considerations:#
NVIDIA believes Trustworthy AI is a shared responsibility and we have established policies and practices to enable development for a wide array of AI applications. When downloaded or used in accordance with our terms of service, developers should work with their internal team to ensure this model meets requirements for the relevant industry and use case and addresses unforeseen product misuse. For more detailed information on ethical considerations for this model, please see the Model Card++ Explainability, Bias, Safety & Security, and Privacy Subcards [Insert Link to Model Card++ here]. Please report security vulnerabilities or NVIDIA AI Concerns here.
Training diagnostics#
geneformer-10M-240530#
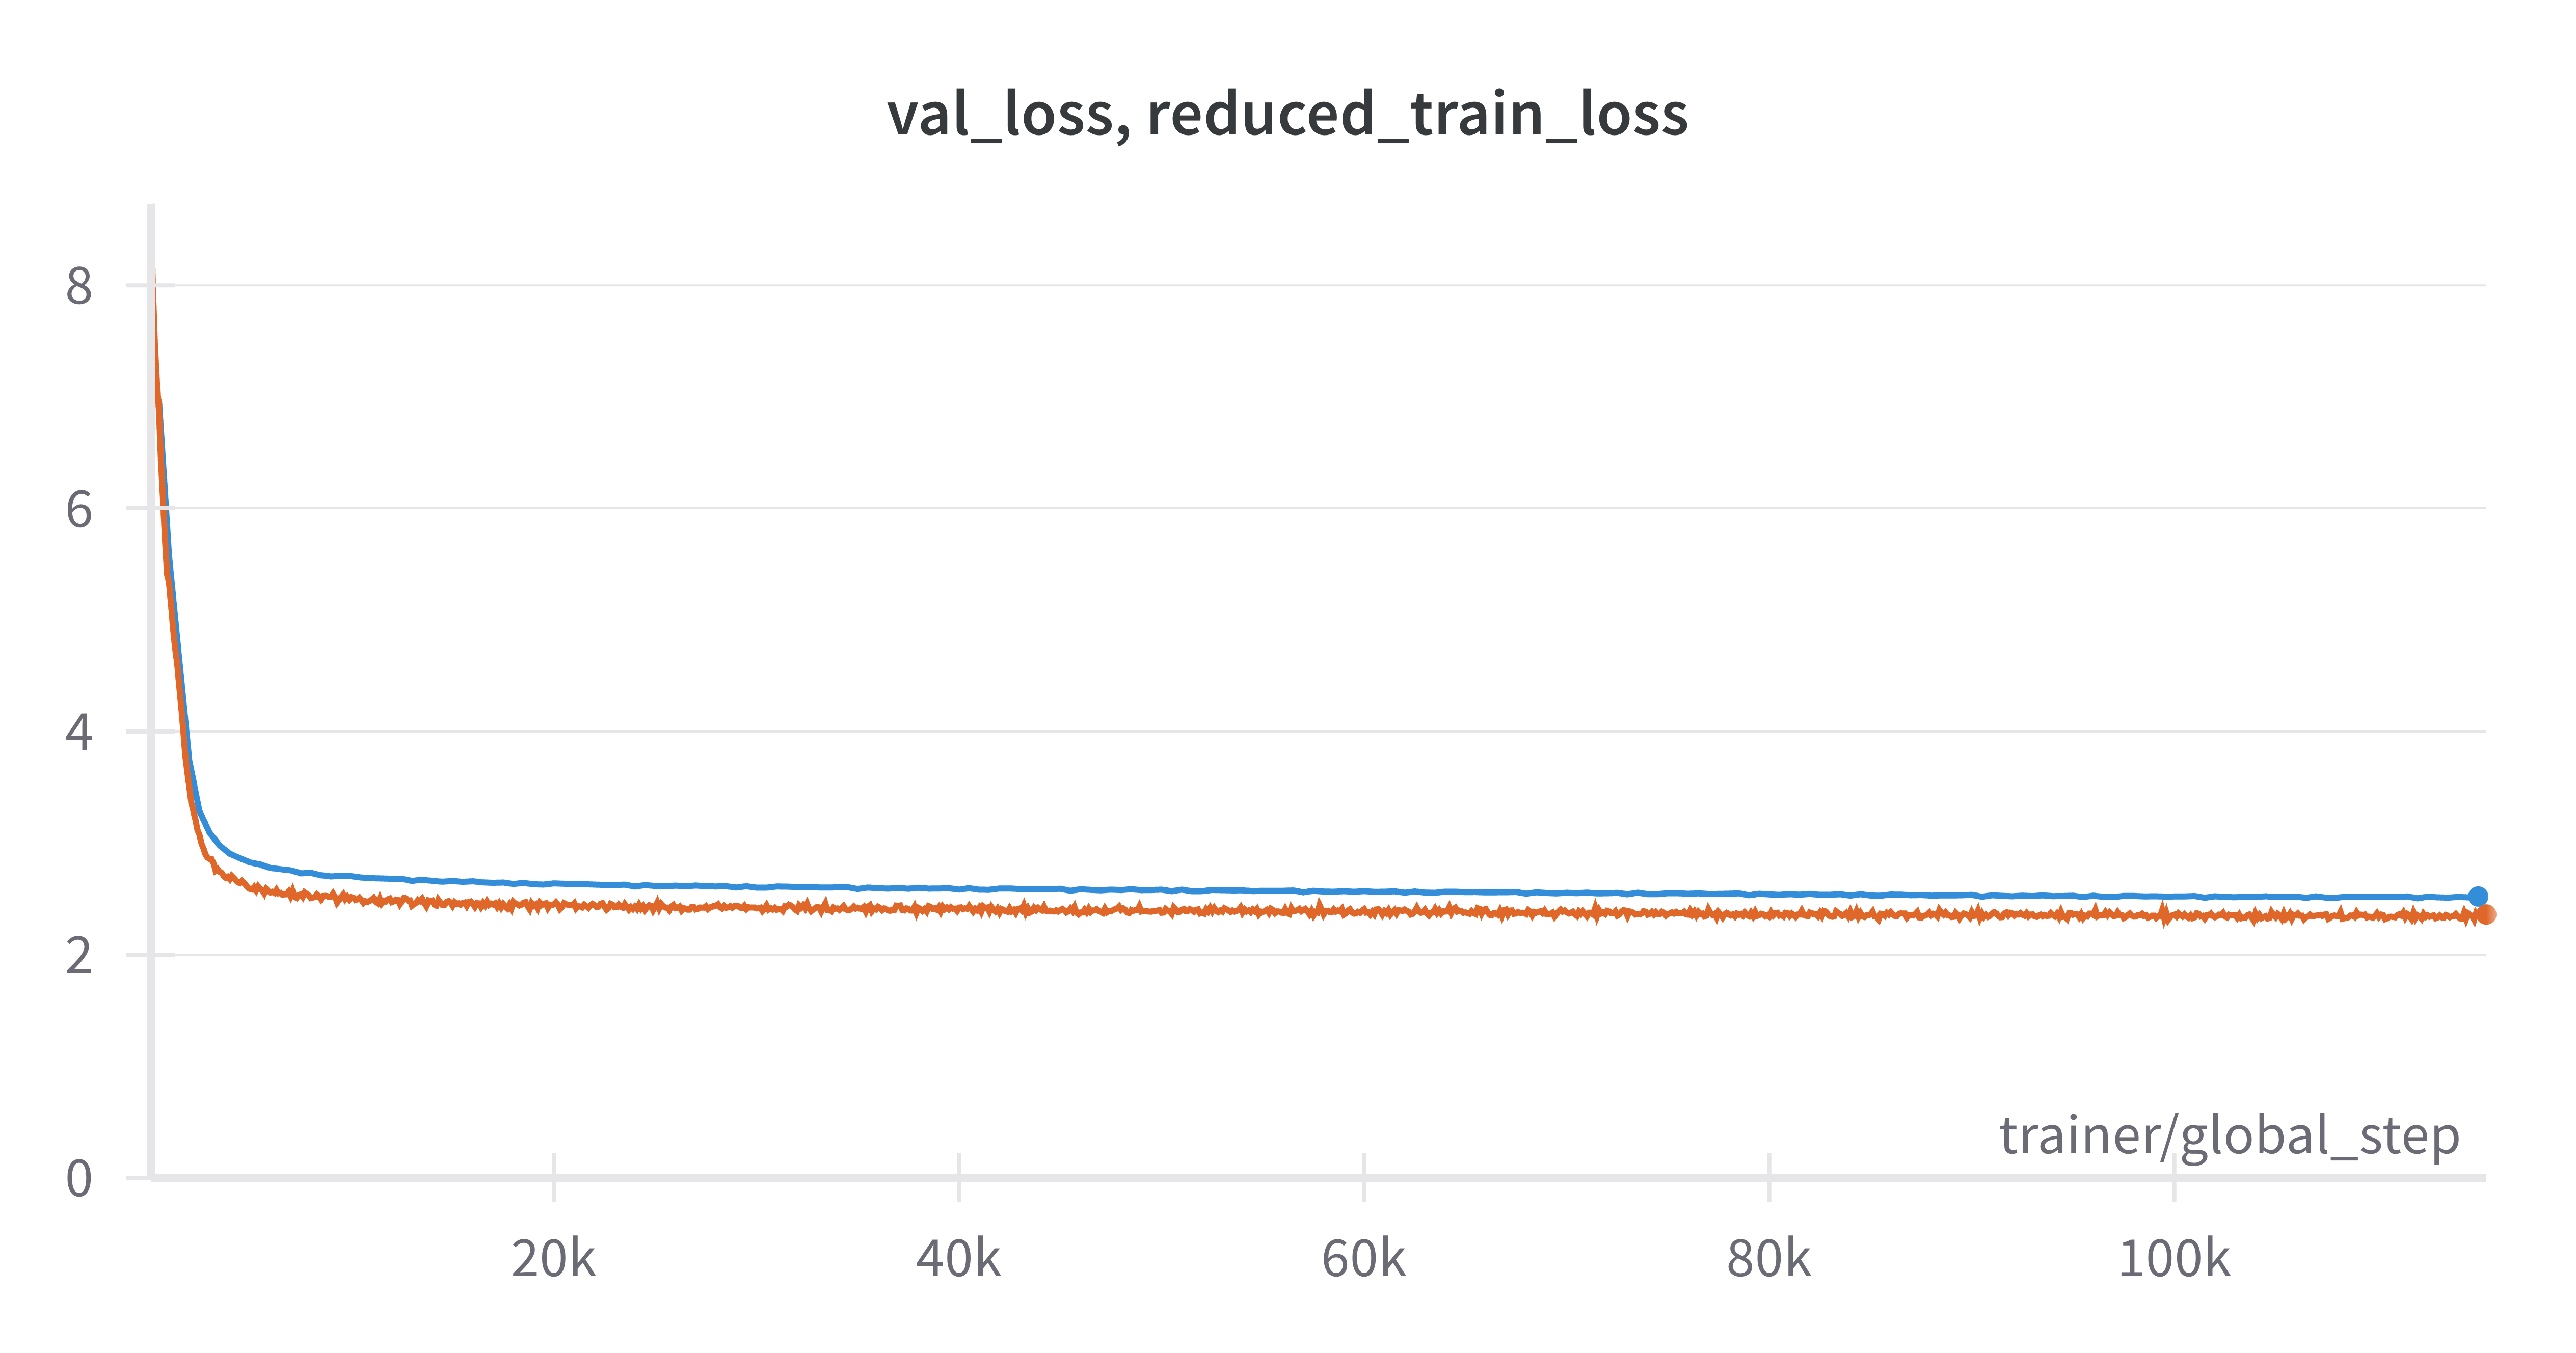
This checkpoint was trained for approximately 11 epochs through the CELLxGENE split. Training was performed on 8 servers with 8 A100 GPUs each for a total of 115430 steps of per-gpu micro batch size 32 and global batch size of 2048. Training took a total of 1 day, 20 hours and 19 minutes of wallclock time. As can be seen in the following image, training and validation curves both decreased fairly smoothly throughout the course of training. In fact validation (blue) and training (orange) loss were both still decreasing at the end of 11 epochs through the dataset. The model could likely be trained for more epochs without overfitting.
geneformer-106M-240530#
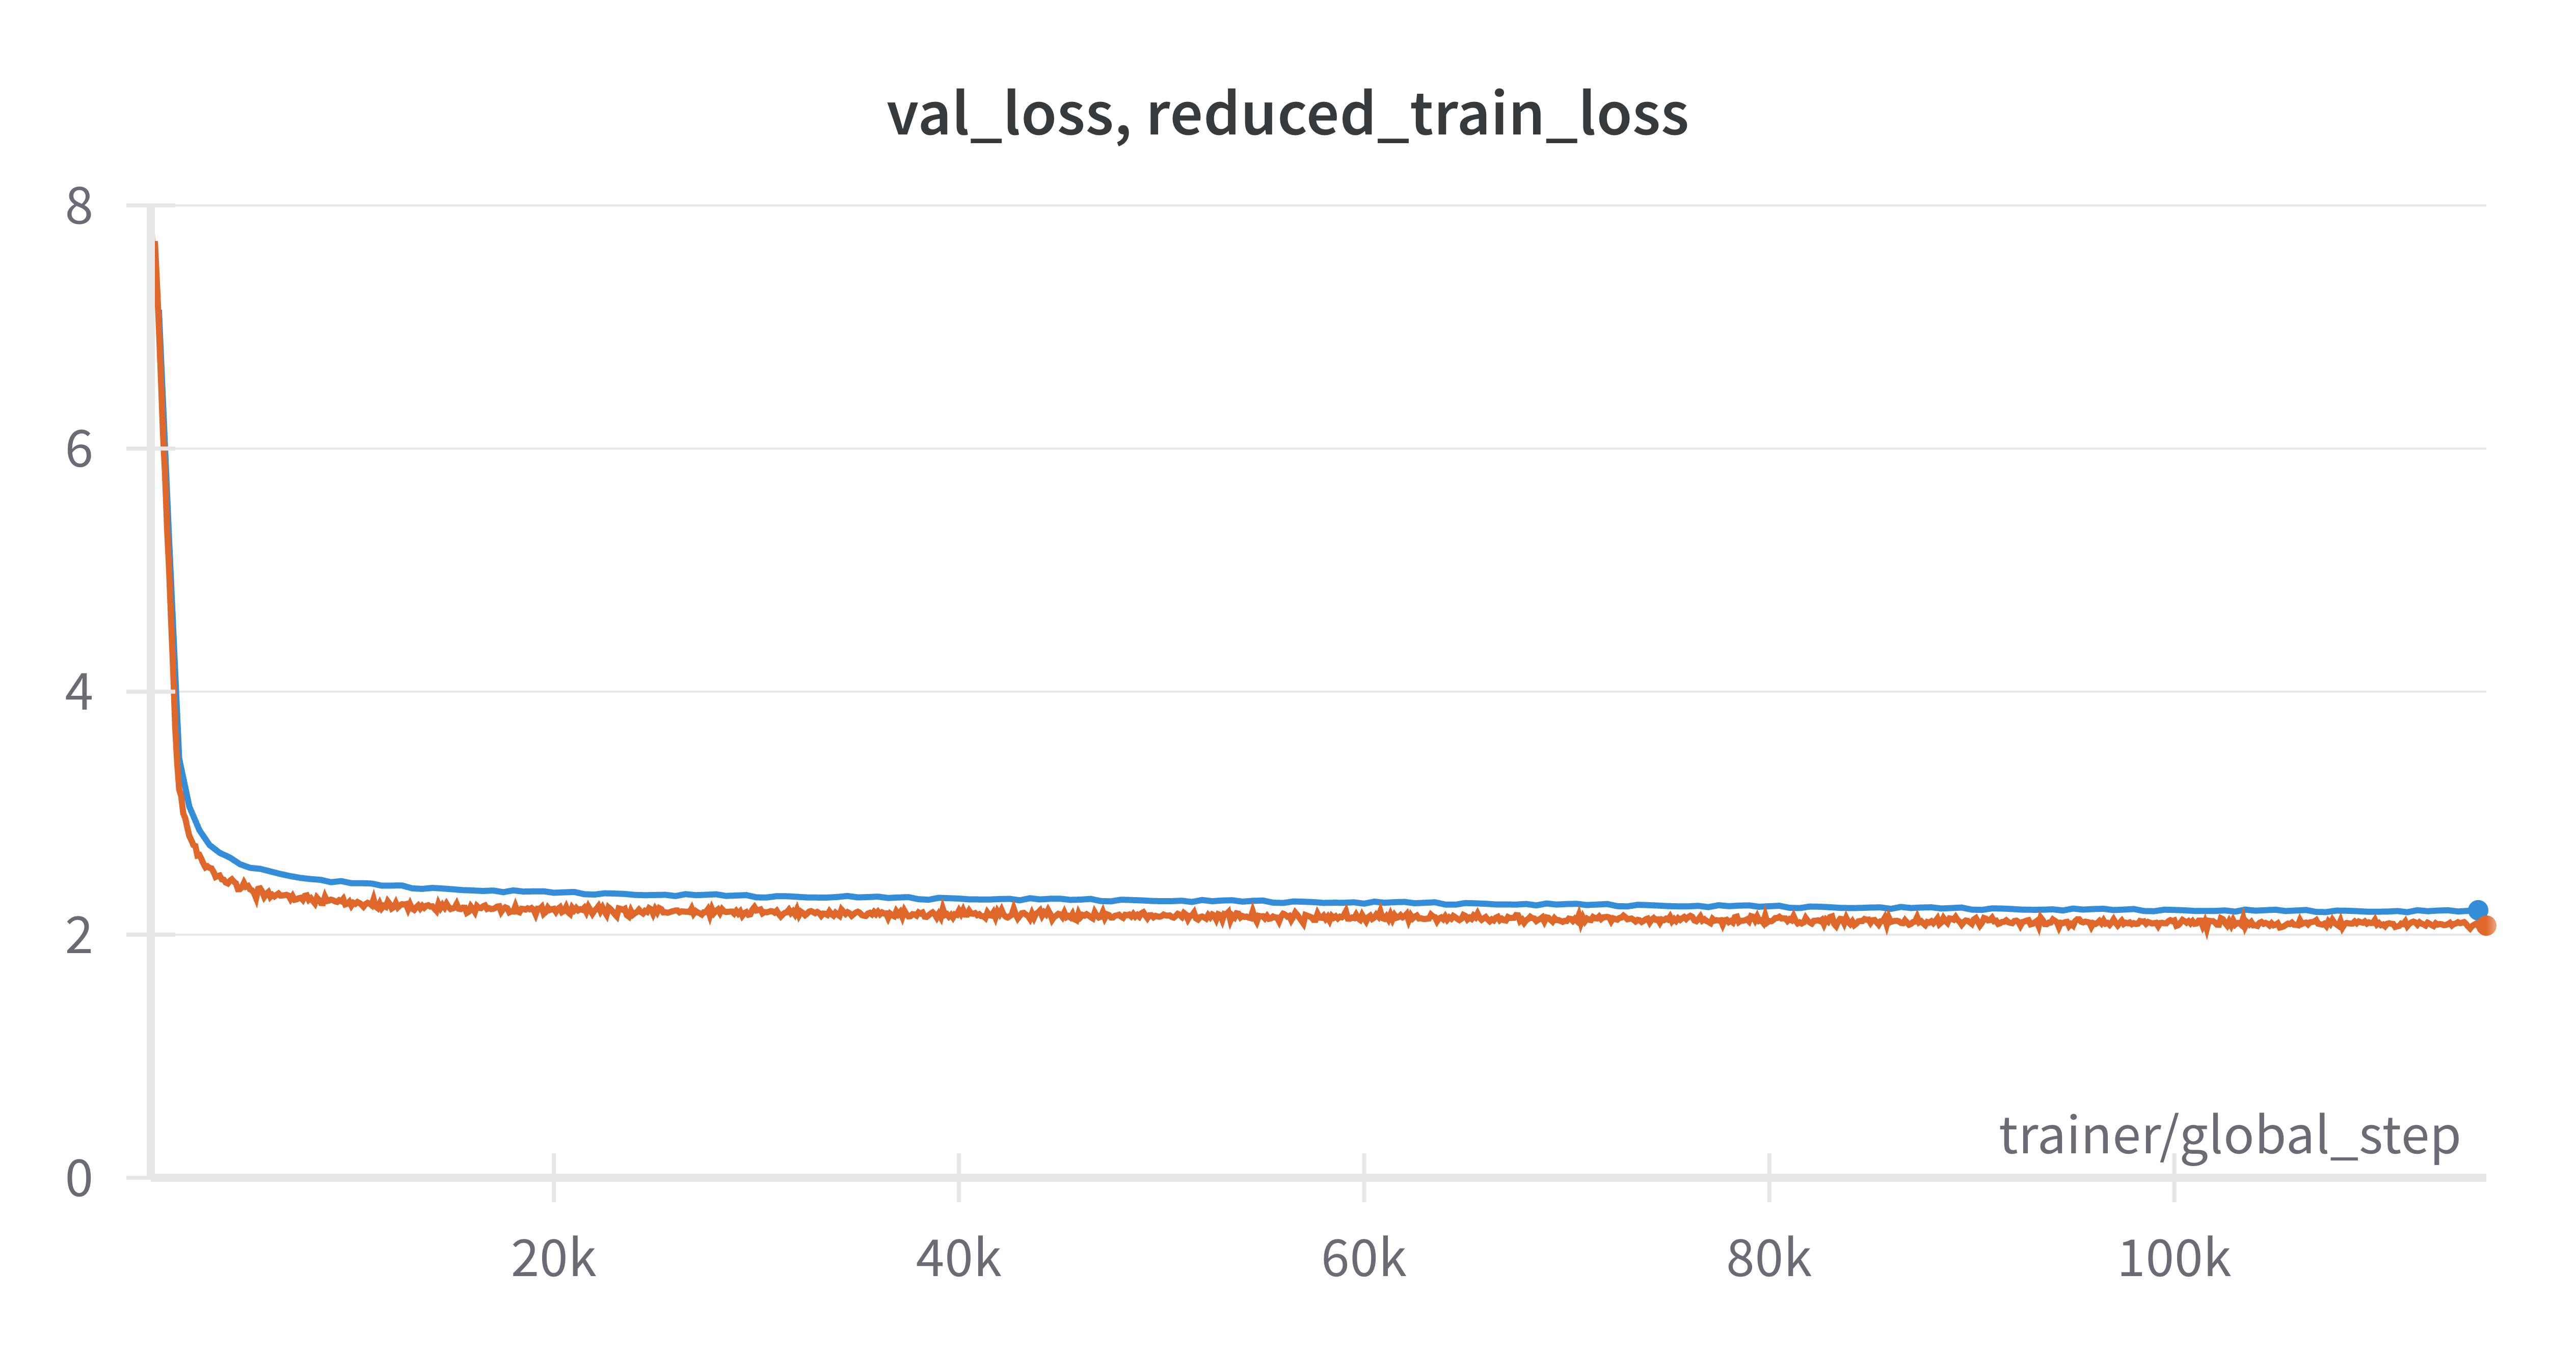
This checkpoint was trained for approximately 11 epochs through the CELLxGENE split. Training was performed on 16 servers with 8 A100 GPUs each for a total of 115430 steps of per-gpu micro batch size 16 and global batch size of 2048. Training took a total of 3 days, 18 hours and 55 minutes of wallclock time. As can be seen in the following image, training and validation curves both decreased fairly smoothly throughout the course of training. In fact validation (blue) and training (orange) loss were both still decreasing at the end of 11 epochs through the dataset. The model could likely be trained for more epochs without overfitting.
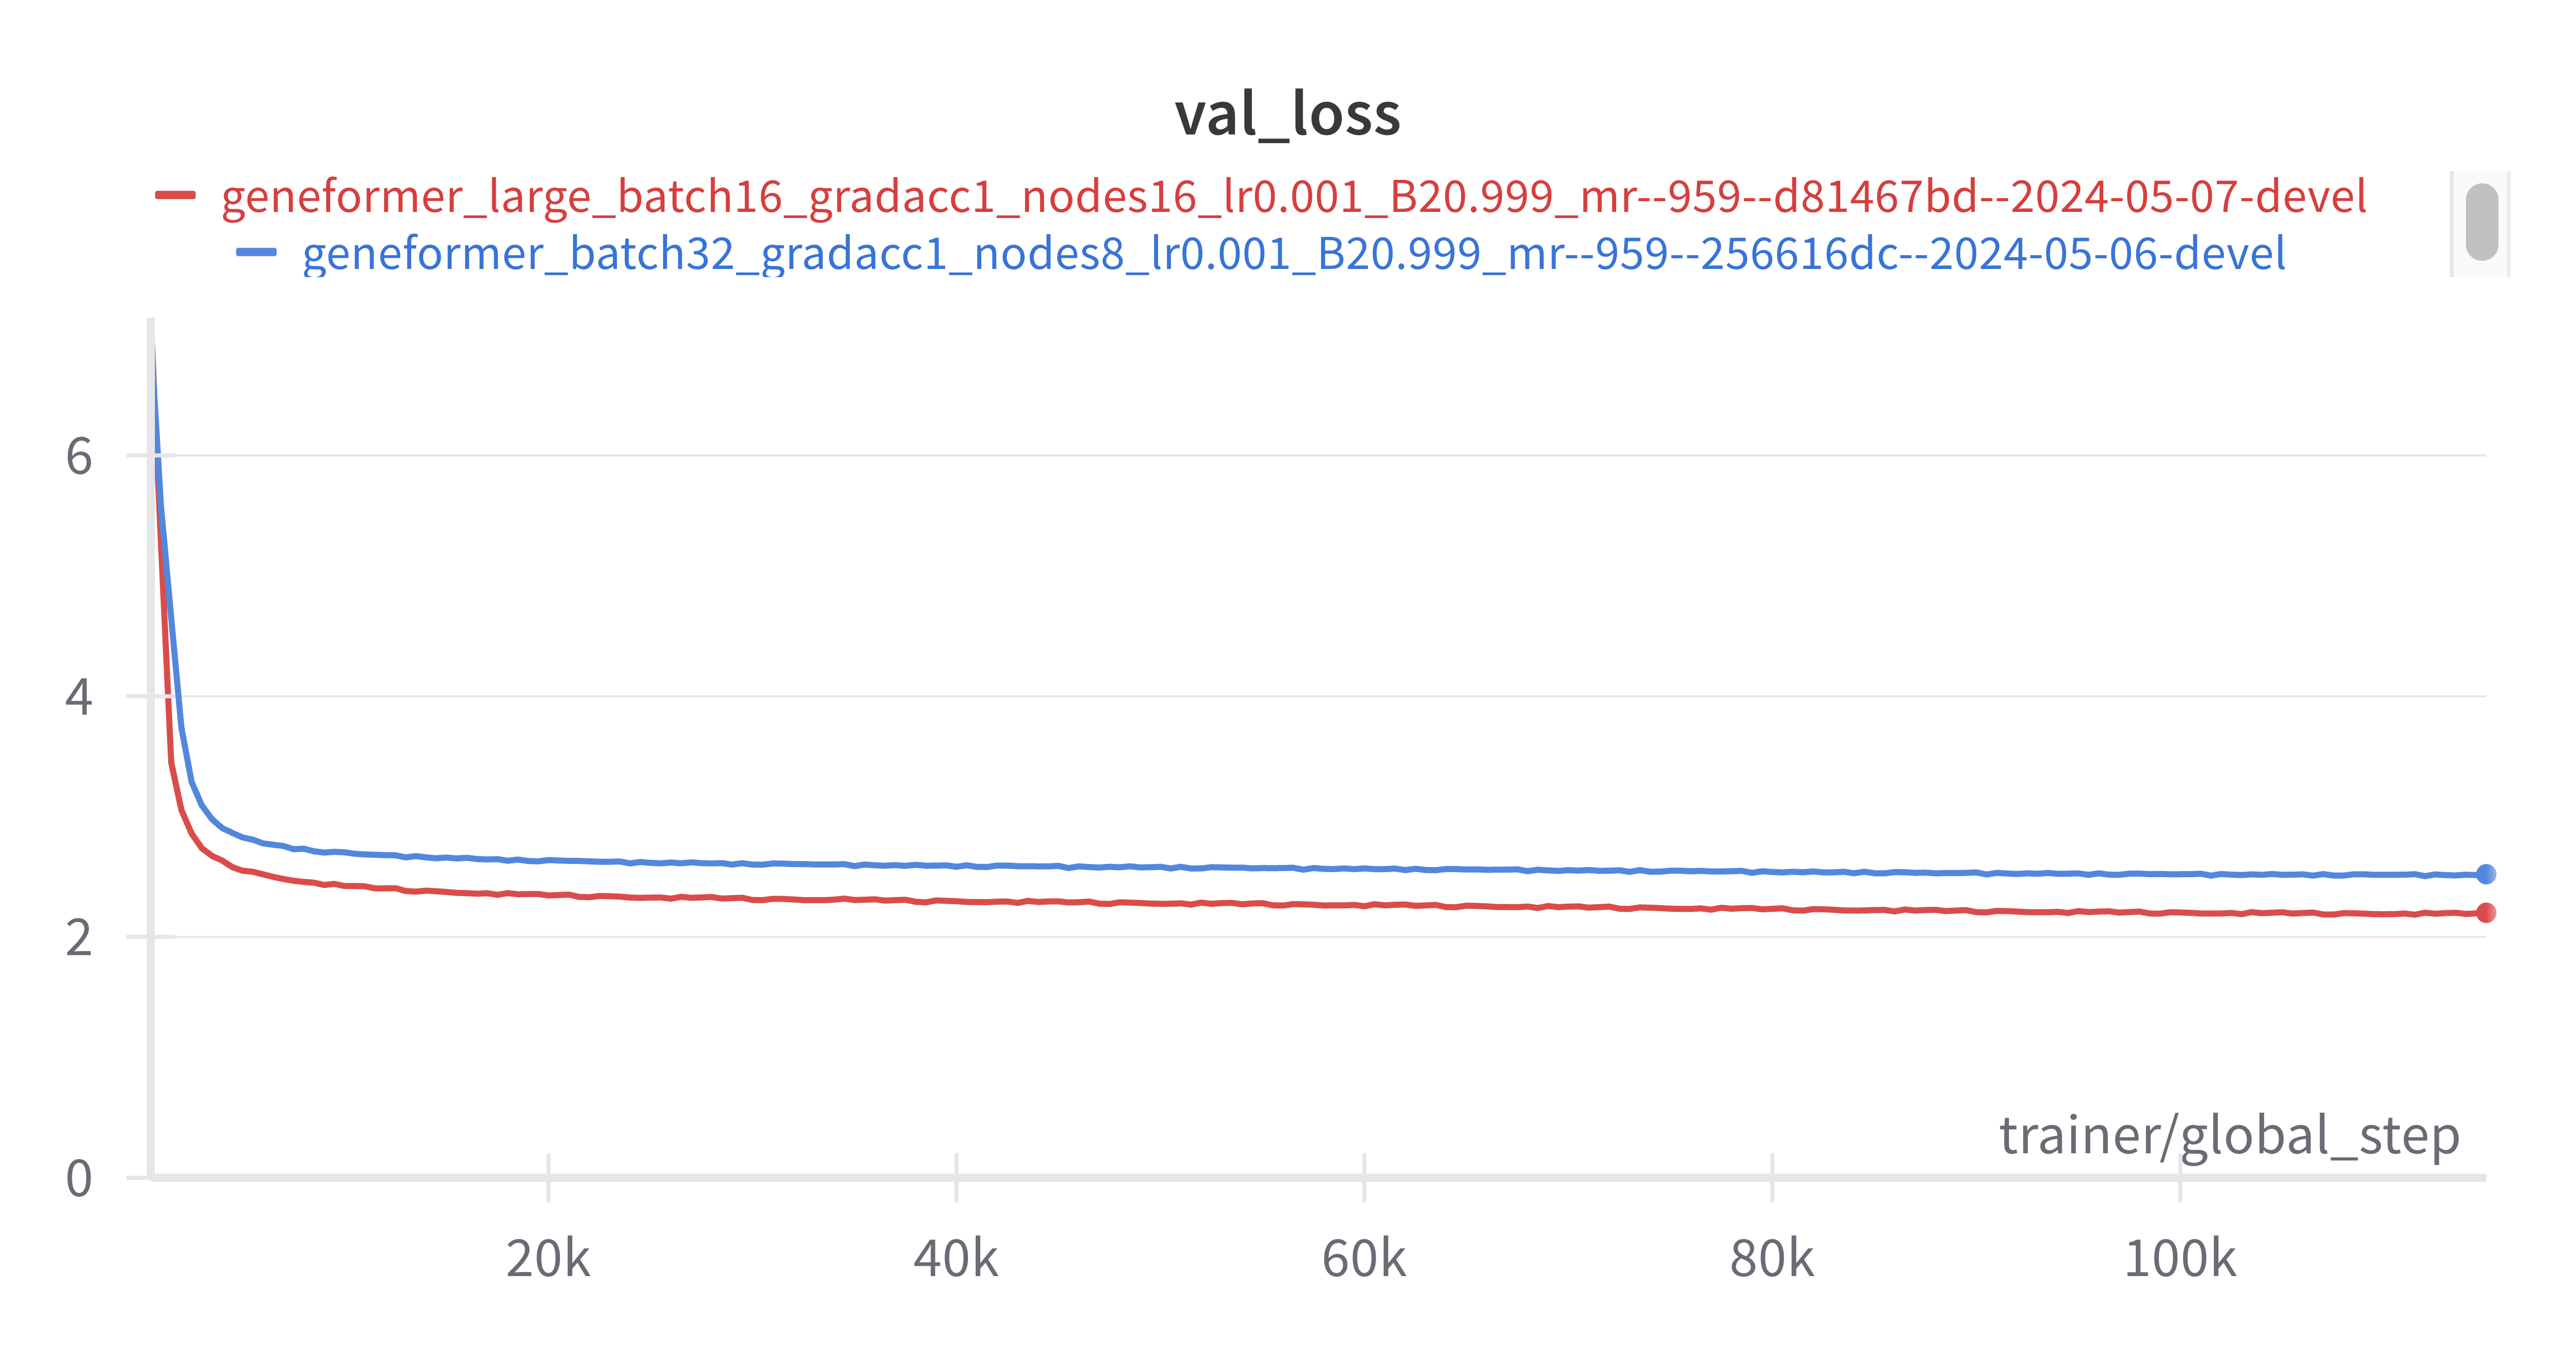
Additionally, validation loss decreased both faster and continued to decrease at the same improved rate throughout training in the 106M parameter model (red) as compared to the 10M parameter model (blue). It would be interesting to test even larger models to see if we continue to observe improved performance in larger models.
Benchmarking#
Accuracy Benchmarks#
Masked language model (MLM) loss#
The following describes the bert MLM token loss. Like in the original BERT paper, and the geneformer paper, 15% of all tokens are included in the loss. Of the included tokens, 80% are "[MASK]" token, 2% are a random gene token, and 18% are the correct output token. Note that this was an unintentional deviation from the original publication, but so far it seems to be working well. In the future we will test the intended 80%/10%/10% mixture proposed in the paper. The token loss in the following table is the mean cross entropy loss of the 15% of tokens included in the loss mask averaged across cells. As a baseline geneformer was downloaded from the ctheodoris/Geneformer page on hugging face on 2024/05/13 and applied to the same masking/unmasking problem on this dataset. The held-out test datset from our training splits described previously was used, and it should be noted that some of these cells may have been involved in training the baseline geneformer. Since the baseline performed slightly worse than our new checkpoints, and our goal was an equivalent or better model checkpoint, this possibility was not explored further.
Model Description |
Token Loss (lower is better) |
|---|---|
Baseline geneformer |
3.35 |
geneformer-10M-240530 |
2.79 |
geneformer-106M-240530 |
2.50 |
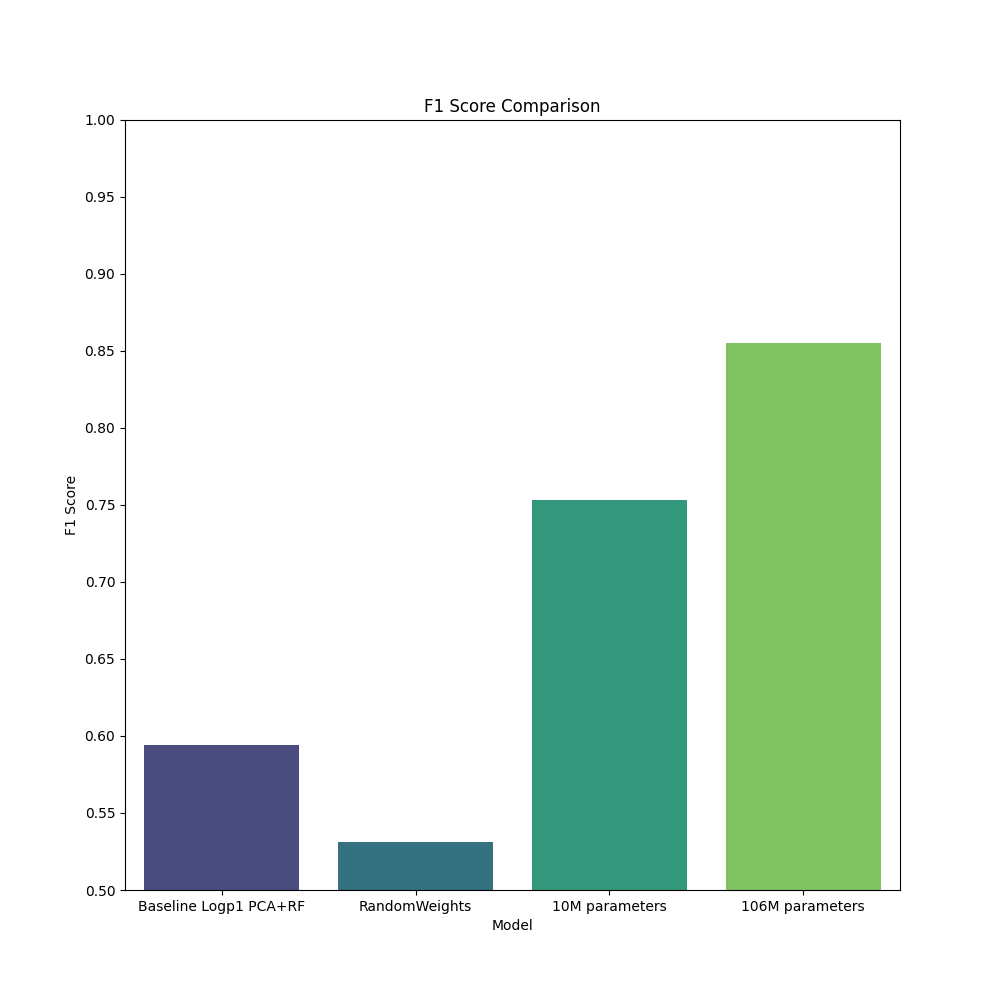
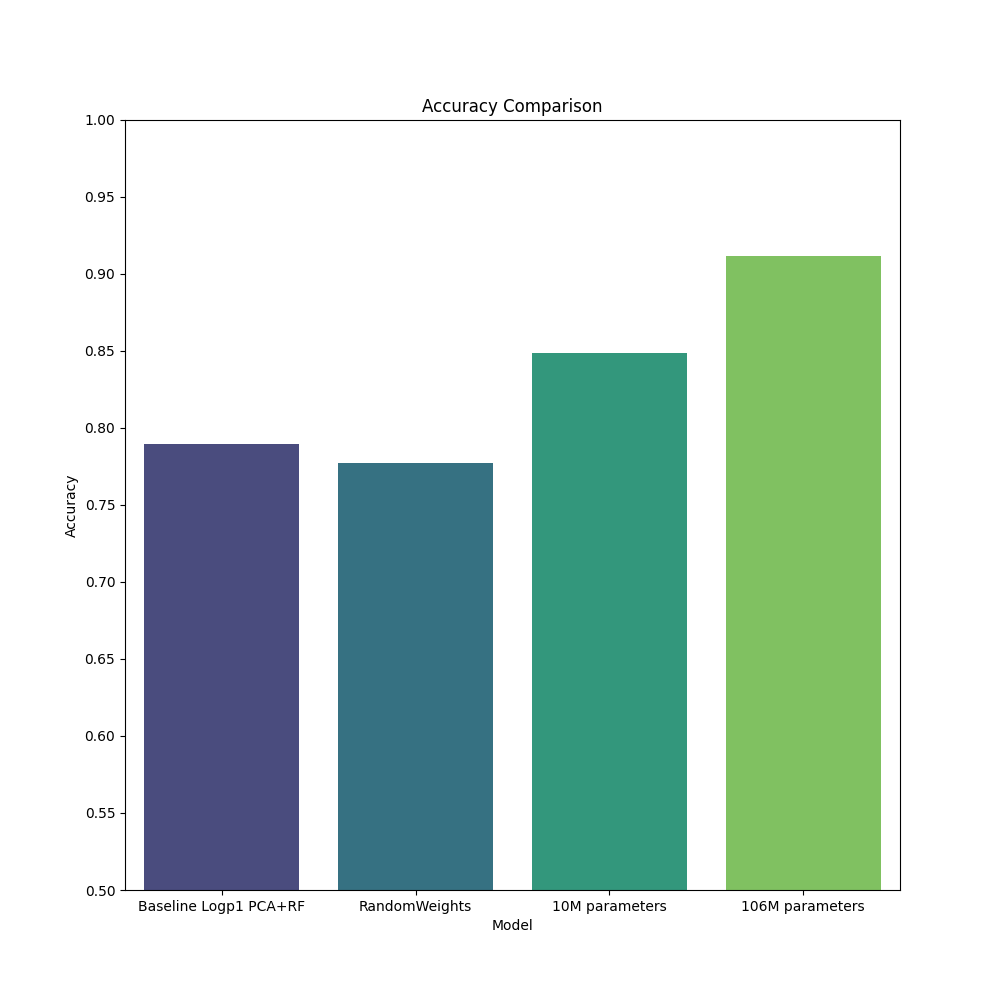
Downstream task accuracy#
Here we benchmark four models, with two baselines. These models are tasked with cell type classification, using the Chron’s disease small intestine dataset from Elmentaite et al. (2020), Developmental Cell. This dataset contains approximately 22,500 single cells from both healthy children aged 4-13 and chidlren with Chron’s disease. This dataset contains 31 unique cell types which we assume to be annotated accurately. This dataset was held out of our pre-training dataset as all diseased samples were removed.
Baseline 1) scRNA workflow: this model uses PCA with 10 components and random forest on normalized and log transformed expression counts to produce a result.
Baseline 2) geneformer-qa, a model trained for approximately 100 steps with approximately random weights. We expect this model to perform no differently than working on counts directly.
geneformer-10M-240530 and geneformer-106M-240530 as described above.
For more details see the example notebook titled Geneformer-celltype-classification-example.ipynb
Performance Benchmarks#
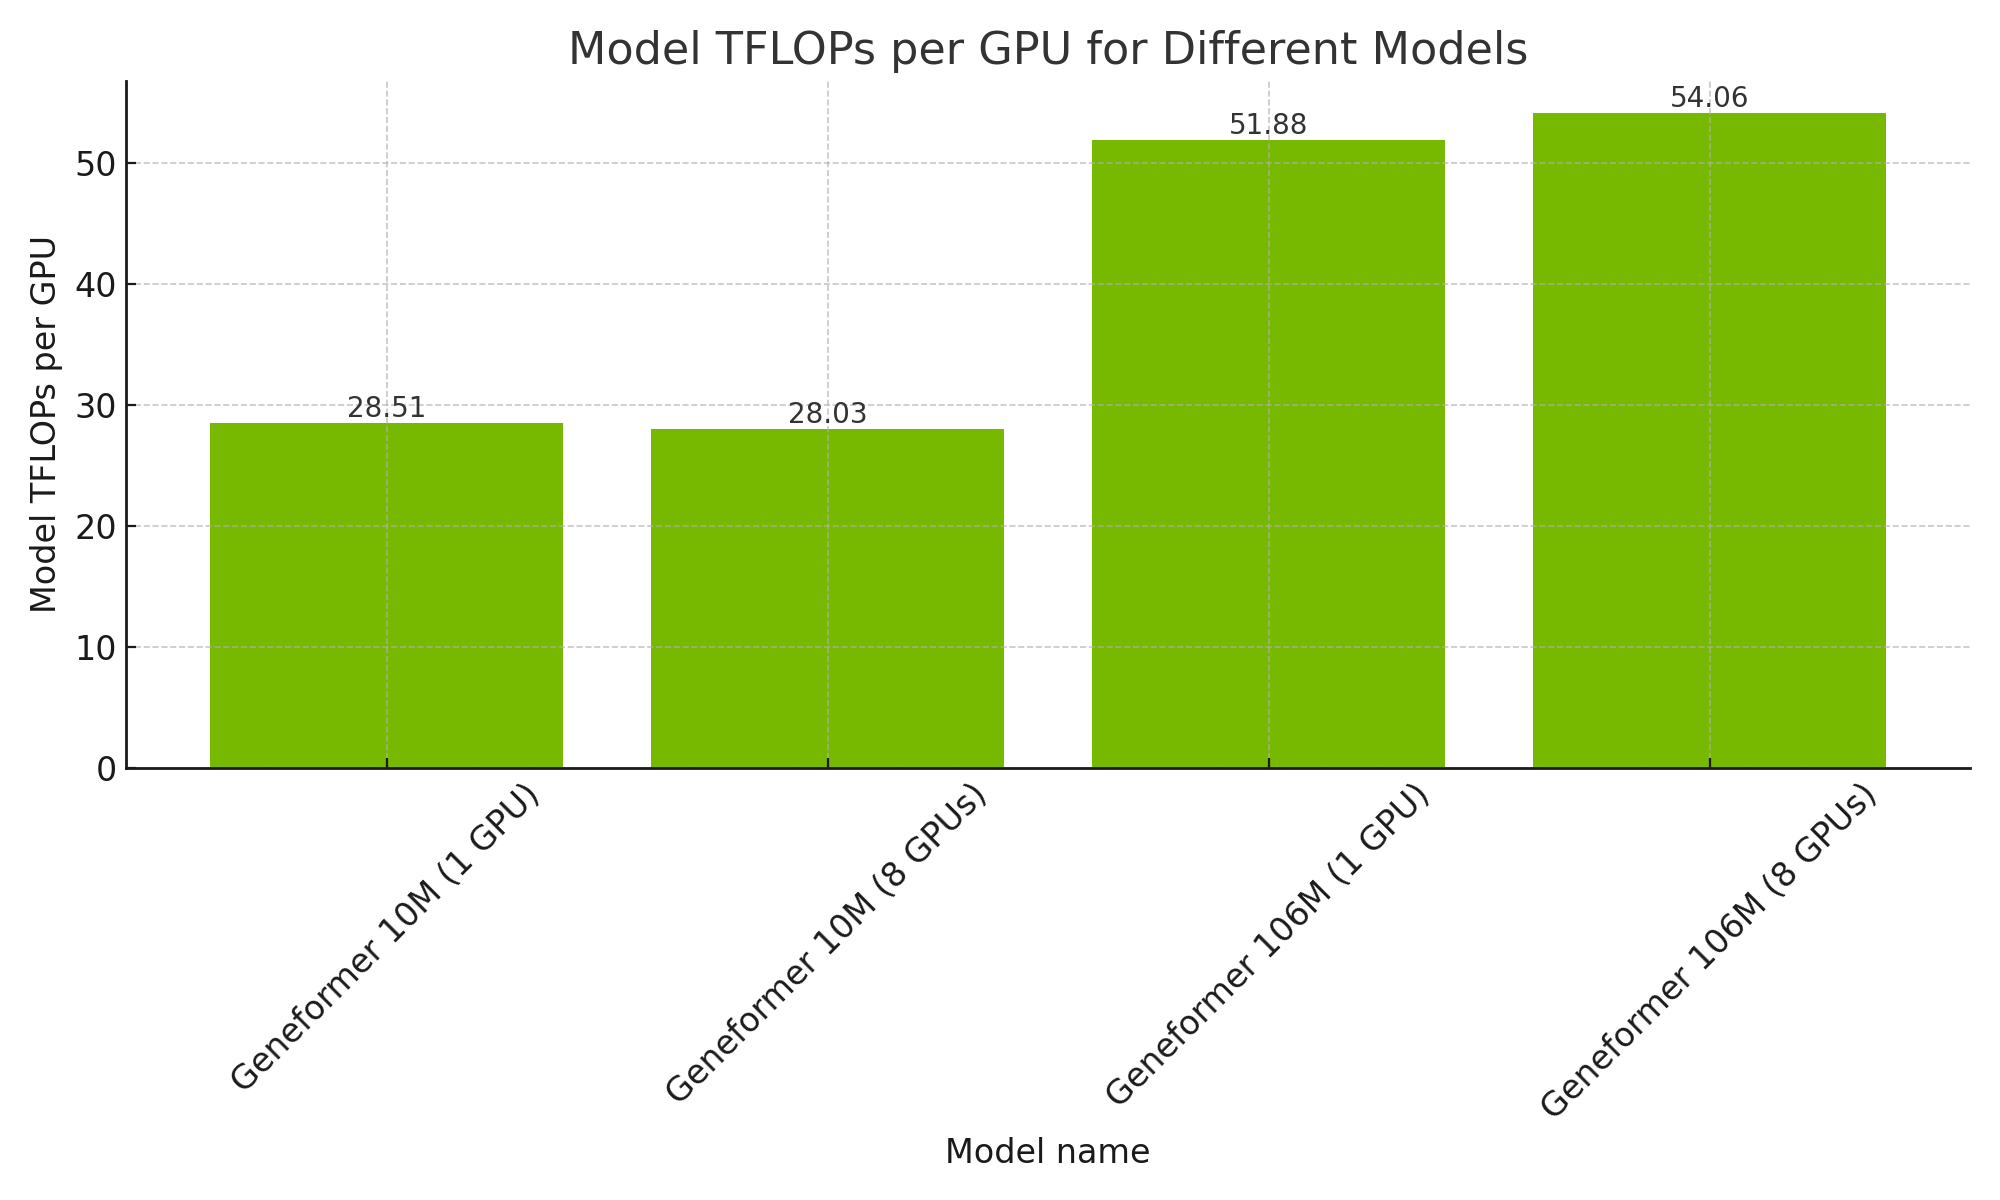
The 106M parameter variant of Geneformer achieves over 50 TFLOPS per GPU during training. This is consistent whether trained with 1 or 8 A100s.