


Debug Viewer#
The debug viewer is a browser tool for root-cause analysis. It pairs a clip’s review MP4 with the Safety Core state, ground-truth positions, behavior- analytics events, and the Safety Core log — all synchronized on one 30 Hz timeline. Scrub the video and every panel jumps to the matching moment.
Use it when a graded score alone can’t explain a failure — see Interpreting the Report for the numbers, this page for the visual drill-down.
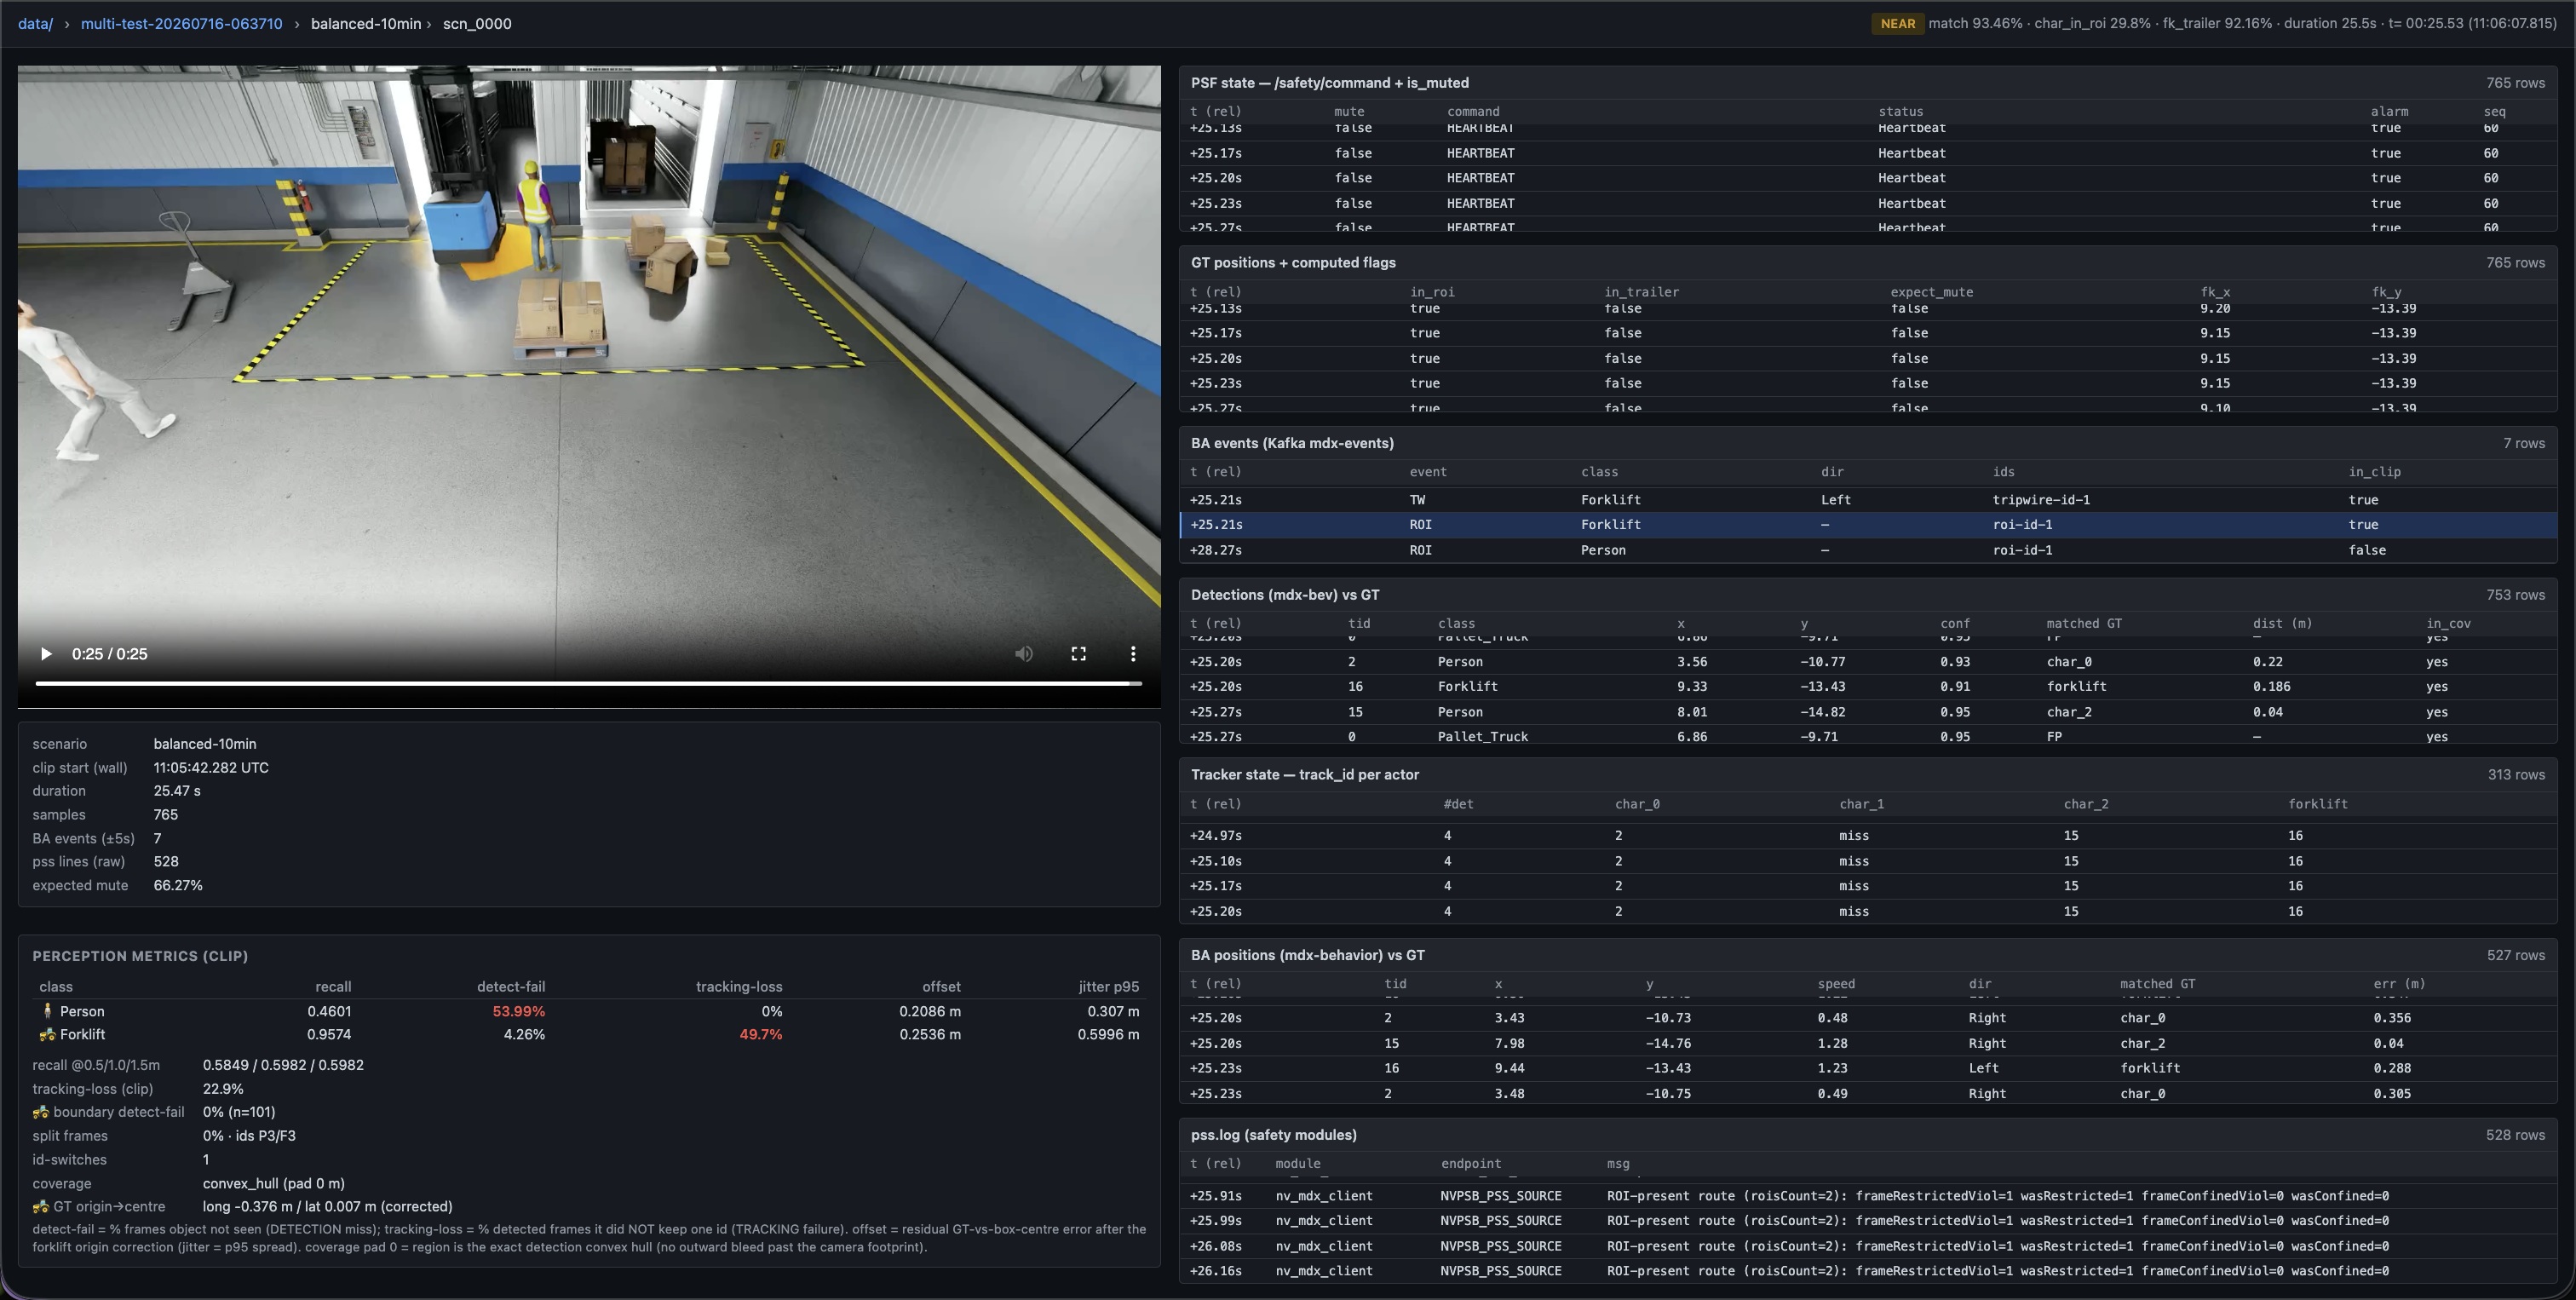
The debug page: the review video alongside scrub-synced Safety Core state, ground truth, behavior-analytics events, and detection / tracking panels — all on one timeline. A 3D run is shown; a 2D run keeps the four Phase-1 panels without the three perception panels.#
When to use it#
A clip is FAIL and you need to see what the cameras saw at the mismatch.
A clip has a long reaction lag and you want to watch the state change.
You want to confirm whether a mismatch was a perception problem (nothing detected) or a decision problem (detected but decided wrong).
Step 1: Generate an evidence bundle#
The viewer reads the per-clip evidence CSVs produced by clip_logs. Package a self-contained bundle (per-clip CSVs + manifest + Safety Core log slice + MP4):
docker exec srr python3 -m srr.clip_logs \
  --runs-dir /app/runs/multi-test-<TIMESTAMP> --calib /app/calibration.json --zip
# -> runs/multi-test-<TIMESTAMP>.zip
You can either use this .zip (unzip it under the viewer’s data/) or point the viewer directly at a run directory.
Step 2: Launch the viewer#
The viewer ships in the repo at tools/srr-debug-viewer and has no build step or dependencies — just Python 3 and a browser.
# make the run visible to the viewer, then launch
ln -sfn <runs>/multi-test-<TIMESTAMP> \
  <repo>/tools/srr-debug-viewer/data/multi-test-<TIMESTAMP>
bash <repo>/tools/srr-debug-viewer/view.sh   # serves http://localhost:8765/
view.sh starts python3 -m http.server on port 8765 and opens the landing page. Stop it with Ctrl+C. To use a different port:
bash <repo>/tools/srr-debug-viewer/view.sh 9000
You can drop multiple runs into data/ — the landing page lists them all.
Step 3: Navigate#
The viewer has three levels — the run list, a run, a single clip — and you drill down by clicking. The walkthrough below follows that path and describes what each page tells you. 2D and 3D runs use the same viewer; where a page differs, both are shown.
Landing page#
One card per run in data/, carrying the headline metrics scraped from that run’s summary.md: total clips, the PASS / NEAR / FAIL pills, Mute correct% and Unmute correct%, BA detection, and the worst lag. It exists so you can pick the run worth opening without opening any of them. Click a card to enter.
Run page — summary#
A run opens on its rendered summary.md, with jump links to Summary and Scenarios & clips in the header and a raw .md link to the underlying file. The Per-clip detail section of the Markdown is deliberately dropped here, because it reappears below as per-scenario tables with verdict pills and clickable rows.
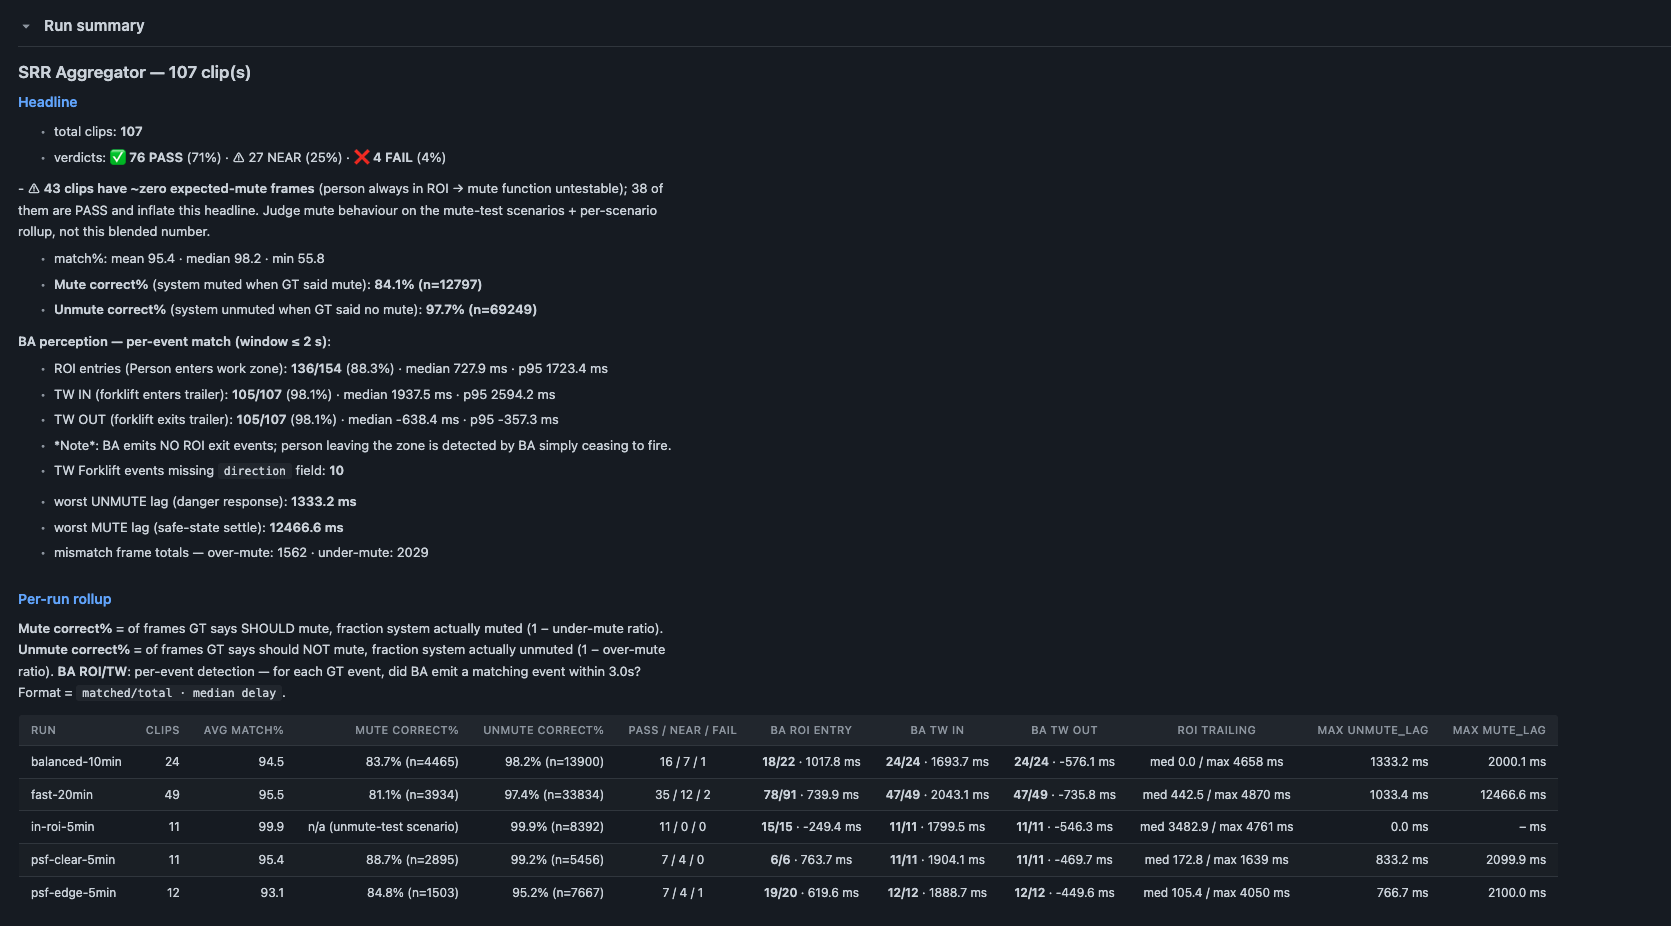
Run summary, 2D run: headline, BA perception, per-run rollup.#
A 3D run keeps those three blocks and adds two more, because 2D has no 3D detector or tracker to grade.
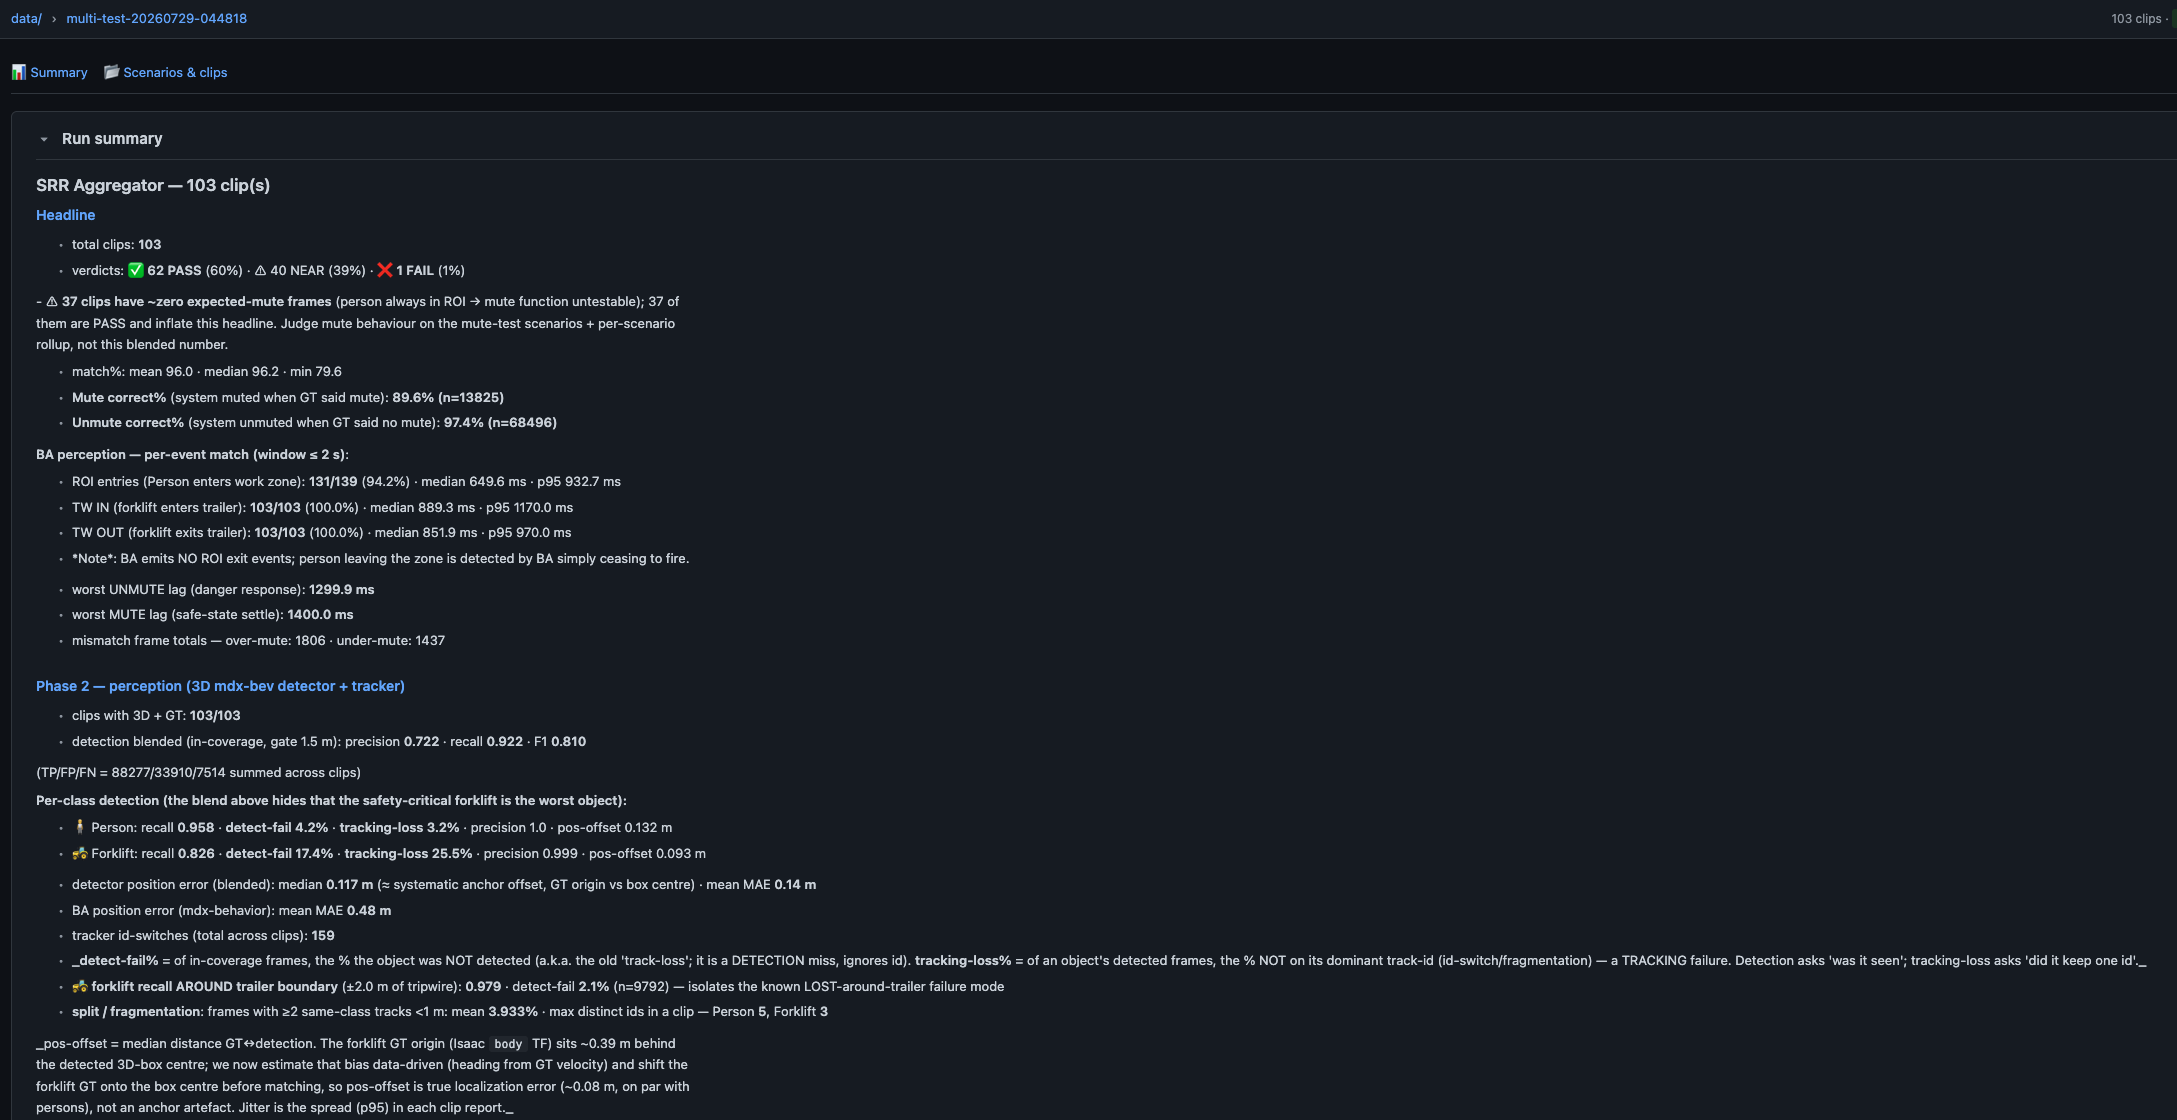
Run summary, 3D run: the same first two blocks, plus Phase 2 — perception.#
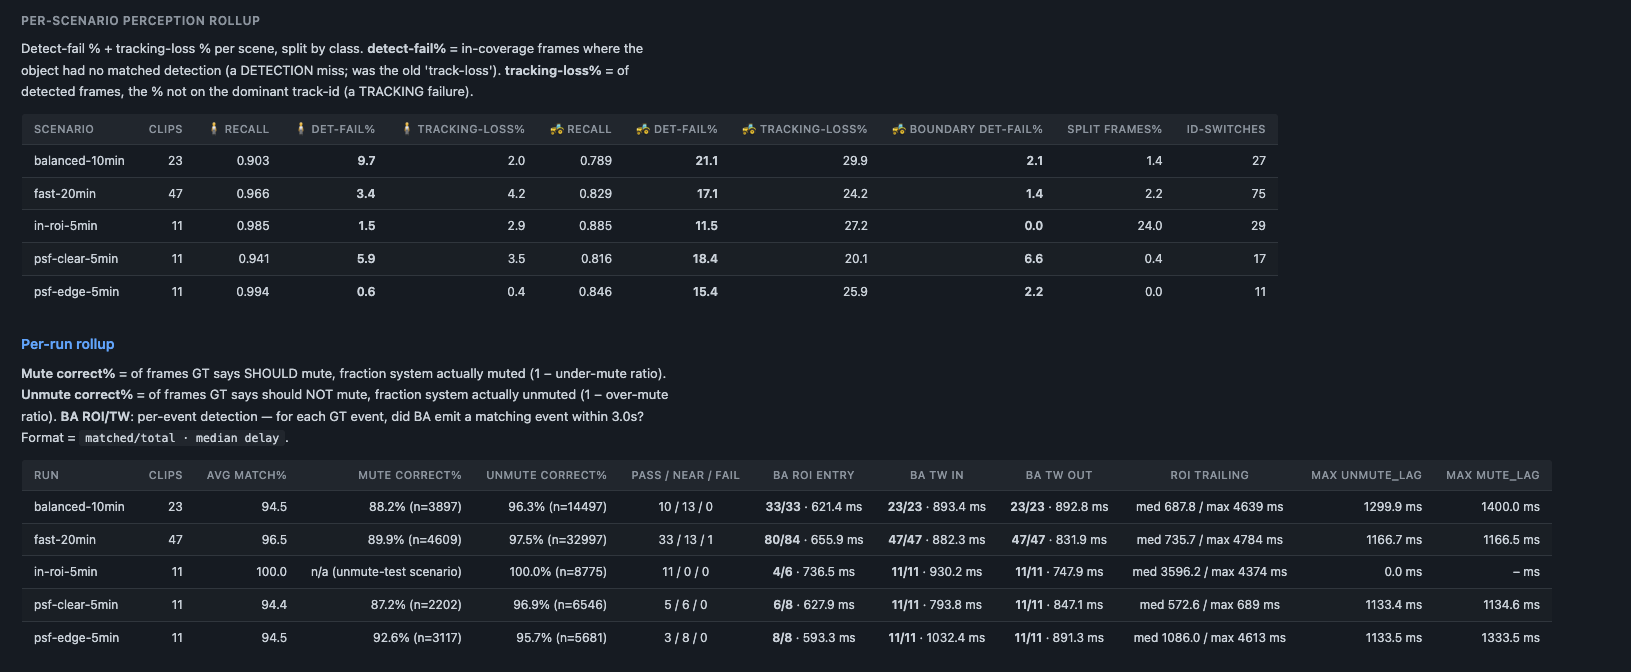
3D run, continued: the per-scenario perception rollup, sitting above the per-run rollup.#
Block |
Tells you |
|---|---|
Headline |
Whether the run passed at all: clip count, the PASS / NEAR / FAIL split,
and the blended |
BA perception |
How the event seam held, rather than the pixels: for each ground-truth event (person enters work zone, forklift enters trailer, forklift exits trailer), how many produced a matching Kafka event inside the match window, with median and p95 delay. Also the worst UNMUTE lag (reaction to danger), the worst MUTE lag (settling back to safe), and the over- / under-mute frame totals. |
Per-run rollup |
The same figures broken out per scenario — clips, average |
Phase 2 — perception (3D runs only) |
How the |
Per-scenario perception rollup (3D runs only) |
Those same |
Run page — scenarios and clips#
Below the summary, one section per scenario lists every clip in it.
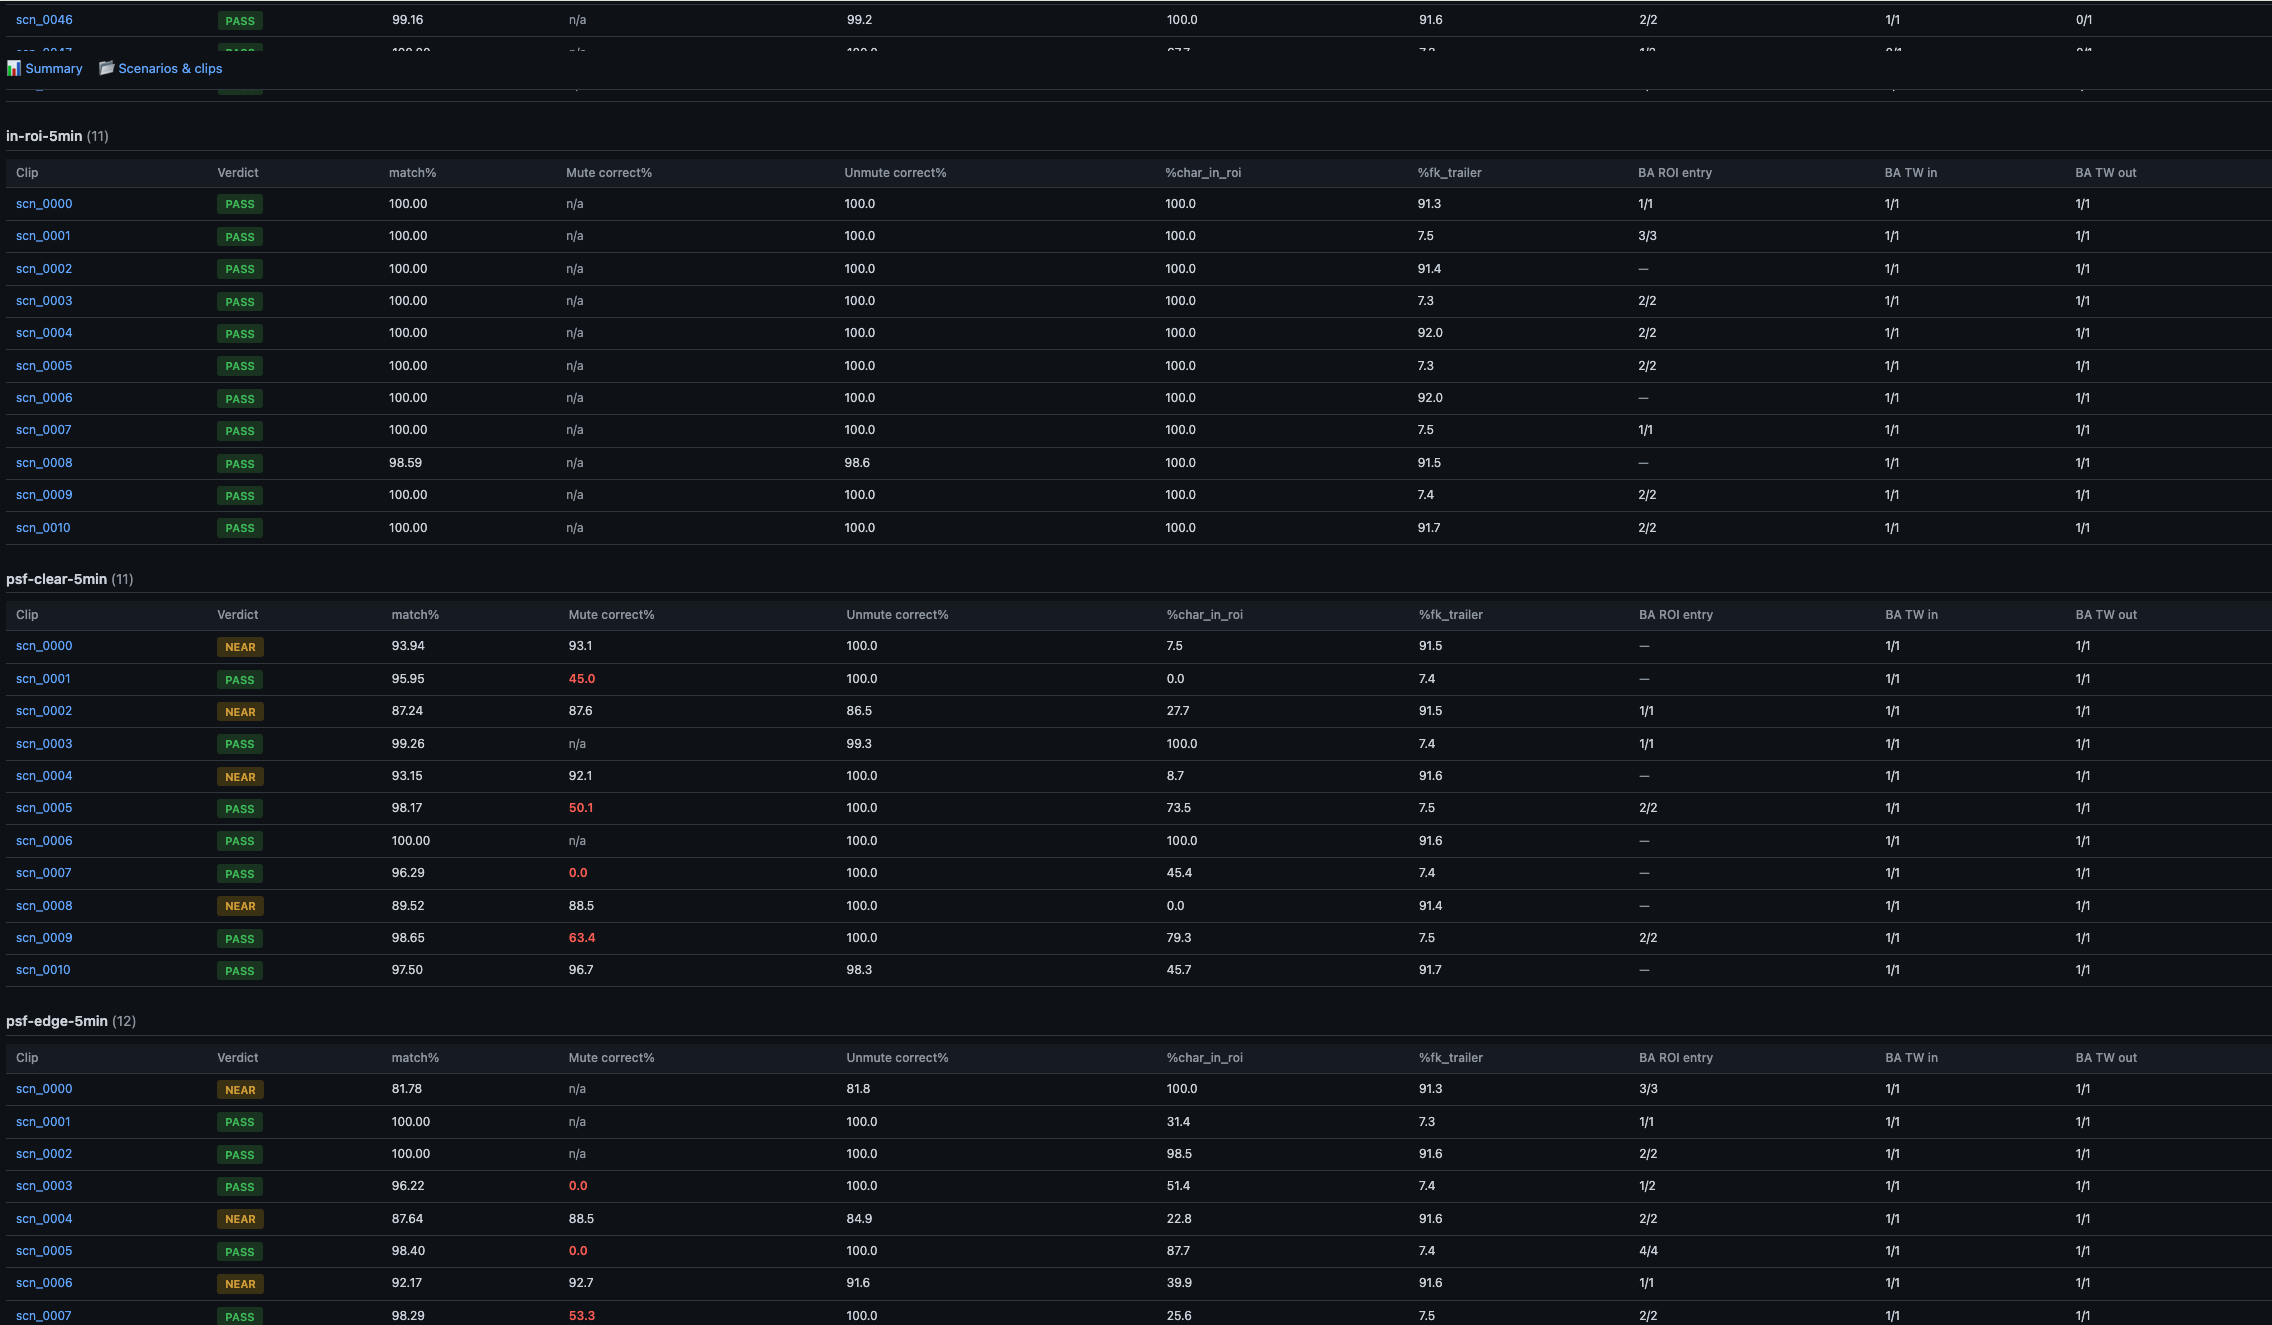
Per-scenario clip tables. The columns are identical on 2D and 3D runs.#
Each row is one clip: its verdict pill, match%, Mute correct% and Unmute correct%, then %char_in_roi and %fk_trailer for how much of the clip the character spent inside the ROI and the forklift inside the trailer, and finally BA ROI entry, BA TW in and BA TW out as matched/total. Values that diverge — a low Mute correct%, a BA count short of its total — are highlighted so a bad clip is visible without reading every number. n/a in Mute correct% means the clip had no GT-expected-mute frames, so there was nothing to test.
The clip id in the first column is a link. Click it to open the debug page, which is where the actual debugging happens.
Debug page#
The debug page is the per-clip view, and the reason the tool exists. The header repeats the verdict and the clip’s headline numbers; the left column holds the review video and a metadata card; the right column holds the synchronized panels.
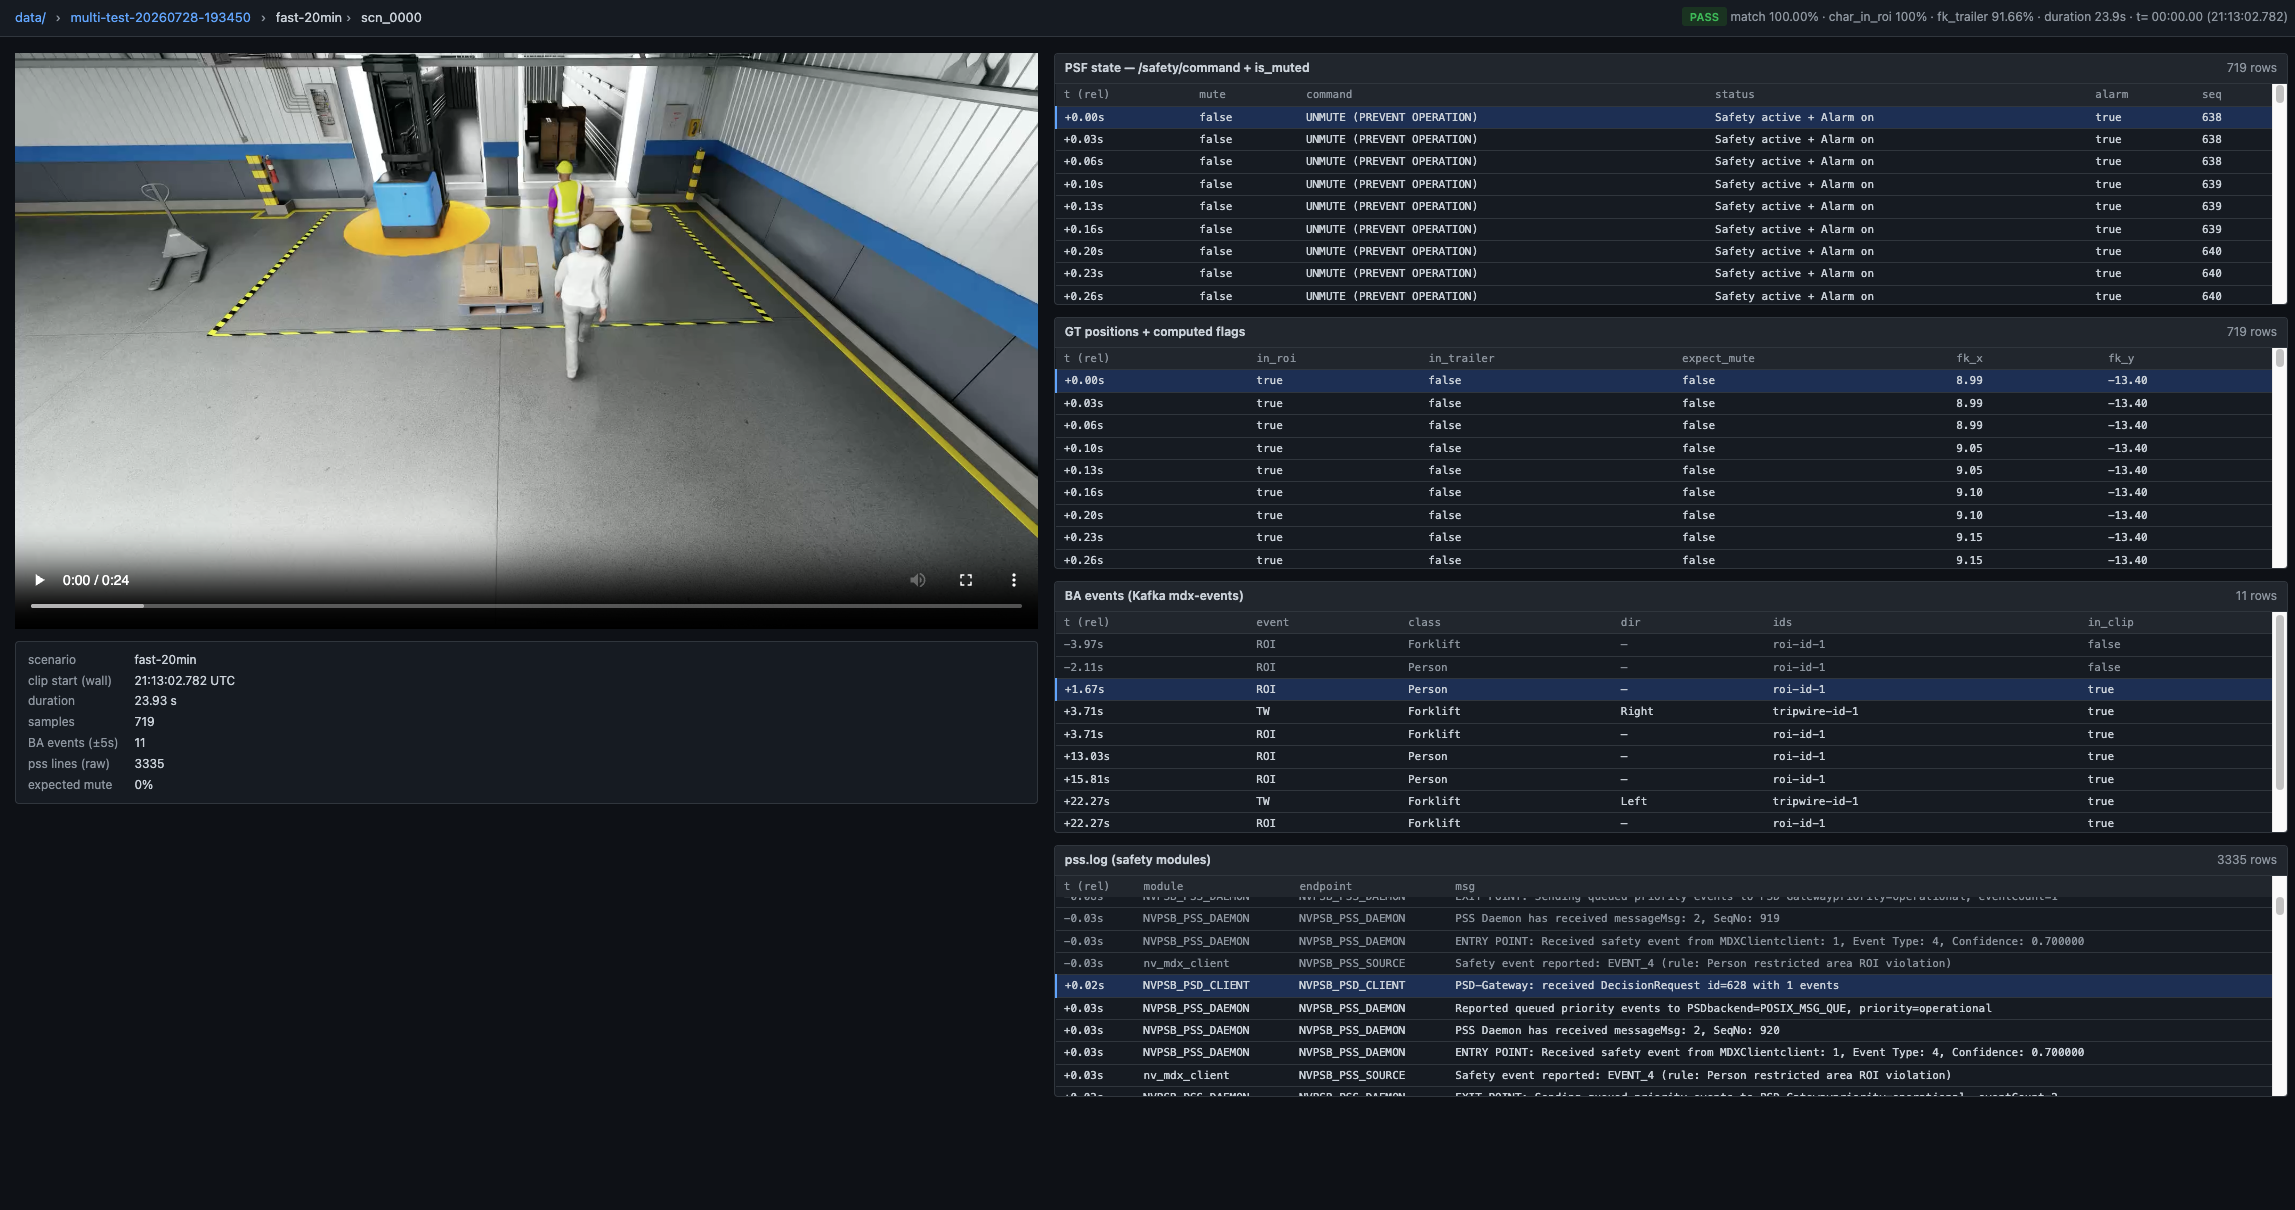
Debug page, 2D run: video, clip metadata, and the four Phase-1 panels.#
The metadata card under the video states the scenario, the wall-clock start, the duration, how many samples and BA events fall inside the clip, the raw pss.log line count, and the expected-mute share — the last one tells you immediately whether this clip could test muting at all.
The panels to the right are the evidence, and they are scrub-synced: drag the video and every panel jumps to the row matching the current video time; press play and they scroll with it. The sync key is the wall_time shared by all streams, so what you read in a panel is what the system saw at that frame. A 2D run shows four panels; a 3D run shows seven.
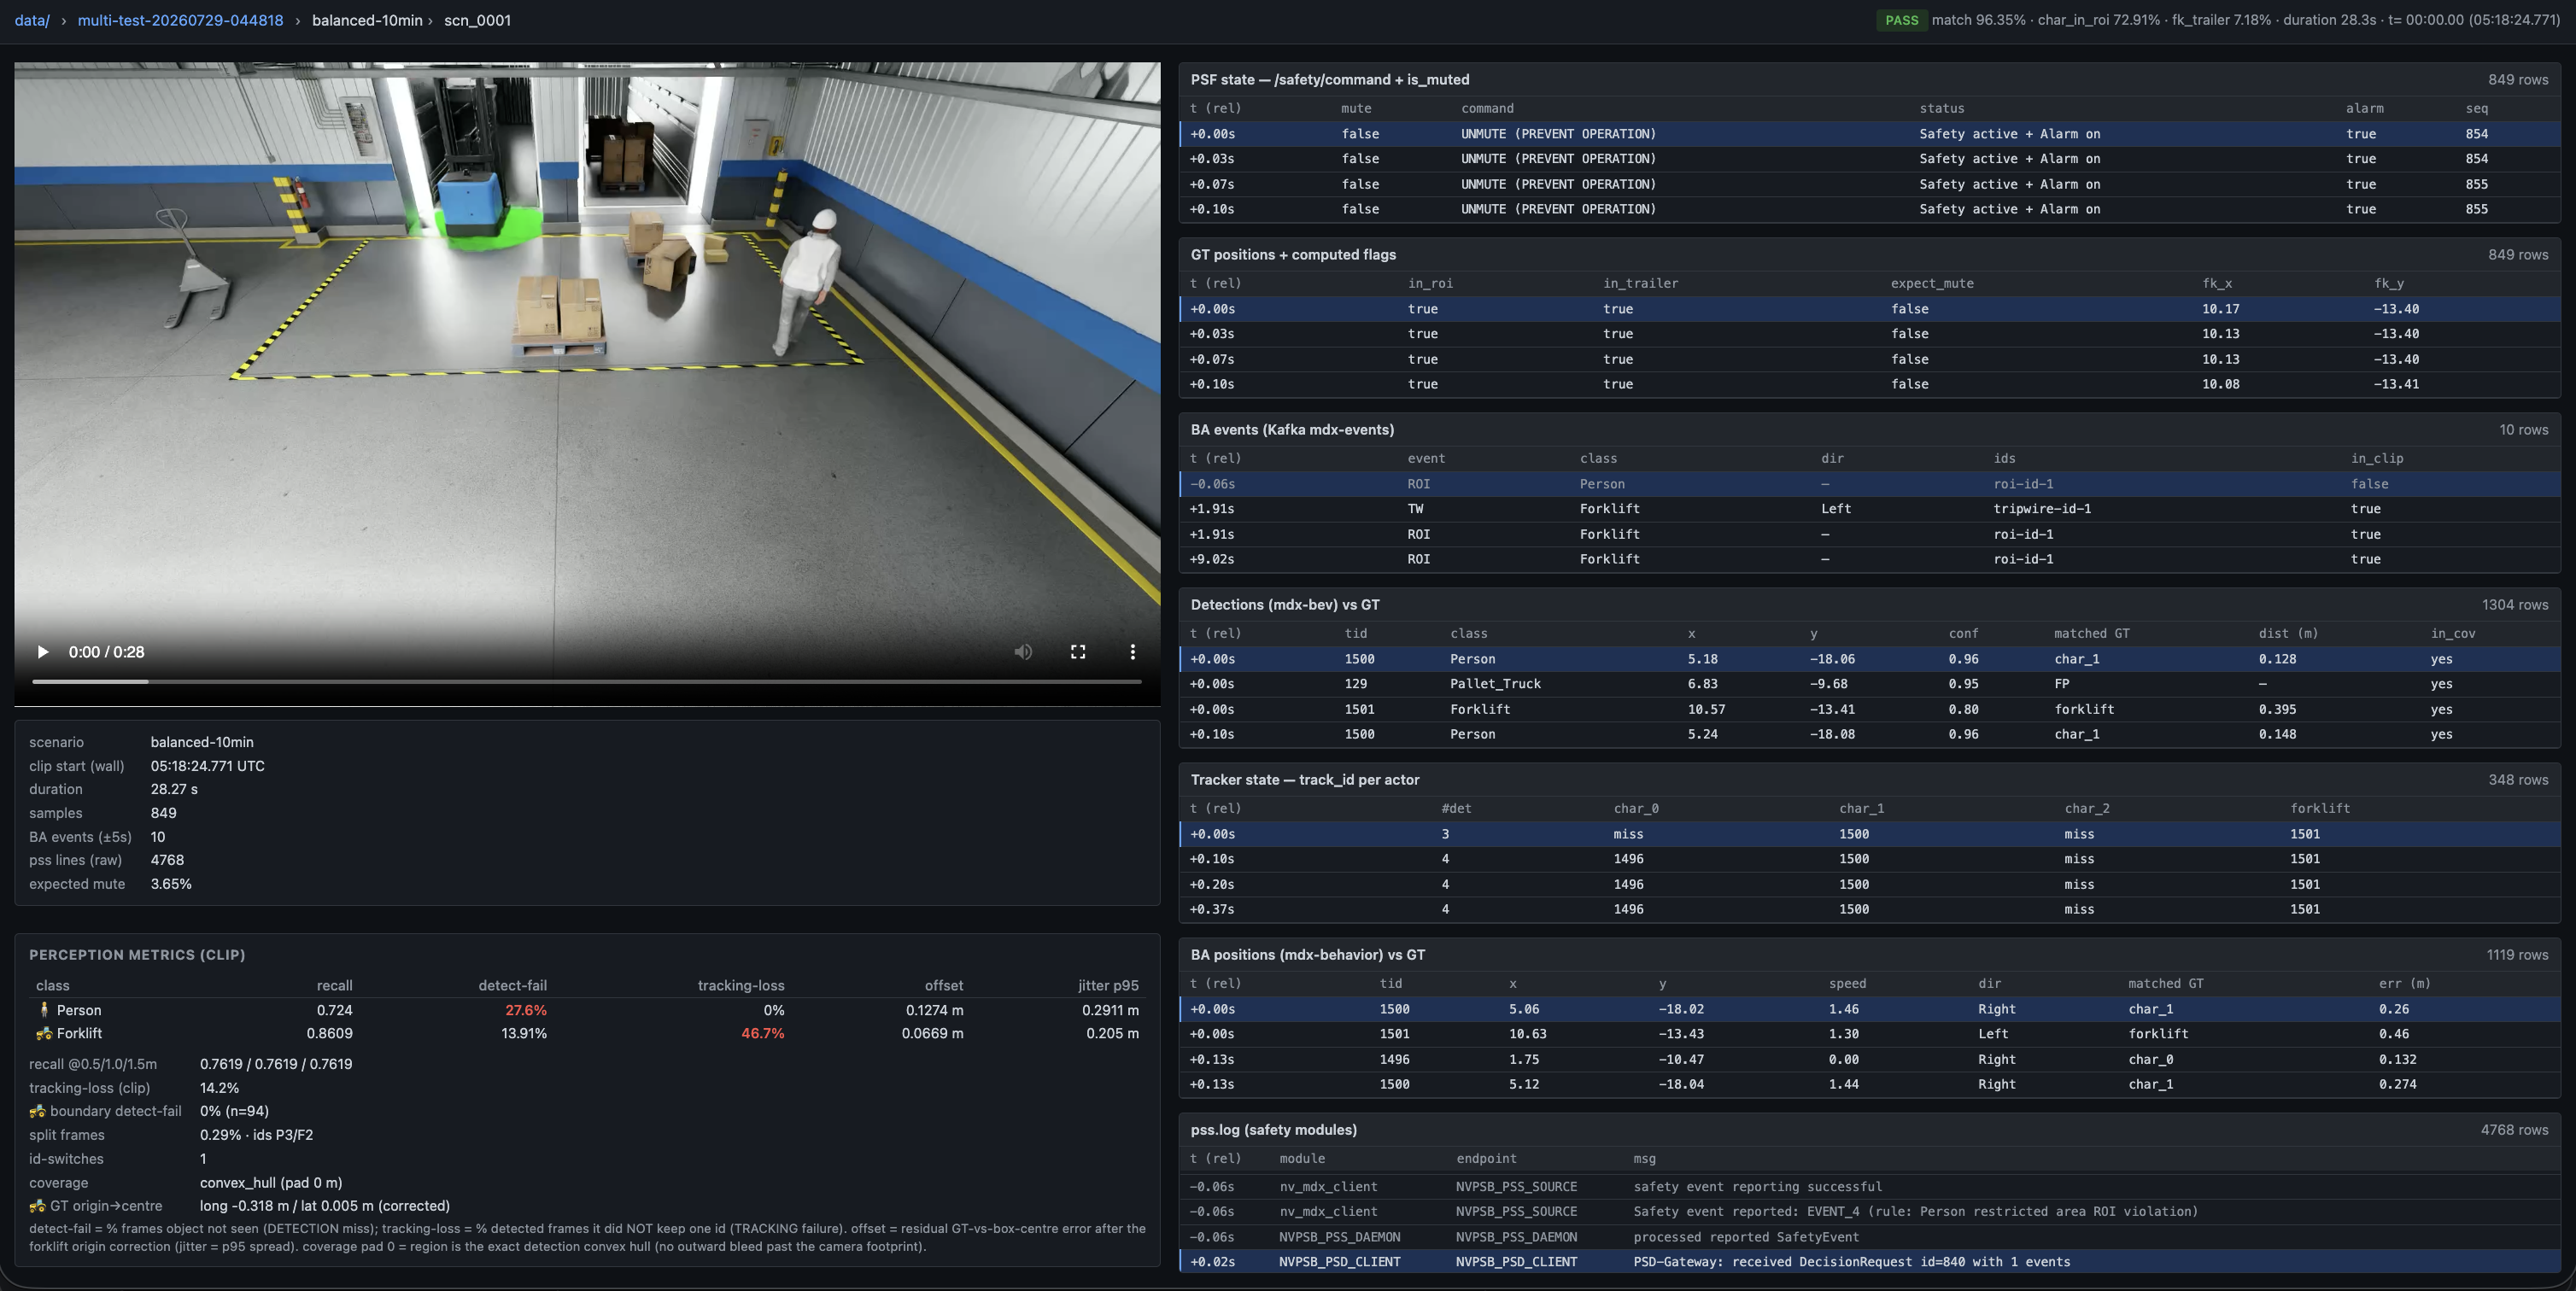
Debug page, 3D run: the extra perception metrics card on the left, and the Detections, Tracker-state and BA-positions panels on the right.#
A 3D run also gains a perception metrics (clip) card below the metadata — per-class recall, detect-fail, tracking-loss, offset and jitter p95 for this one clip, plus recall at 0.5 / 1.0 / 1.5 m, boundary detect-fail, split frames, id-switches and the coverage mode. It is the Phase 2 summary narrowed to the clip in front of you, which saves going back to the run page to ask whether this clip’s perception was typical.
Panel |
Shows |
|---|---|
Safety Core state |
Every command from |
GT positions |
Character / forklift world XY at 30 Hz, plus computed |
BA events |
Every Kafka event (type, classes, direction, ids), with a ±5 s padding window so you see what fired just before and after the clip. |
Detections (3D runs only) |
Sparse4D 3D detections ( |
Tracker state (3D runs only) |
The track id held per actor each frame, with |
BA positions (3D runs only) |
The position, speed and direction Behavior Analytics reported per track against ground truth, with the error in metres — localisation accuracy at the event seam rather than at the detector. |
Safety Core log slice |
The parsed Safety Core syslog ( |
The three 3D panels appear only when the run recorded the matching stream, so a 2D run simply does not render them.
Reading the pages together#
The three levels answer three different questions, and a debugging session usually walks all of them in order. The landing page says which run is worth opening. The run page says which scenario, and then which clip, is responsible. The debug page says why — and on a 3D run it separates a perception miss from a decision error, because the detector, the tracker and the Safety Core each have their own panel on the same timeline.
Caveats#
Video codec. VST records HEVC (H.265), which Firefox and most Chromium on Linux don’t decode. If the video shows a permanent spinner, transcode in place with
./transcode_to_h264.sh data/multi-test-<TIMESTAMP>.Single-user debug tool. No auth, no rate limits — it is a local debug tool, not a production dashboard.
Stale cache. After upgrading the viewer, hard-reload the browser (
Ctrl+Shift+R).
Spatial heatmaps (optional)#
For a spatial view of where perception failed, render heatmaps from the same clip_logs CSVs:
docker exec srr python3 /app/scripts/render_perception_heatmap.py \
  --runs-dir /app/runs/multi-test-<TIMESTAMP> --calib /app/calibration.json \
  --out /app/runs/multi-test-<TIMESTAMP>/perception_heatmaps --density --fov-mask
--density adds occupancy, and --fov-mask clips to the calibrated field of view — useful for confirming that a high forklift detect-fail% is deep-trailer occlusion rather than a detector regression.
Extending the viewer#
The viewer is vanilla JavaScript with no framework. To add columns, panels, pages, or themes, see the in-repo docs under tools/srr-debug-viewer/docs/ (architecture.md, data-schema.md, extending.md, troubleshooting.md). The data contract is srr.clip_logs.
Next steps#
Interpreting the Report — the metrics behind the panels.
Test Scenarios — the test cases you can run.
Quick Start Guide — produce a run to view.