
Per-UE SRS Metrics, Channel Estimates & IQ from Aerial Data Lake#
Visualizes pre-computed SRS measurements stored in ClickHouse during live operation. No GPU or pyAerial required.
Tables:
srs— per-UE scalar metrics + per-RB SNR (Array(Float32)).srs_hest— per-UE channel estimates as int16 complex pairs, layout[nPrbGrps, nRxAntSrs, nAntPorts](PRG fastest).srs_iq— per-cell raw SRS IQ samples, int16 reinterpretation of fp16 complex (__half2).
Prerequisites: YAML datalake_data_types: [..., srs_iq, srs, srs_hest].
Configuration & Imports#
[1]:
import numpy as np
import pandas as pd
import matplotlib.pyplot as plt
import clickhouse_connect

plt.rcParams['figure.figsize'] = [12, 4]

CLICKHOUSE_HOST = 'localhost'
CELL_ID = None     # Physical cell ID to filter on; None picks the lowest one present
N_RX_ANT_SRS = 4   # Cell-level: BS receive antennas used for SRS

client = clickhouse_connect.get_client(host=CLICKHOUSE_HOST)

if CELL_ID is None:
    n_rows, CELL_ID = client.query("SELECT count(), min(CellId) FROM srs").result_rows[0]
    if n_rows == 0:
        raise RuntimeError("The srs table is empty. Import the sample data or collect SRS data first.")
print(f"Cell ID: {CELL_ID}")
Cell ID: 51
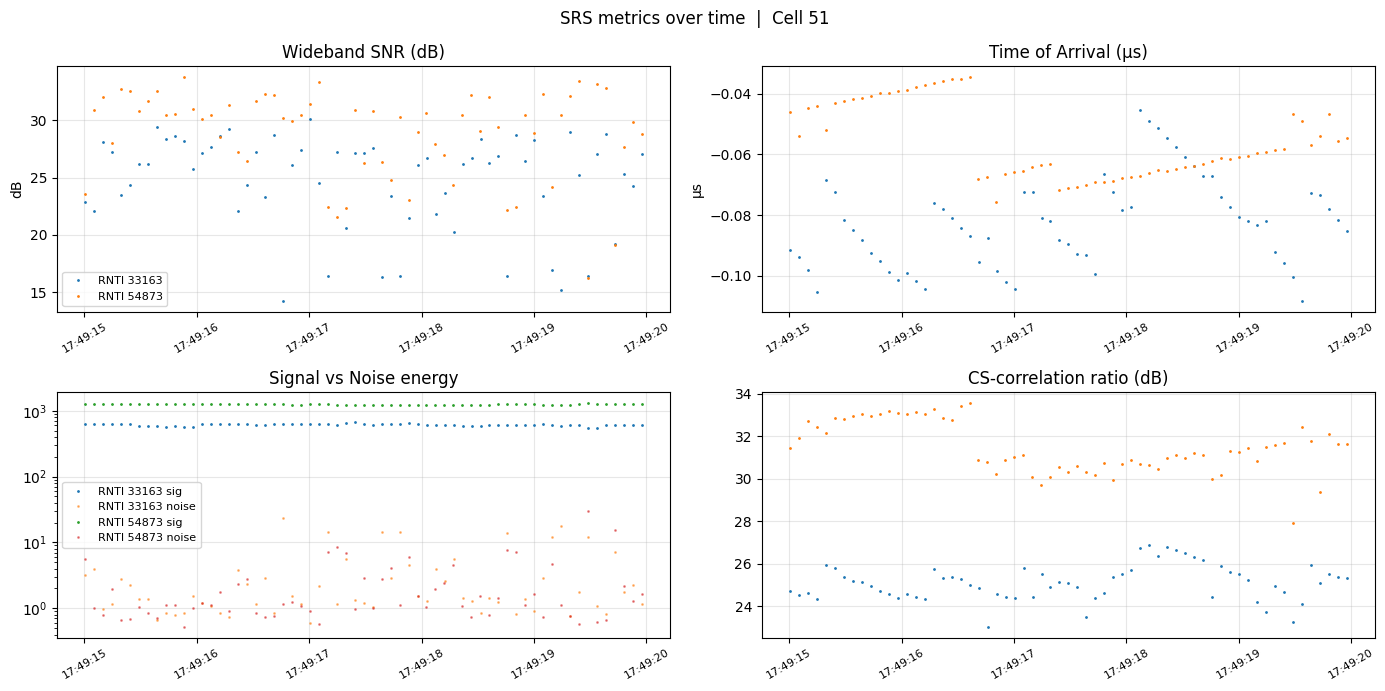
Time-Series of SRS Metrics#
Wideband SNR, TOA, and signal/noise energies. Useful to spot idle→active transitions and channel coherence.
[2]:
df = client.query_df(f"""
    SELECT TsTaiNs, SFN, Slot, rnti, widebandSnr, toaUs,
           signalEnergy, noiseEnergy, csCorrRatioDb, hdAntFlag
    FROM srs WHERE CellId = {CELL_ID}
    ORDER BY TsTaiNs
""")

if df.empty:
    raise RuntimeError(f"No srs rows for CellId={CELL_ID}")

print(f"{len(df)} rows, {df['rnti'].nunique()} UE(s), span {df['TsTaiNs'].min()} → {df['TsTaiNs'].max()}")
126 rows, 2 UE(s), span 2026-08-26 17:49:15.003500 → 2026-08-26 17:49:19.964000
[3]:
fig, axes = plt.subplots(2, 2, figsize=(14, 7))
fig.suptitle(f"SRS metrics over time  |  Cell {CELL_ID}")

for rnti, g in df.groupby('rnti'):
    label = f'RNTI {rnti}'
    axes[0, 0].plot(g['TsTaiNs'], g['widebandSnr'], '.', markersize=2, label=label)
    axes[0, 1].plot(g['TsTaiNs'], g['toaUs'], '.', markersize=2, label=label)
    axes[1, 0].plot(g['TsTaiNs'], g['signalEnergy'], '.', markersize=2, label=f'{label} sig')
    axes[1, 0].plot(g['TsTaiNs'], g['noiseEnergy'], '.', markersize=2, alpha=0.5, label=f'{label} noise')
    axes[1, 1].plot(g['TsTaiNs'], g['csCorrRatioDb'], '.', markersize=2, label=label)

axes[0, 0].set(title='Wideband SNR (dB)', ylabel='dB'); axes[0, 0].grid(alpha=0.3); axes[0, 0].legend(fontsize=8)
axes[0, 1].set(title='Time of Arrival (μs)', ylabel='μs'); axes[0, 1].grid(alpha=0.3)
axes[1, 0].set(title='Signal vs Noise energy', yscale='log'); axes[1, 0].grid(alpha=0.3); axes[1, 0].legend(fontsize=8)
axes[1, 1].set(title='CS-correlation ratio (dB)'); axes[1, 1].grid(alpha=0.3)
for ax in axes.flat:
    ax.tick_params(axis='x', rotation=30, labelsize=8)

plt.tight_layout()
plt.show()
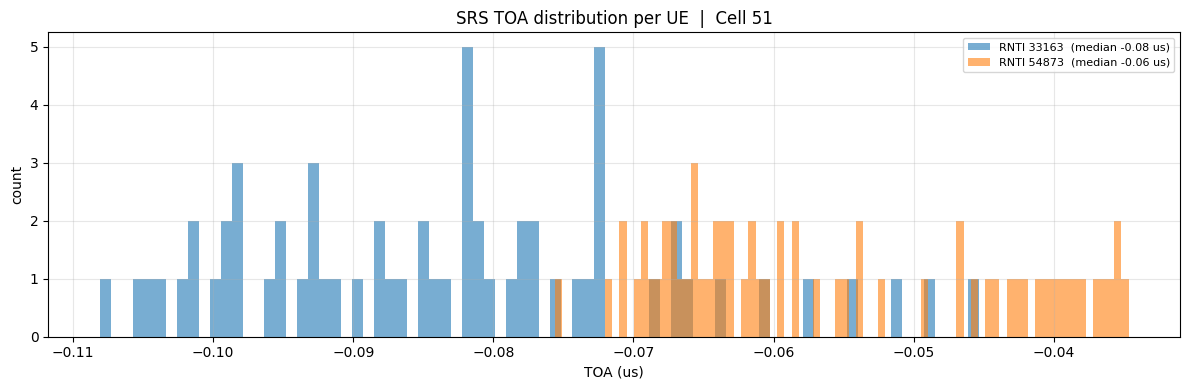
TOA Distribution per UE#
Histogram of SRS Time-of-Arrival. Useful for positioning / ranging and for spotting UE mobility (drift) and multipath spread.
[4]:
fig, ax = plt.subplots(figsize=(12, 4))
for rnti, g in df.groupby('rnti'):
    median = g['toaUs'].median()
    ax.hist(g['toaUs'], bins=80, alpha=0.6, label=f'RNTI {rnti}  (median {median:.2f} us)')
ax.set(title=f'SRS TOA distribution per UE  |  Cell {CELL_ID}',
       xlabel='TOA (us)', ylabel='count')
ax.grid(alpha=0.3)
ax.legend(fontsize=8)
plt.tight_layout()
plt.show()
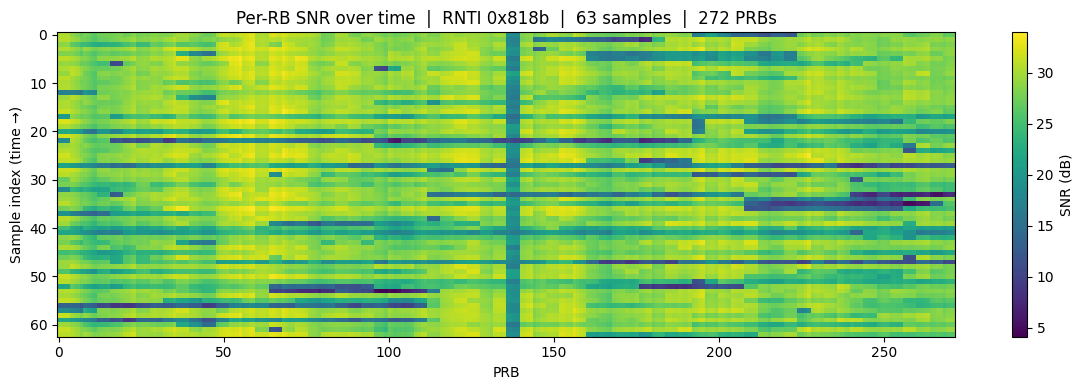
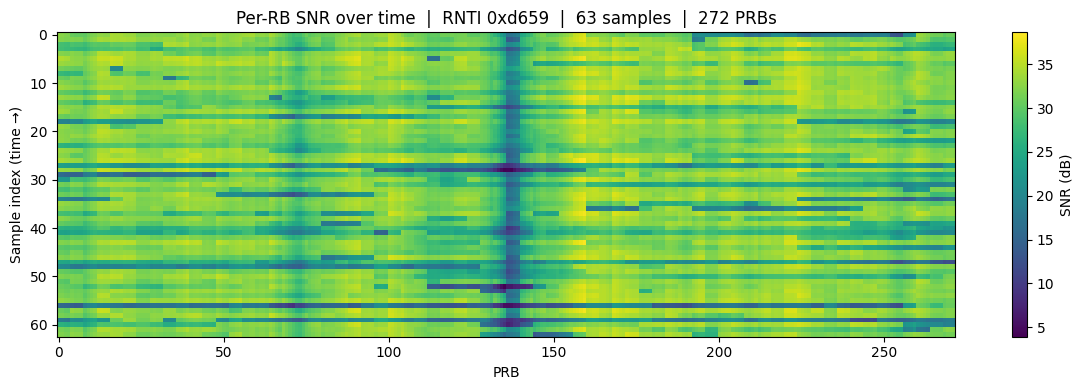
Per-RB SNR Heatmap#
rbSnrData array stacked over time. X-axis = PRB index, Y-axis = sample index (time). Reveals frequency-selective channel and traffic-driven changes.
[5]:
rb_df = client.query_df(f"""
    SELECT TsTaiNs, rnti, nValidPrg, rbSnrData
    FROM srs WHERE CellId = {CELL_ID}
    ORDER BY TsTaiNs LIMIT 500
""")

if not rb_df.empty:
    for rnti, grp in rb_df.groupby('rnti'):
        n_valid = int(grp.iloc[0]['nValidPrg'])
        mat = np.stack([np.array(r)[:n_valid] for r in grp['rbSnrData']])
        fig, ax = plt.subplots(figsize=(12, 4))
        im = ax.imshow(mat, aspect='auto', interpolation='nearest', cmap='viridis')
        ax.set(title=f'Per-RB SNR over time  |  RNTI {rnti:#06x}  |  {len(grp)} samples  |  {n_valid} PRBs',
               xlabel='PRB', ylabel='Sample index (time →)')
        plt.colorbar(im, label='SNR (dB)')
        plt.tight_layout()
        plt.show()
SRS Channel Estimate Decoding#
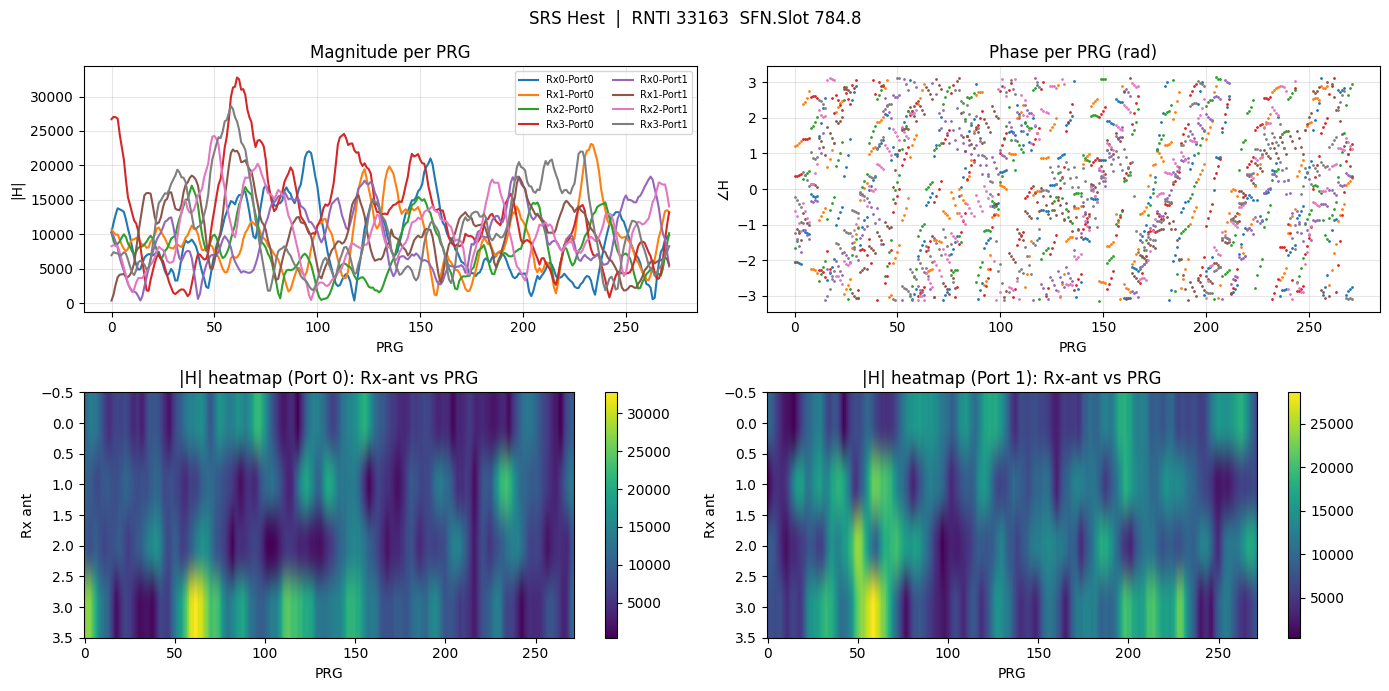
Layout [nPrbGrps, nRxAntSrs, nAntPorts] complex int16, PRG fastest-varying (column-major from cuPHY tensor).
[6]:
def decode_srs_hest(hest_data, hest_size_bytes, n_prb_grps, n_rx_ant_srs, n_ant_ports):
    """Decode srs_hest int16 row to complex64 array of shape (n_prb_grps, n_rx_ant_srs, n_ant_ports)."""
    n_int16_valid = hest_size_bytes // 2
    raw = np.array(hest_data[:n_int16_valid], dtype=np.int16).astype(np.float32)
    cplx = raw[0::2] + 1j * raw[1::2]
    # cuPHY column-major: PRG fastest. numpy reshape is row-major, so reverse dim order then transpose.
    return cplx.reshape(n_ant_ports, n_rx_ant_srs, n_prb_grps).transpose(2, 1, 0)
[7]:
hest_df = client.query_df(f"""
    SELECT h.SFN, h.Slot, h.rnti, h.hestSize, h.hestData,
           s.nPrbGrps, s.nAntPorts, s.widebandSnr, s.toaUs
    FROM srs_hest h ANY JOIN srs s
      ON h.CellId = s.CellId AND h.SFN = s.SFN AND h.Slot = s.Slot
         AND h.TsTaiNs = s.TsTaiNs AND h.rnti = s.rnti
    WHERE h.CellId = {CELL_ID}
    ORDER BY h.TsTaiNs DESC LIMIT 1
""")

if hest_df.empty:
    raise RuntimeError(f"No srs_hest rows joined with srs for CellId={CELL_ID}")

row = hest_df.iloc[0]
H = decode_srs_hest(row['hestData'], int(row['hestSize']),
                    int(row['nPrbGrps']), N_RX_ANT_SRS, int(row['nAntPorts']))
print(f"SFN.Slot {row['SFN']}.{row['Slot']}  RNTI {row['rnti']}  "
      f"SNR {row['widebandSnr']:.2f} dB  TOA {row['toaUs']:.2f} μs  shape {H.shape}")
SFN.Slot 784.8 RNTI 33163 SNR 27.08 dB TOA -0.09 μs shape (272, 4, 2)
[8]:
fig, axes = plt.subplots(2, 2, figsize=(14, 7))
fig.suptitle(f"SRS Hest  |  RNTI {row['rnti']}  SFN.Slot {row['SFN']}.{row['Slot']}")

for port in range(H.shape[2]):
    for ant in range(H.shape[1]):
        lbl = f'Rx{ant}-Port{port}'
        axes[0, 0].plot(np.abs(H[:, ant, port]), label=lbl)
        axes[0, 1].plot(np.angle(H[:, ant, port]), '.', markersize=2, label=lbl)

axes[0, 0].set(title='Magnitude per PRG', xlabel='PRG', ylabel='|H|'); axes[0, 0].grid(alpha=0.3); axes[0, 0].legend(fontsize=7, ncol=2)
axes[0, 1].set(title='Phase per PRG (rad)', xlabel='PRG', ylabel='∠H'); axes[0, 1].grid(alpha=0.3)

im0 = axes[1, 0].imshow(np.abs(H[:, :, 0]).T, aspect='auto', cmap='viridis')
axes[1, 0].set(title='|H| heatmap (Port 0): Rx-ant vs PRG', xlabel='PRG', ylabel='Rx ant')
plt.colorbar(im0, ax=axes[1, 0])

if H.shape[2] > 1:
    im1 = axes[1, 1].imshow(np.abs(H[:, :, 1]).T, aspect='auto', cmap='viridis')
    axes[1, 1].set(title='|H| heatmap (Port 1): Rx-ant vs PRG', xlabel='PRG', ylabel='Rx ant')
    plt.colorbar(im1, ax=axes[1, 1])
else:
    axes[1, 1].axis('off')

plt.tight_layout()
plt.show()
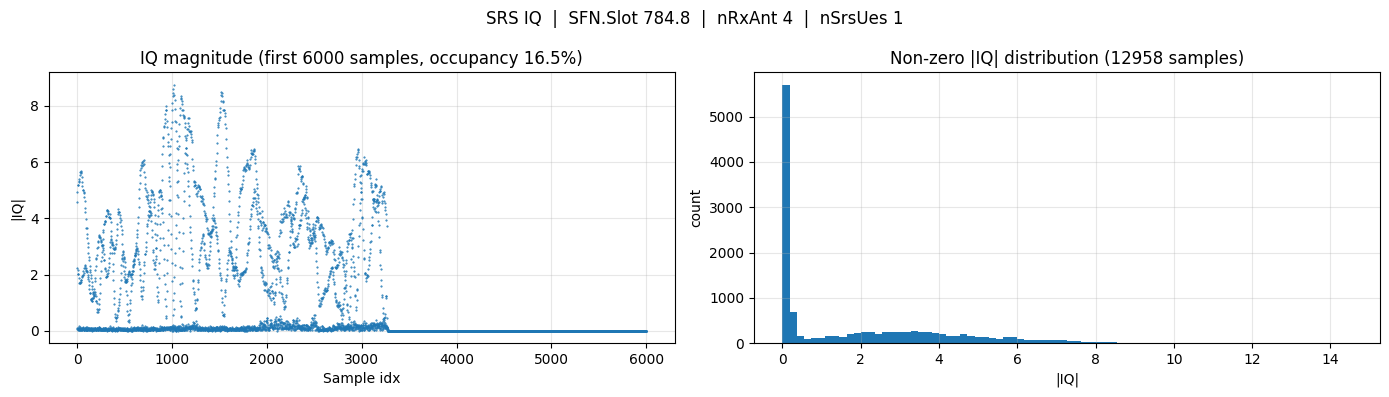
SRS IQ Samples#
Buffer is __half2 (fp16 complex) reinterpreted as int16. We recover float magnitudes and show subcarrier occupancy and time-domain magnitude.
[9]:
iq_df = client.query_df(f"""
    SELECT TsTaiNs, SFN, Slot, nRxAntSrs, nSrsUes, iqData
    FROM srs_iq WHERE CellId = {CELL_ID}
    ORDER BY TsTaiNs DESC LIMIT 1
""")

if iq_df.empty:
    raise RuntimeError(f"No srs_iq rows for CellId={CELL_ID}")

iq_row = iq_df.iloc[0]
iq_int16 = np.array(iq_row['iqData'], dtype=np.int16)
iq_fp16 = np.frombuffer(iq_int16.tobytes(), dtype=np.float16).astype(np.float32)
iq_complex = iq_fp16[0::2] + 1j * iq_fp16[1::2]

magnitude = np.abs(iq_complex)
occupied = magnitude > 0

fig, axes = plt.subplots(1, 2, figsize=(14, 4))
fig.suptitle(f"SRS IQ  |  SFN.Slot {iq_row['SFN']}.{iq_row['Slot']}  |  nRxAnt {iq_row['nRxAntSrs']}  |  nSrsUes {iq_row['nSrsUes']}")

axes[0].plot(magnitude[:6000], '.', markersize=1)
axes[0].set(title=f'IQ magnitude (first 6000 samples, occupancy {occupied.mean()*100:.1f}%)',
            xlabel='Sample idx', ylabel='|IQ|')
axes[0].grid(alpha=0.3)

# Histogram of non-zero magnitudes (avoids dominating zero bin from comb gaps + padding)
axes[1].hist(magnitude[occupied], bins=80)
axes[1].set(title=f'Non-zero |IQ| distribution ({occupied.sum()} samples)',
            xlabel='|IQ|', ylabel='count')
axes[1].grid(alpha=0.3)

plt.tight_layout()
plt.show()