Benchmarking Geneformer
Contents
import sklearn
import pickle as pkl
Benchmarking Geneformer#
Here we benchmark four models, with two baselines. These models are tasked with cell type classification, using the Chron’s disease small intestine dataset from Elmentaite et al. (2020), Developmental Cell. This dataset contains approximately 22,500 single cells from both healthy children aged 4-13 and chidlren with Chron’s disease. This dataset contains 31 unique cell types which we assume to be annotated accurately. This dataset was held out of our pre-training dataset as all diseased samples were removed.
Baseline 1) scRNA workflow: this model uses PCA with 10 components and random forest on normalized and log transformed expression counts to produce a result.
Baseline 2) geneformer-qa, a model trained for approximately 100 steps with approximately random weights. We expect this model to perform no differently than working on counts directly.
geneformer-10M + geneformer106M as described in the model cards.
First, we download the dataset from czi that we are interested in, and then create the requisite sc_memmap dataset object.
import cellxgene_census
CENSUS_VERSION = "2023-12-15"
with cellxgene_census.open_soma(census_version=CENSUS_VERSION) as census:
    adata = cellxgene_census.get_anndata(census, "Homo sapiens",
            obs_value_filter='dataset_id=="8e47ed12-c658-4252-b126-381df8d52a3d"',
        )
adata.obs.cell_type.value_counts()


adata.obs['cell_type'].unique()
KeyboardInterrupt
Create the scmemmap object, check outputs#
python bionemo/data/singlecell/sc_memmap.py --data-path ./celltype-bench-dataset/ --save-path ./celltype-bench-dataset/ --obs-cols cell_type --strict-metadata
ls ./celltype-bench-dataset/
features.csv              gene_expression_ind.npy  hs-celltype-bench.h5ad
gene_expression_data.npy  gene_expression_ptr.npy  metadata.json
Importantly, the .npy files are used by BioNeMo dataset object. features.csv contains the metadata requested, in this case cell_type. It’s important that the output of our model has the same order as features.csv, as this contains the labels used in the following benchmark.
Execute inference#
We run inference on all there of our models, which are downloaded by download_artifacts.py
python download_artifacts.py --models geneformer_106M_240530 geneformer_10M_240530 geneformer --source pbss --download_dir /workspace/bionemo/models --verbose
 python bionemo/model/infer.py \
         --config-dir examples/singlecell/geneformer/conf \
         --config-name infer.yaml \
         ++model.batch_size=1 \
         ++model.micro_batch_size=1 \
         ++model.data.batch_size=64 \
         ++trainer.devices=1 \ # IMPORTANT- running inference with more than one device can lead to a mismatch between `features.csv` and embeddings as result order is non-deterministic.
         ++trainer.precision=bf16-mixed \
         ++model.downstream_task.restore_from_path=/workspace/bionemo/models/singlecell/geneformer/geneformer-106M-240530.nemo \
         ++model.data.output_fname=/workspace/bionemo/celltype-bench-dataset/infer_results_106M.pkl \
         ++model.tensor_model_parallel=1 \
         ++model.data.dataset_path=/workspace/bionemo/celltype-bench-dataset \
         # These dont do anything, but are required for the code to execute, unfortunately. If you dont have them, simply create an empty directory with mkdir -p
         ++model.data.train_dataset_path=/workspace/bionemo/examples/tests/test_data/cellxgene_2023-12-15_small/processed_data/train \
         ++model.data.val_dataset_path=/workspace/bionemo/examples/tests/test_data/cellxgene_2023-12-15_small/processed_data/val \
         ++model.data.test_dataset_path=/workspace/bionemo/examples/tests/test_data/cellxgene_2023-12-15_small/processed_data/test
Then check the outputs:
ls ./celltype-bench-dataset/infer_results_106M.pkl
./celltype-bench-dataset/infer_results_106M.pkl
From here everything is good to go!
Benchmarking#
see below the benchmarking snippet. We take in a datavector, and a set of labels. We optionally fit PCA and then a RF model inside cross validation. Metrics are using the macro (average over each class) for handling multi-class labels. Additionally, we return the confusion matrix for further investigation.
def run_benchmark(data, labels, use_pca=True):
    '''
    data - contains the single cell expression (or whatever feature) in each row.
    labels - contains the string label for each cell

    data_shape (R, C)
    labels_shape (R,)
    '''
    import numpy as np
    from sklearn.ensemble import RandomForestClassifier
    from sklearn.random_projection import GaussianRandomProjection
    from sklearn.pipeline import Pipeline
    from sklearn.model_selection import StratifiedKFold, cross_validate
    from sklearn.preprocessing import LabelEncoder
    from sklearn.metrics import make_scorer, accuracy_score, precision_score, recall_score, f1_score, roc_auc_score, confusion_matrix
    from sklearn.decomposition import PCA
    from sklearn.model_selection import cross_val_predict

    np.random.seed(1337)
    # Define the target dimension 'n_components'
    n_components = 10  # for example, adjust based on your specific needs

    # Create a pipeline that includes Gaussian random projection and RandomForestClassifier
    if use_pca:
        pipeline = Pipeline([
            ('projection', PCA(n_components=n_components)),
            ('classifier', RandomForestClassifier(class_weight='balanced'))
        ])
    else:
        pipeline = Pipeline([
            ('classifier', RandomForestClassifier(class_weight='balanced'))
        ])

    # Set up StratifiedKFold to ensure each fold reflects the overall distribution of labels
    cv = StratifiedKFold(n_splits=5)

    # Define the scoring functions
    scoring = {
        'accuracy': make_scorer(accuracy_score),
        'precision': make_scorer(precision_score, average='macro'),  # 'macro' averages over classes
        'recall': make_scorer(recall_score, average='macro'),
        'f1_score': make_scorer(f1_score, average='macro'),
        # 'roc_auc' requires probability or decision function; hence use multi_class if applicable
        'roc_auc': make_scorer(roc_auc_score, multi_class='ovr', needs_proba=True),
        # 'test': make_scorer(dummy_func)
    }

    # Perform stratified cross-validation with multiple metrics using the pipeline
    results = cross_validate(pipeline, data, labels, cv=cv, scoring=scoring, return_train_score=False)

    # Print the cross-validation results
    print("Cross-validation metrics:")
    results_out = {}
    for metric, scores in results.items():
        if metric.startswith('test_'):
            results_out[metric] = (scores.mean(), scores.std())
            print(f"{metric[5:]}: {scores.mean():.3f} (+/- {scores.std():.3f})")

    predictions = cross_val_predict(pipeline, data, labels, cv=cv)

    # Return confusion matrix and metrics.
    conf_matrix = confusion_matrix(labels, predictions)

    return results_out, conf_matrix
import pickle as pkl
# Loadup the randomly initialized model
with open('../celltype-bench-dataset/infer_results.pkl', 'rb') as fd:
     infer_results = pkl.load(fd)
print(infer_results[-1]['embeddings'].shape)
infer_Xs = np.array([x['embeddings'] for x in infer_results])
(256,)
import pickle as pkl
# Load up the 10M parameter model predictions
with open('../celltype-bench-dataset/infer_results_10M.pkl', 'rb') as fd:
     infer_results = pkl.load(fd)
print(infer_results[-1]['embeddings'].shape)
infer_Xs_10M = np.array([x['embeddings'] for x in infer_results])
(256,)
import pickle as pkl
# Loadup the 106M parameter model predictions
with open('../celltype-bench-dataset/infer_results_106M.pkl', 'rb') as fd:
     infer_results = pkl.load(fd)
print(infer_results[-1]['embeddings'].shape)
infer_Xs_106M = np.array([x['embeddings'] for x in infer_results])
(768,)
import pandas as pd
import scanpy
import numpy as np
# Now fetch the class labels and raw expression for the same dataset. These are used as labels in classification and as one of our baselines.

infer_metadata = pd.read_csv('../celltype-bench-dataset/features.csv')
raw_data = scanpy.read('../celltype-bench-dataset/hs-celltype-bench.h5ad')
raw_Xs = np.asarray(raw_data.X.todense())
# Here we perform a norm over the total counts for each cell, adding a pseudocount to assist with the following logarithm.
normed_Xs = (raw_Xs + 1) / raw_Xs.sum(axis=1, keepdims=True)
logp1_Xs = np.log( normed_Xs )
/workspace/bionemo/.local/lib/python3.10/site-packages/anndata/__init__.py:51: FutureWarning: `anndata.read` is deprecated, use `anndata.read_h5ad` instead. `ad.read` will be removed in mid 2024.
  warnings.warn(
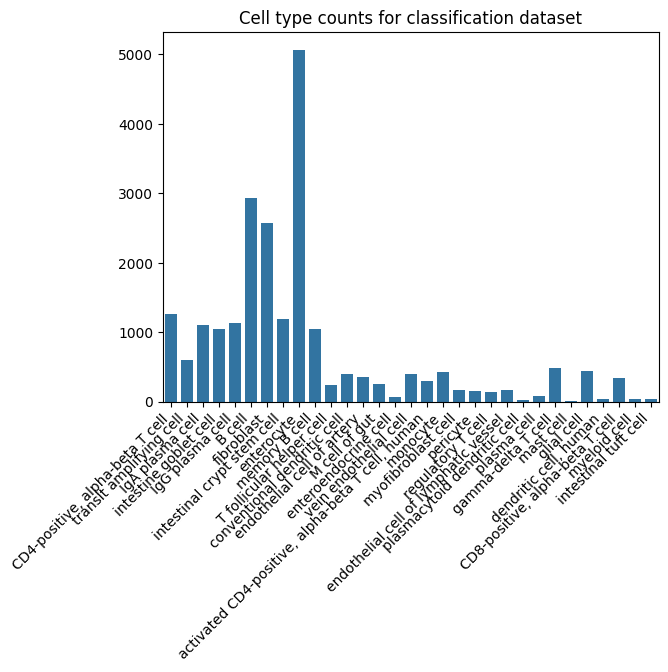
# Now we look at our dataset, how is the distribution of cell counts? Its clear that certain celltypes dominate the dataset, this is good to keep in mind when investigating models.
#  we expect the macro averages and F1-score to be the most reliable metrics for overall performance.
from collections import Counter
import seaborn as sb

labels = infer_metadata['cell_type'].values
label_counts = Counter(labels)

ax = sb.barplot(x=label_counts.keys(), y=label_counts.values())
ax.set_xticklabels(ax.get_xticklabels(), rotation=45, ha='right')
ax.set_title("Cell type counts for classification dataset")
/tmp/ipykernel_485848/2938980837.py:10: UserWarning: set_ticklabels() should only be used with a fixed number of ticks, i.e. after set_ticks() or using a FixedLocator.
  ax.set_xticklabels(ax.get_xticklabels(), rotation=45, ha='right')
Text(0.5, 1.0, 'Cell type counts for classification dataset')
# Now we assign integer labels to each of our strings. These do not need to be transformed into one-hot vectors as Random Forest is non-parametric.
from sklearn.preprocessing import LabelEncoder
label_encoder = LabelEncoder()
integer_labels = label_encoder.fit_transform(labels)
print(integer_labels)
[ 1 29 1 ... 14 12 3]
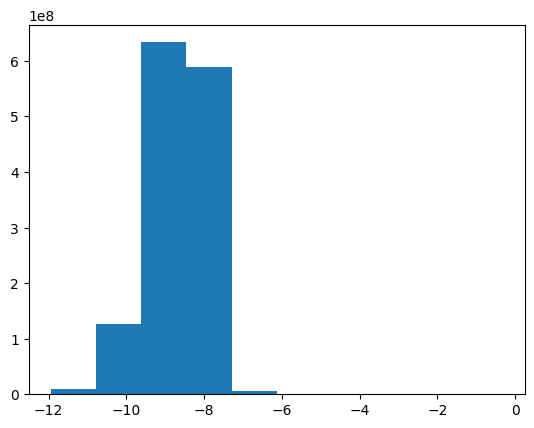
# Distribution of log transforms, looks decent.
pyplot.hist(logp1_Xs.flatten())
(array([9.97710900e+06, 1.26189975e+08, 6.33319495e+08, 5.88568351e+08,
        5.25076500e+06, 1.32944300e+06, 3.54771000e+05, 5.94530000e+04,
        9.95400000e+03, 2.01200000e+03]),
 array([-11.93355465, -10.77401161,  -9.61446857,  -8.45492649,
         -7.29538298,  -6.13584042,  -4.97629738,  -3.81675458,
         -2.65721154,  -1.49766874,  -0.33812588]),
 <BarContainer object of 10 artists>)
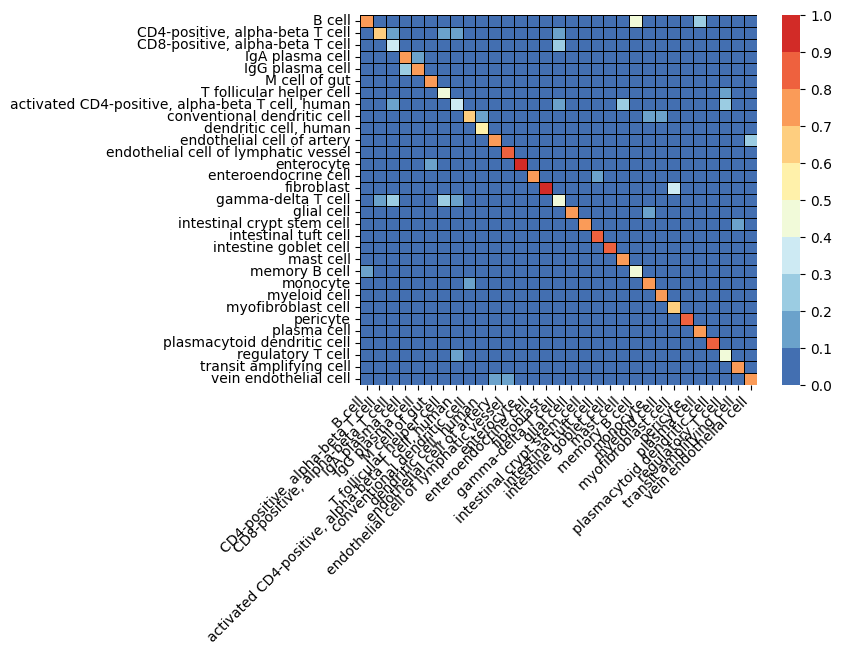
def plot_cm(cm, labels=label_encoder.classes_):
    '''
    Helper function for visualizing accuracy across labels.
    '''
    from matplotlib.colors import BoundaryNorm, ListedColormap

    # Example confusion matrix (replace with your actual data)
    conf_matrix = np.random.rand(31, 31)

    # Define the bins and the color map
    bounds = np.arange(0.0, 1.1, 0.1)
    cmap = ListedColormap(sb.color_palette("RdYlBu_r", len(bounds) - 1))
    norm = BoundaryNorm(boundaries=bounds, ncolors=len(bounds) - 1, clip=True)

    _ = sb.heatmap(cm / cm.sum(axis=0),cmap=cmap, norm=norm, cbar_kws={"ticks": bounds}, linewidths=0.5, linecolor='black', xticklabels=labels, yticklabels=labels)
    pyplot.xticks(rotation=45, ha='right')
    _ = pyplot.yticks(rotation=0)
Execute benchmarks#
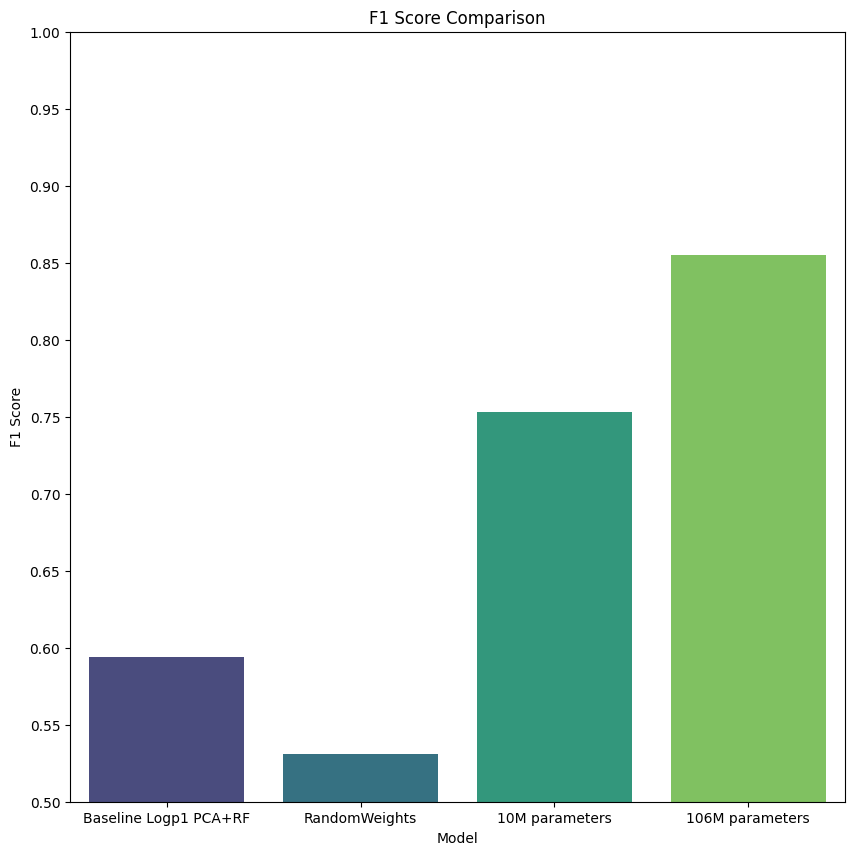
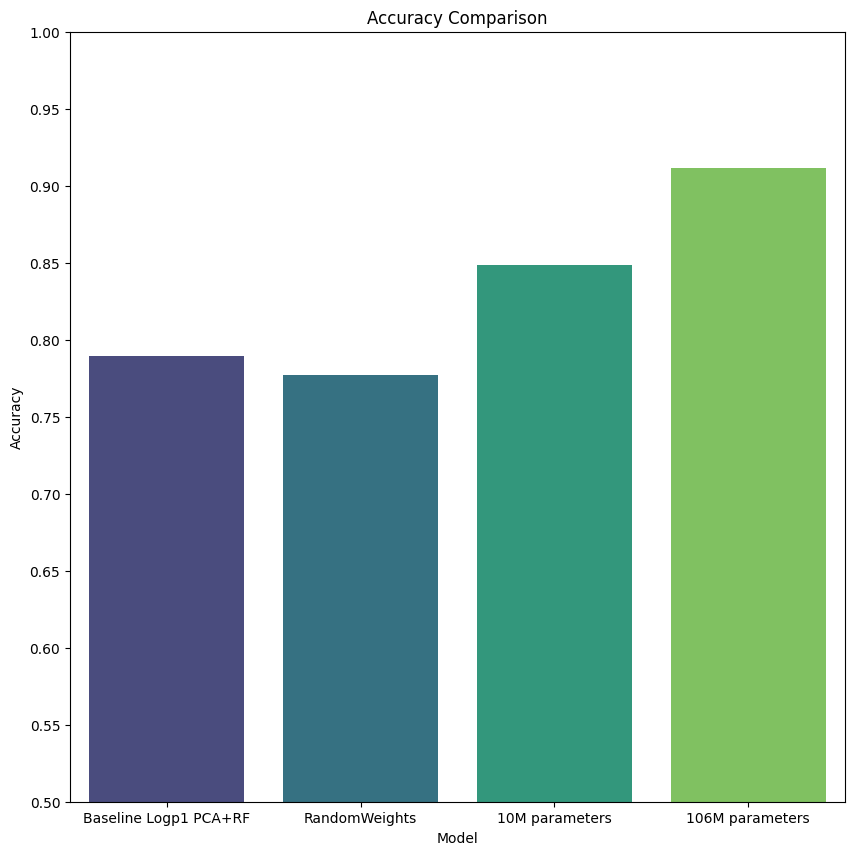
Finally we execute our benchmarks, and collect results and confusion matrix. You can see in the figures below, we plot the performance by cell type for each model (confusion matrix heatmap). Perhaps unsurprisingly, we see that the most frequent cell type (enterocyte) has the highest accuracy across all models. This suggests bias in the model due to unbalanced data, however, further investigation is beyond the scope of this tutorial. Furthermore, we see continually improved performance as we move through the models, from baselines, to our provided pretrained model.
Perhaps most interesting is the 106M parameter model, which clearly outperforms all other models by all metrics, but especially by F1-score. This suggests that training larger models based on geneformer perform well, and that more work may be done.
logp1_results, logp1_cm = run_benchmark(logp1_Xs, integer_labels)
/usr/local/lib/python3.10/dist-packages/sklearn/metrics/_classification.py:1344: UndefinedMetricWarning: Precision is ill-defined and being set to 0.0 in labels with no predicted samples. Use `zero_division` parameter to control this behavior.
  _warn_prf(average, modifier, msg_start, len(result))
/usr/local/lib/python3.10/dist-packages/sklearn/metrics/_classification.py:1344: UndefinedMetricWarning: Precision is ill-defined and being set to 0.0 in labels with no predicted samples. Use `zero_division` parameter to control this behavior.
  _warn_prf(average, modifier, msg_start, len(result))
/usr/local/lib/python3.10/dist-packages/sklearn/metrics/_classification.py:1344: UndefinedMetricWarning: Precision is ill-defined and being set to 0.0 in labels with no predicted samples. Use `zero_division` parameter to control this behavior.
  _warn_prf(average, modifier, msg_start, len(result))
/usr/local/lib/python3.10/dist-packages/sklearn/metrics/_classification.py:1344: UndefinedMetricWarning: Precision is ill-defined and being set to 0.0 in labels with no predicted samples. Use `zero_division` parameter to control this behavior.
  _warn_prf(average, modifier, msg_start, len(result))
Cross-validation metrics:
accuracy: 0.790 (+/- 0.026)
precision: 0.684 (+/- 0.033)
recall: 0.572 (+/- 0.016)
f1_score: 0.594 (+/- 0.015)
roc_auc: 0.973 (+/- 0.007)
plot_cm(logp1_cm)
qa_results, qa_cm = run_benchmark(infer_Xs, integer_labels, use_pca=False)
/usr/local/lib/python3.10/dist-packages/sklearn/metrics/_classification.py:1344: UndefinedMetricWarning: Precision is ill-defined and being set to 0.0 in labels with no predicted samples. Use `zero_division` parameter to control this behavior.
  _warn_prf(average, modifier, msg_start, len(result))
/usr/local/lib/python3.10/dist-packages/sklearn/metrics/_classification.py:1344: UndefinedMetricWarning: Precision is ill-defined and being set to 0.0 in labels with no predicted samples. Use `zero_division` parameter to control this behavior.
  _warn_prf(average, modifier, msg_start, len(result))
/usr/local/lib/python3.10/dist-packages/sklearn/metrics/_classification.py:1344: UndefinedMetricWarning: Precision is ill-defined and being set to 0.0 in labels with no predicted samples. Use `zero_division` parameter to control this behavior.
  _warn_prf(average, modifier, msg_start, len(result))
/usr/local/lib/python3.10/dist-packages/sklearn/metrics/_classification.py:1344: UndefinedMetricWarning: Precision is ill-defined and being set to 0.0 in labels with no predicted samples. Use `zero_division` parameter to control this behavior.
  _warn_prf(average, modifier, msg_start, len(result))
/usr/local/lib/python3.10/dist-packages/sklearn/metrics/_classification.py:1344: UndefinedMetricWarning: Precision is ill-defined and being set to 0.0 in labels with no predicted samples. Use `zero_division` parameter to control this behavior.
  _warn_prf(average, modifier, msg_start, len(result))
Cross-validation metrics:
accuracy: 0.777 (+/- 0.024)
precision: 0.708 (+/- 0.046)
recall: 0.495 (+/- 0.020)
f1_score: 0.531 (+/- 0.024)
roc_auc: 0.975 (+/- 0.008)
plot_cm(logp1_cm)
results_10m, cm_10m = run_benchmark(infer_Xs_10M, integer_labels, use_pca=False)
/usr/local/lib/python3.10/dist-packages/sklearn/metrics/_classification.py:1344: UndefinedMetricWarning: Precision is ill-defined and being set to 0.0 in labels with no predicted samples. Use `zero_division` parameter to control this behavior.
  _warn_prf(average, modifier, msg_start, len(result))
Cross-validation metrics:
accuracy: 0.848 (+/- 0.019)
precision: 0.854 (+/- 0.016)
recall: 0.722 (+/- 0.020)
f1_score: 0.753 (+/- 0.015)
roc_auc: 0.989 (+/- 0.001)
plot_cm(logp1_cm)
results_106M, cm_106M = run_benchmark(infer_Xs_106M, integer_labels, use_pca=False)
Cross-validation metrics:
accuracy: 0.912 (+/- 0.016)
precision: 0.918 (+/- 0.020)
recall: 0.831 (+/- 0.015)
f1_score: 0.855 (+/- 0.016)
roc_auc: 0.995 (+/- 0.000)
plot_cm(logp1_cm)
data = {
    'model': ['Baseline Logp1 PCA+RF', 'RandomWeights', '10M parameters', '106M parameters'],
    'f1_score_mean': [
        logp1_results['test_f1_score'][0],
        qa_results['test_f1_score'][0],
        results_10m['test_f1_score'][0],
        results_106M['test_f1_score'][0]
    ],
    'f1_score_std': [
        logp1_results['test_f1_score'][1],
        qa_results['test_f1_score'][1],
        results_10m['test_f1_score'][1],
        results_106M['test_f1_score'][1]
    ],
    'accuracy_mean': [
        logp1_results['test_accuracy'][0],
        qa_results['test_accuracy'][0],
        results_10m['test_accuracy'][0],
        results_106M['test_accuracy'][0]
    ],
    'accuracy_std': [
        logp1_results['test_accuracy'][1],
        qa_results['test_accuracy'][1],
        results_10m['test_accuracy'][1],
        results_106M['test_accuracy'][1]
    ]
}

df = pd.DataFrame(data)

fig, ax = pyplot.subplots(figsize=(10, 10))
# F1 Score plot
sb.barplot(x='model', y='f1_score_mean', data=df, capsize=0.2, palette='viridis', ax=ax)
ax.set_title('F1 Score Comparison')
ax.set_xlabel('Model')
ax.set_ylabel('F1 Score')
ax.set_yticks(np.arange(.5, 1.05, .05))
ax.set_ylim(.5, 1.0)
pyplot.savefig("F1-score-models.png")

# Accuracy plot
fig, ax = pyplot.subplots(figsize=(10, 10))
sb.barplot(x='model', y='accuracy_mean', data=df, ax=ax, capsize=0.2, palette='viridis')
ax.set_title('Accuracy Comparison')
ax.set_xlabel('Model')
ax.set_ylabel('Accuracy')
ax.set_yticks(np.arange(.5, 1.05, .05))
ax.set_ylim(.5, 1.0)
pyplot.savefig("average-accuracy-models.png")
/tmp/ipykernel_485848/421276470.py:33: FutureWarning:

Passing `palette` without assigning `hue` is deprecated and will be removed in v0.14.0. Assign the `x` variable to `hue` and set `legend=False` for the same effect.

  sb.barplot(x='model', y='f1_score_mean', data=df, capsize=0.2, palette='viridis', ax=ax)
/tmp/ipykernel_485848/421276470.py:43: FutureWarning:

Passing `palette` without assigning `hue` is deprecated and will be removed in v0.14.0. Assign the `x` variable to `hue` and set `legend=False` for the same effect.

  sb.barplot(x='model', y='accuracy_mean', data=df, ax=ax, capsize=0.2, palette='viridis')