Kubernetes#
Holoscan for Media is built on Kubernetes, which is the orchestration platform for deploying and managing containerized applications that can run on a centralized hardware infrastructure on-premises, in the cloud, or at the edge.
Kubernetes allows the development of cloud native applications. Training and documentation on Kubernetes can be found online through organizations such as KubeAcademy.
Red Hat OpenShift is the first target platform for Holoscan for Media to support customers in production but the platform is meant to be agnostic in terms of Kubernetes flavors and other Kubernetes distributions are planned.
This section does not replace proper training on Kubernetes, but is an attempt to list the basic principles and vocabulary.
Concepts#
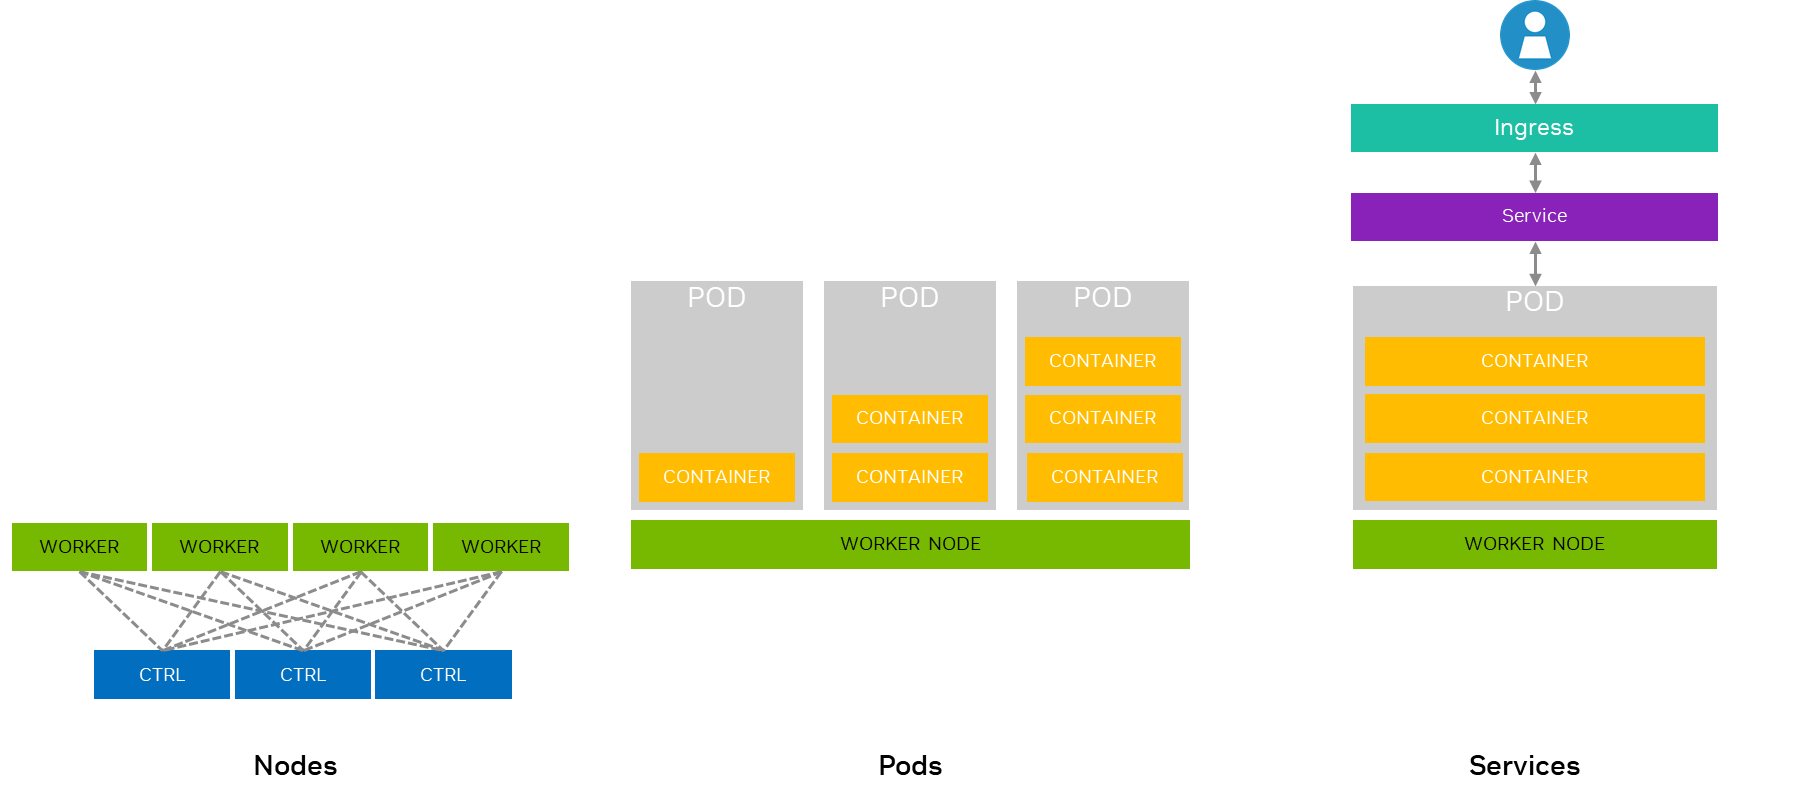
Node: A physical or virtual machine in a Kubernetes cluster that runs containerized applications.
Pod: The smallest deployable unit in Kubernetes, typically containing one or more containers that share resources and are scheduled together. Pods provide a degree of isolation from one another for security and reliability, so resources such as memory can only be shared between containers within the same pod.
Cluster: A set of nodes that run containerized applications managed by Kubernetes. Minimal deployments with Red Hat OpenShift are done with 3-node compact clusters, to allow for proper hardware redundancy and failover. A Kubernetes cluster consists of a Control Plane, the brain of Kubernetes that manages the cluster state, and Worker Nodes, running actual applications.
Service: An abstraction that defines a logical set of Pods and a policy to access them, enabling network connectivity to your applications.
HugePages#
HugePages are a memory management feature that improves the throughput of Direct Memory Access (DMA) by PCIe devices, enabling high-performance workloads such as RDMA and ST 2110 streaming. The system kernel reserves larger, contiguous chunks of memory and makes them available to applications that explicitly request them. Contiguous memory regions reduce the number of page table entries and allow DMA engines to access memory more efficiently, improving overall data transfer performance. The amounts reserved by the system and requested by applications might need to be adjusted, depending on available RAM and workload requirements.
Load Balancing#
Load balancing allows you to distribute services traffic among Pods, preventing overload and ensuring efficient resource usage. It is specifically recommended for:
High Availability to evenly distribute traffic and prevent server overload with minimal downtime.
Scalability to ensure efficient handling of increased traffic when adding or removing instances on demand.
Optimized Resource Utilization to evenly distribute requests across pods and maximize cluster efficiency.
Traffic Management to enable advanced deployment strategies, like routing traffic based on HTTP headers.
Fault Tolerance to detect and divert traffic from unhealthy pods, maintaining service availability in case of failures.
Operators#
Operators are software extensions to Kubernetes that automates deployment of resources to manage applications and their components.
The Holoscan for Media platform leverages the following operators:
Helm Charts#
Each developer application should be provided with an associated Helm chart with the recommended GPU and networking allocations required to ensure their software runs properly at scale in a Kubernetes cluster. Helm must be installed to use the charts (that is deployment templates).
Refer to Helm’s documentation to get
started. After Helm is set up properly, you can add any Helm repository
to search for existing charts and retrieve the latest versions of packages.
The chart repository that is part of the Holoscan for Media collection on NGC is
https://helm.ngc.nvidia.com/nvidia/holoscan-for-media.
The Holoscan for Media reference applications include Helm Dashboard, which provides a basic web UI for deployment of subsequent Helm charts to the cluster.
Deployments#
A Deployment defines the desired state for running applications, including which
container images to use and how many replicas to maintain. Deployment of Holoscan
for Media applications are done with Helm using the chart’s deployment.yaml and other
configuration files.
Deployments and other Kubernetes resources created by the Helm chart can use values
referenced in the chart’s values.yaml file which can be overwritten
at install in the Helm command. For example, values.yaml could include the following
reference:
myIPAddress: "192.168.1.100"
In the deployment.yaml file, this value can be accessed as follows:
spec:
    containers:
    - name: myapp
       env:
       - name: SERVER_IP
         value: {{ .Values.myIPAddress }}
When installing the chart, you can override this value through the command line or through the Helm Dashboard UI provided to developers:
helm install myrelease ./mychart --set myIPAddress=10.0.0.50
Namespaces#
A Namespace is a way to divide cluster resources between multiple users or projects. If you don’t assign any namespace, resources will be running in the default namespace.
ConfigMaps#
A ConfigMap stores non-sensitive configuration data in key-value pairs.
ConfigMaps can be updated without rebuilding the container image, making
configuration changes easier. You can create a ConfigMap myapp-config
this way:
apiVersion: v1
kind: ConfigMap
metadata:
  name: myapp-config
data:
  APP_COLOR: blue
  APP_MODE: prod
Verify that you have your ConfigMap when listing all ConfigMaps available
on the cluster. This ConfigMap can then be used in a Pod deployment.yaml as follows:
spec:
  containers:
  - name: myapp
    envFrom:
    - configMapRef:
        name: myapp-config
Secrets#
Secrets are objects similar to ConfigMaps but for storing sensitive information.
Secrets are used for passwords or API keys. We typically use them for Rivermax licensing or
any software licensing. This approach allows you to securely provide sensitive information
to your applications without hardcoding it or exposing it in your container images. They are not encrypted by default in etcd (Kubernetes’ data store).
You can create a Secret myapp-secret like this:
apiVersion: v1
kind: Secret
metadata:
  name: myapp-secret
type: Opaque
data:
  DB_PASSWORD: cGFzc3dvcmQ=  # base64 encoded "password"
Then the Kubernetes Secret can be used in a Pod:
spec:
  containers:
  - name: myapp
    env:
    - name: DATABASE_PASSWORD
      valueFrom:
        secretKeyRef:
          name: myapp-secret
          key: DB_PASSWORD
Persistent Volumes#
A Persistent Volume (PV) is a piece of storage in a Kubernetes cluster that has been provisioned either by an administrator or dynamically through a StorageClass. The Persistent Volume API defines two key resources:
PersistentVolume (PV): Represents the actual storage resource in the cluster. A PV object captures details of the storage implementation (such as local storage, NFS, iSCSI, or a cloud-provisioned volume). The lifecycle of a PV is independent of the Pods that use it.
PersistentVolumeClaim (PVC): A request for storage by a user. A PVC specifies desired characteristics such as size, access modes, and optionally a StorageClass. The cluster attempts to bind the PVC to a suitable PV. A PVC does not directly create a PV; rather, it claims an existing PV or triggers dynamic provisioning using a StorageClass. PVCs are to PVs what Pods are to Nodes: they abstract away the underlying resources and provide a consistent consumption model.
Access modes define how a volume can be mounted:
ReadWriteOnce (RWO): Mounted read/write by a single node.
ReadOnlyMany (ROX): Mounted read-only by many nodes.
ReadWriteMany (RWX): Mounted read/write by many nodes.
ReadWriteOncePod (RWOP): Mounted read/write by a single Pod.
For more details, see the Persistent Volume documentation.
Mounting ConfigMaps and Kubernetes Secrets as Volumes#
Both ConfigMaps and Secrets can be mounted as volumes. For example, to mount mysecret secret as
a volume, first create it using this content:
apiVersion: v1
kind: Secret
metadata:
  name: mysecret
type: Opaque
data:
  username: dXNlcm5hbWU=  # base64 encoded "username"
  password: cGFzc3dvcmQ=  # base64 encoded "password"
Then, mount this Kubernetes Secret as a volume in secret-test-pod pod as follows:
apiVersion: v1
kind: Pod
metadata:
  name: secret-test-pod
spec:
  containers:
  - name: test-container
    image: nginx
    volumeMounts:
    - name: secret-volume
      mountPath: /etc/secret-volume
      readOnly: true
  volumes:
  - name: secret-volume
    secret:
      secretName: mysecret
In this example, the Kubernetes Secret mysecret is defined with two key-value pairs. The pod
specification includes a volume named secret-volume that references the mysecret
secret. This volume is mounted to the container at the path /etc/secret-volume.
The container will see two files in /etc/secret-volume that contain the decoded secret value:
username
password
When the pod runs, the container can access the secret data as files:
/etc/secret-volume/username
/etc/secret-volume/password
The same philosophy can be used for ConfigMaps.
Ingress and Load Balancer#
Ingress: An API object that manages external access to services in a cluster, typically HTTP.
Load Balancer: Type of service that distributes network traffic across multiple pods in a cluster to services running within a Kubernetes cluster from external clients referred as north-south traffic. Load balancers operate at Layer 4 (TCP/UDP) and provide a single, stable IP address for external access while automatically distributing traffic across all pods of the target service.
Service Mesh#
Service Mesh is a dedicated infrastructure layer for managing, controlling, and observing communication between microservices in a distributed application architecture. They handle service-to-service communication inside the cluster between the different pods and nodes, often referred to as east-west traffic, in microservices-based applications. They typically consist of two main components:
Data plane: Composed of lightweight network proxies deployed as sidecars alongside each service instance.
Control plane: Manages and configures the proxies to route traffic.
Their role is to provide improved reliability and resilience, enhanced security with zero-trust networking, better visibility into service interactions, and simplified application code by offloading network logic. Service meshes intercept all network communication between services, allowing them to apply policies, collect metrics, and manage traffic without requiring changes to the application code.
Basic Commands#
kubectl is the command-line tool for interacting with the Kubernetes API to deploy.
In OpenShift environments, kubectl can be replaced by the oc command.
Cluster Connection#
kubectl is run from a jump node, which needs to be connected to the cluster.
For production deployments based on Red Hat, OpenShift requires
you to generate an OpenShift API token.
For Local Developer Setup using Cloud Native Stack, the Kubernetes configuration
file is stored in ~/.kube/config. It’s possible to connect to other clusters by copying the appropriate
configuration file from the desired cluster to the ~/.kube/config folder of your jump node.
Command completion for oc, kubectl and helm can be activated by adding the following in .bashrc of the jump node:
source <(oc completion bash)
source <(kubectl completion bash)
source <(helm completion bash)
Cluster Management#
Display endpoint information about the master and services in the cluster:
kubectl cluster-info
Get all namespaces in the cluster:
kubectl get namespaces
List the nodes and their roles in the cluster:
kubectl get nodes
Mark a node as unschedulable:
kubectl cordon node <node-name>
Mark node as schedulable:
kubectl uncordon node <node-name>
Drain a node in preparation for maintenance:
kubectl drain node <node-name>
Resource Management#
Resources are created using kubectl create and deleted using kubectl delete.
For example, here is how to create a ConfigMap:
kubectl create cm
You can access available resources using kubectl get.
For example, you can list all ConfigMaps available on the cluster using the following command:
kubectl get cm
List all pods on the cluster:
kubectl get pods -o=wide
List one or more deployments:
kubectl get deployment
List pods sorted by restart count:
kubectl get pods --sort-by='.status.containerStatuses[0].restartCount'
Get all running pods in the namespace:
kubectl get pods --field-selector=status.phase=Running
You can describe a specific resource using kubectl describe.
For example, you can display the detailed state of a pod:
kubectl describe pod <pod-name>
Display the detailed state of one or more deployments:
kubectl describe deployment <deployment-name>
List details about secrets:
kubectl describe secrets
Container Management#
Execute a command against a container in a pod:
kubectl exec -n <namespace> -c <container-name> <pod-name> -- <command> [args...]
The -n argument can be omitted for pods in the default namespace and the -c argument is only required for multi-container pods.
For most single-container pods, starting an interactive terminal session can be achieved using:
kubectl exec -it <pod-name> -- /bin/bash
Print the logs for a container in a pod:
kubectl logs -c <container-name> <pod-name>
Copy local file from a developer machine in a remote pod in a specific container:
kubectl cp <file-location-local-machine> <some-pod>:<target-folder-location> -c <specific-container>
Perform a rolling update (Kubernetes default), set the image of the container to a new version for a particular deployment:
kubectl set image deployment/<deployment-name> <container-name>=image:<new-image-version>
Tools#
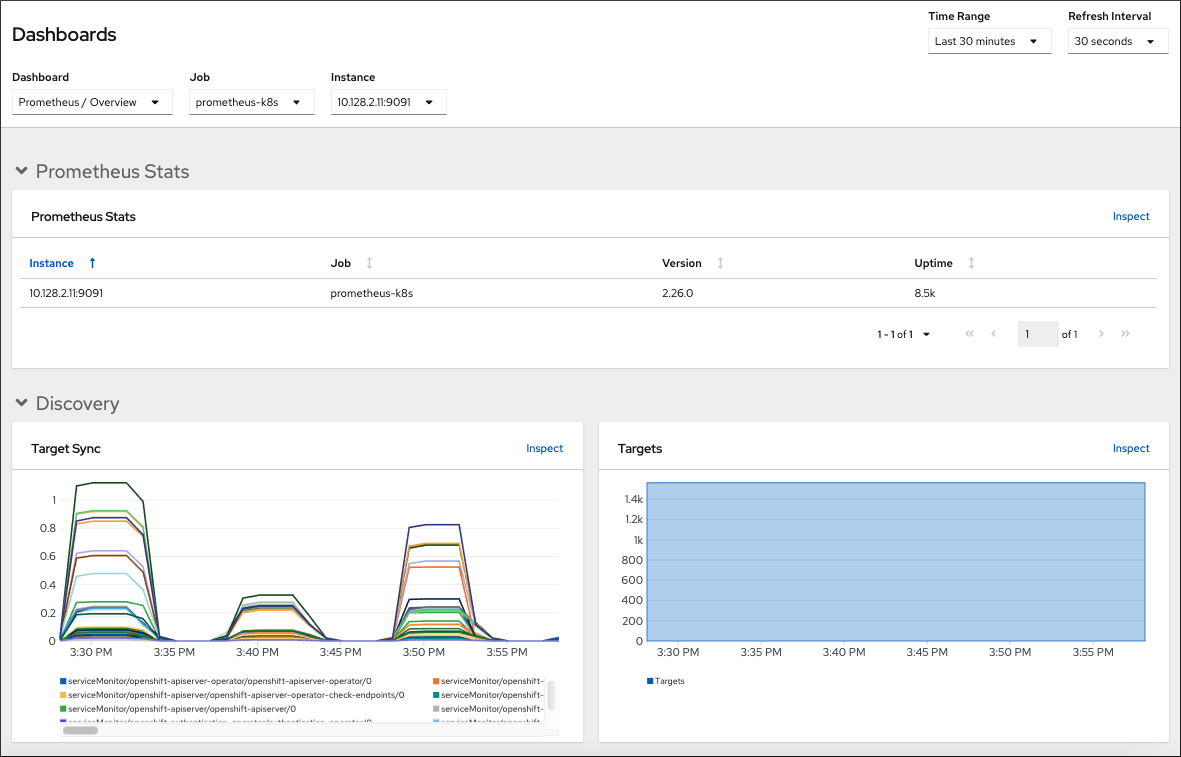
Dashboard#
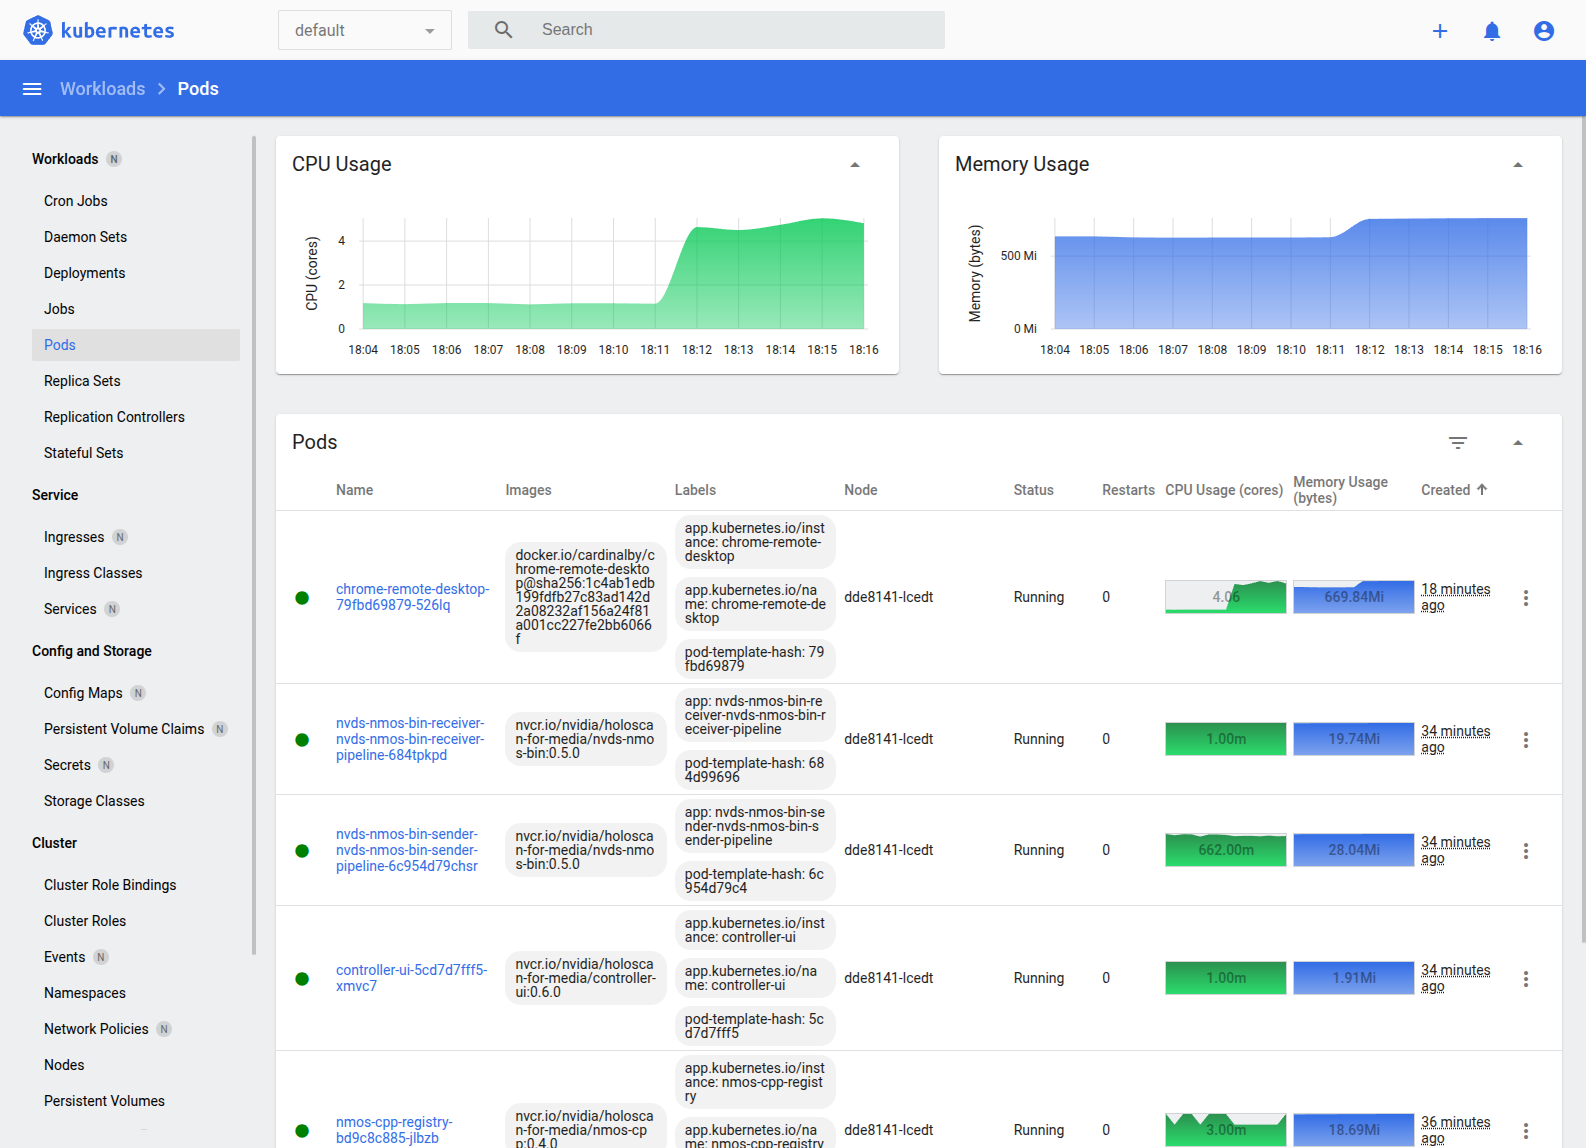
Web dashboards are available to monitor status of your cluster. These dashboards are typically a good first approach to understanding a Kubernetes cluster. For developers new to this technology, it provides visual access to all cluster components and resources. For a production deployment based on Red Hat OpenShift, the OpenShift Web Console provides monitoring capabilities for each of your pods, including hardware usage and possible warning or errors.
For a Local Developer Setup using Cloud Native Stack, the Kubernetes dashboard can be installed on your Ubuntu machine. Refer to Kubernetes Web UI Dashboard for more details.
K9s#
K9s
is an open-source tool providing a basic user interface that wraps around
kubectl commands. This allows you to monitor the status of your Kubernetes
cluster, check the logs, or even exec into a container with a friendly interface.
Install k9s using the following commands:
wget https://github.com/derailed/k9s/releases/latest/download/k9s_linux_amd64.deb
sudo apt install ./k9s_linux_amd64.deb
rm k9s_linux_amd64.deb
Verify the installation:
k9s version
____ __ ________
| |/ / __ \______
| /\____ / ___/
| \ \ / /\___ \
|____|\__ \/____//____ /
\/ \/
Version: v0.40.5
Commit: af8aa5fc41b3db202941a264a3011f490bede97b
Date: 2025-02-18T15:51:42Z
To launch k9s:
k9s
This opens the interactive UI showing running pods in the default namespace. After you are
in the k9s UI, you can access the different kubectl commands with a contextual menu.
Access node description:
:nodes
List pods:
:pods
Deployments:
:deployment
Services:
:svc
Replica sets:
:replicaset
NetworkAttachmentDefinition custom resource definition:
:net-attach-def
Persistent volumes:
:pv
Persistent Volume Claims:
:pvc
For each command, a different contextual menu appears. For example, see the following screenshot of the pods screen, where Ctrl+D can be used to delete a pod and S can be used to SSH into a pod.
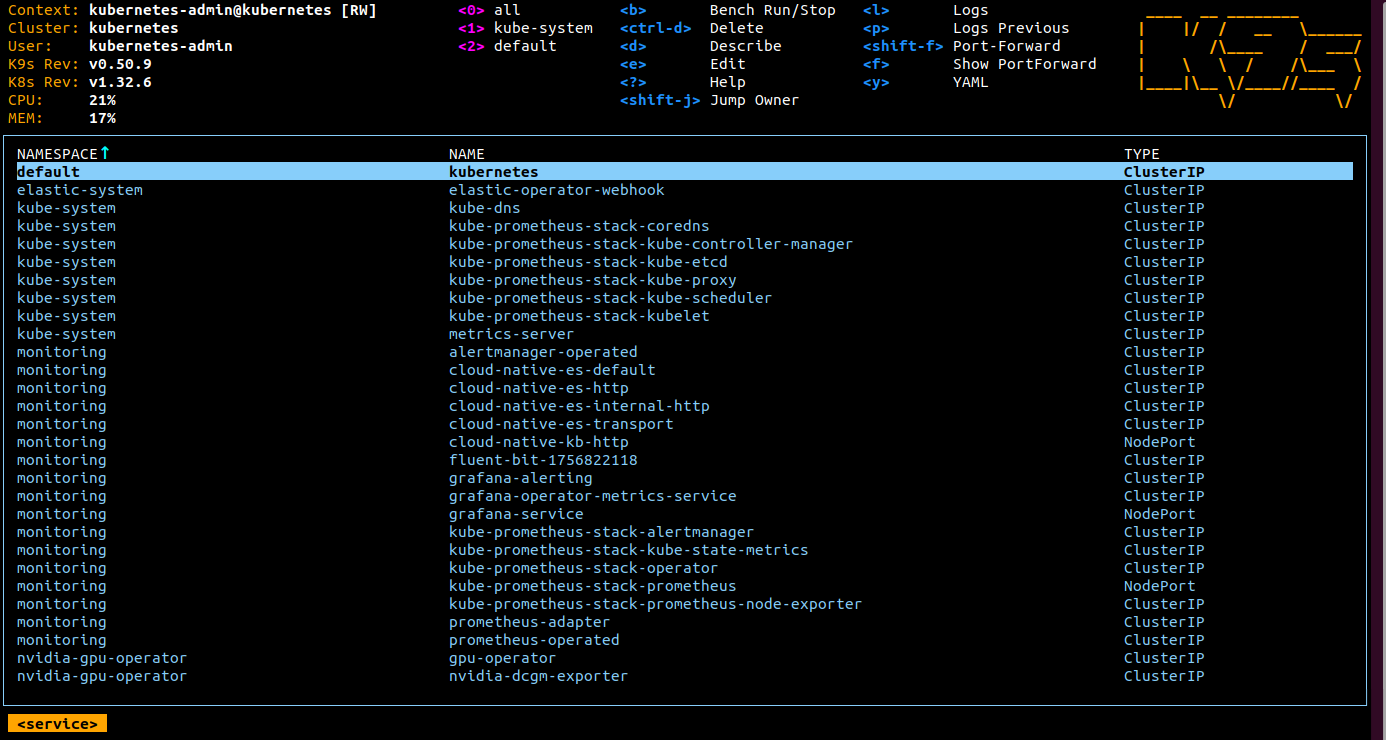
For a list of commands, refer to the k9s documentation.
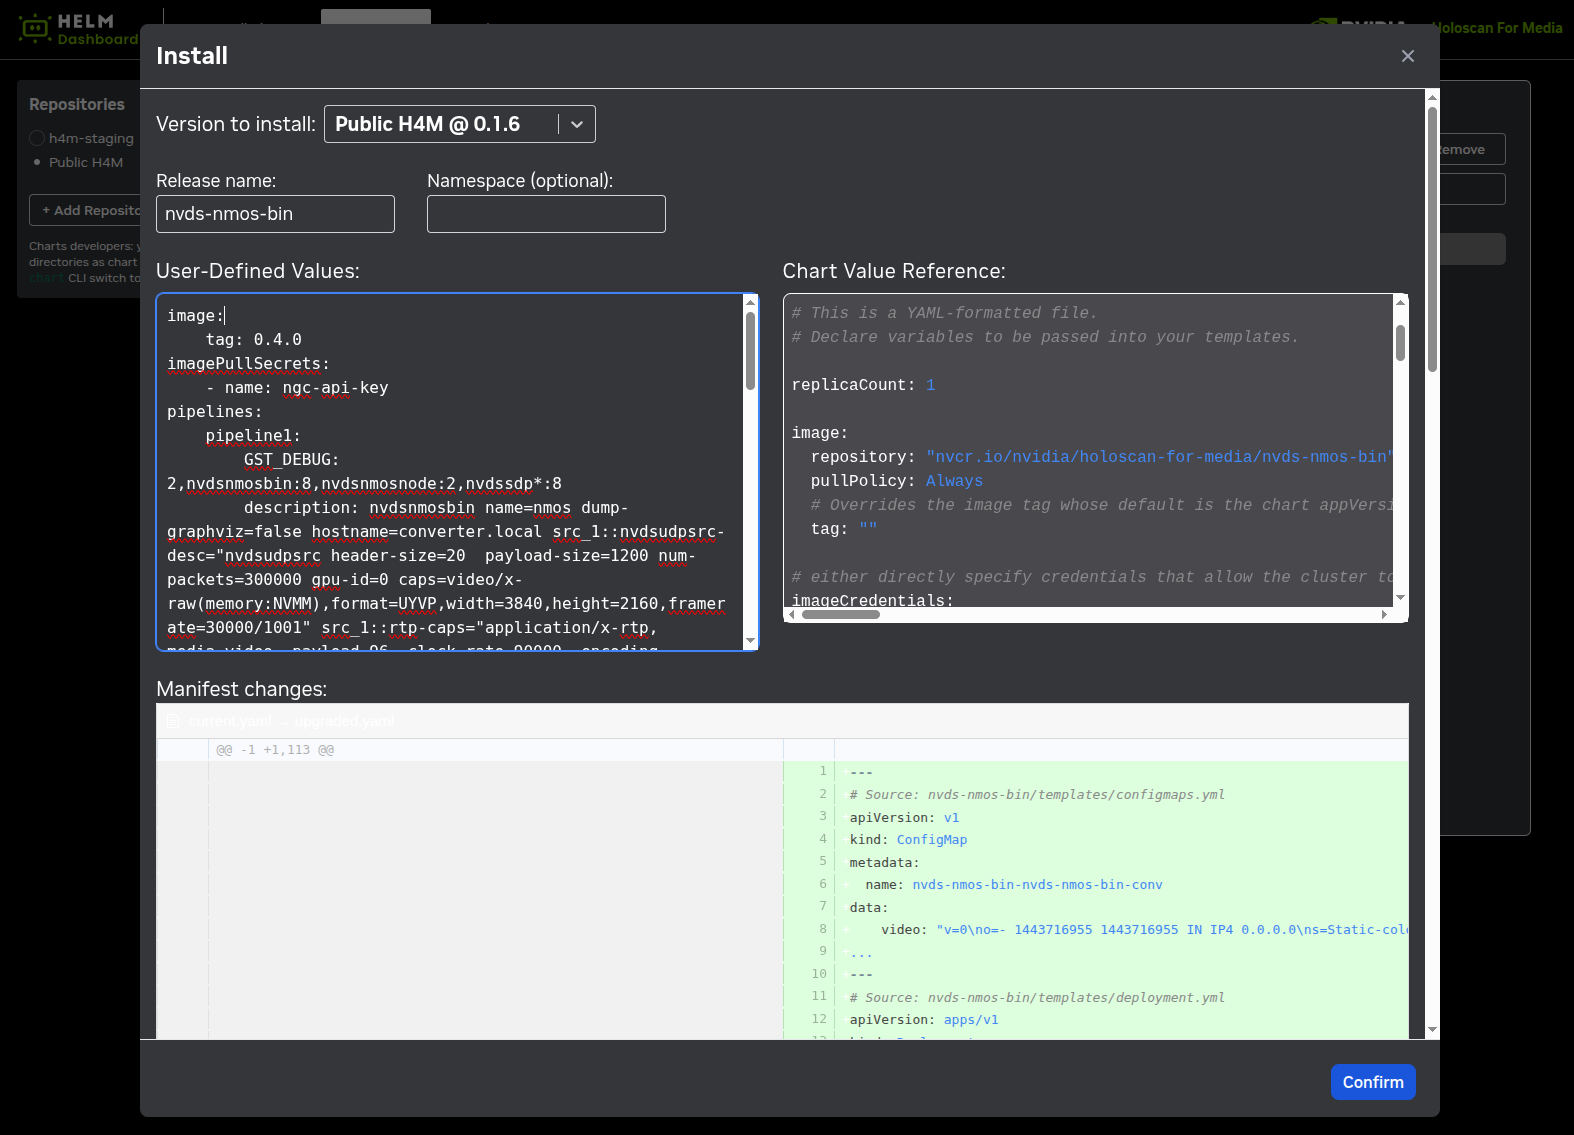
Helm Dashboard#
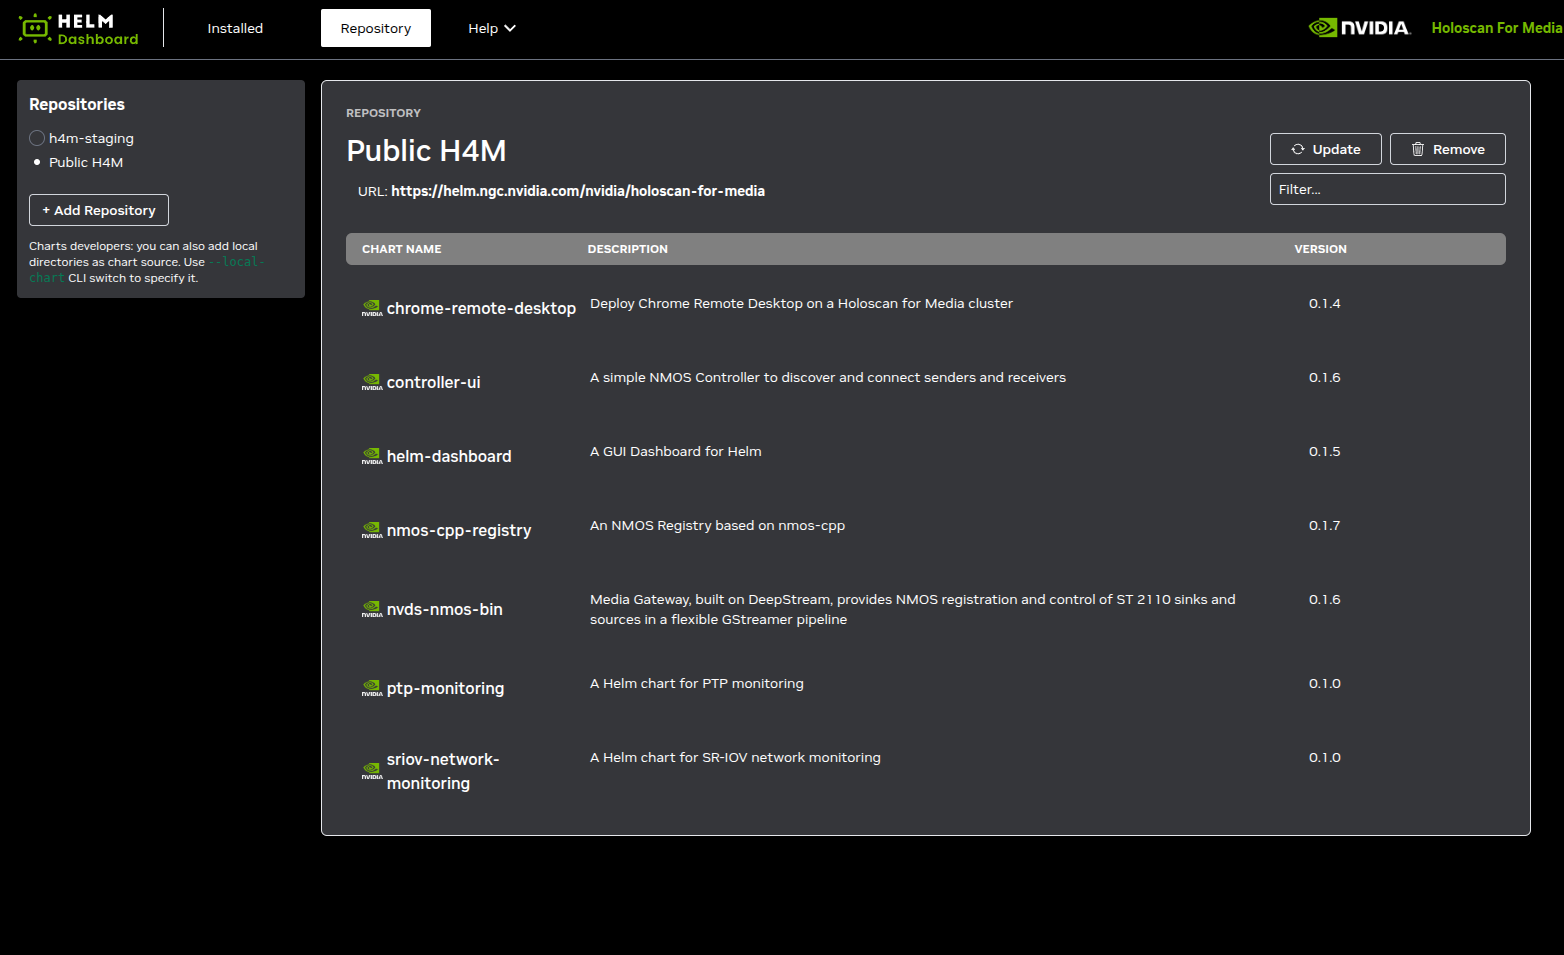
Holoscan for Media tools include Helm Dashboard, which provides
a basic web UI for deployment of subsequent Helm charts to the cluster, based on Komodor’s Helm Dashboard project.
The web UI allows to add software repositories to load software from, such as http://helm.ngc.nvidia.com/nvidia/holoscan-for-media
or any private repositories.
A view is dedicated to installed pods.
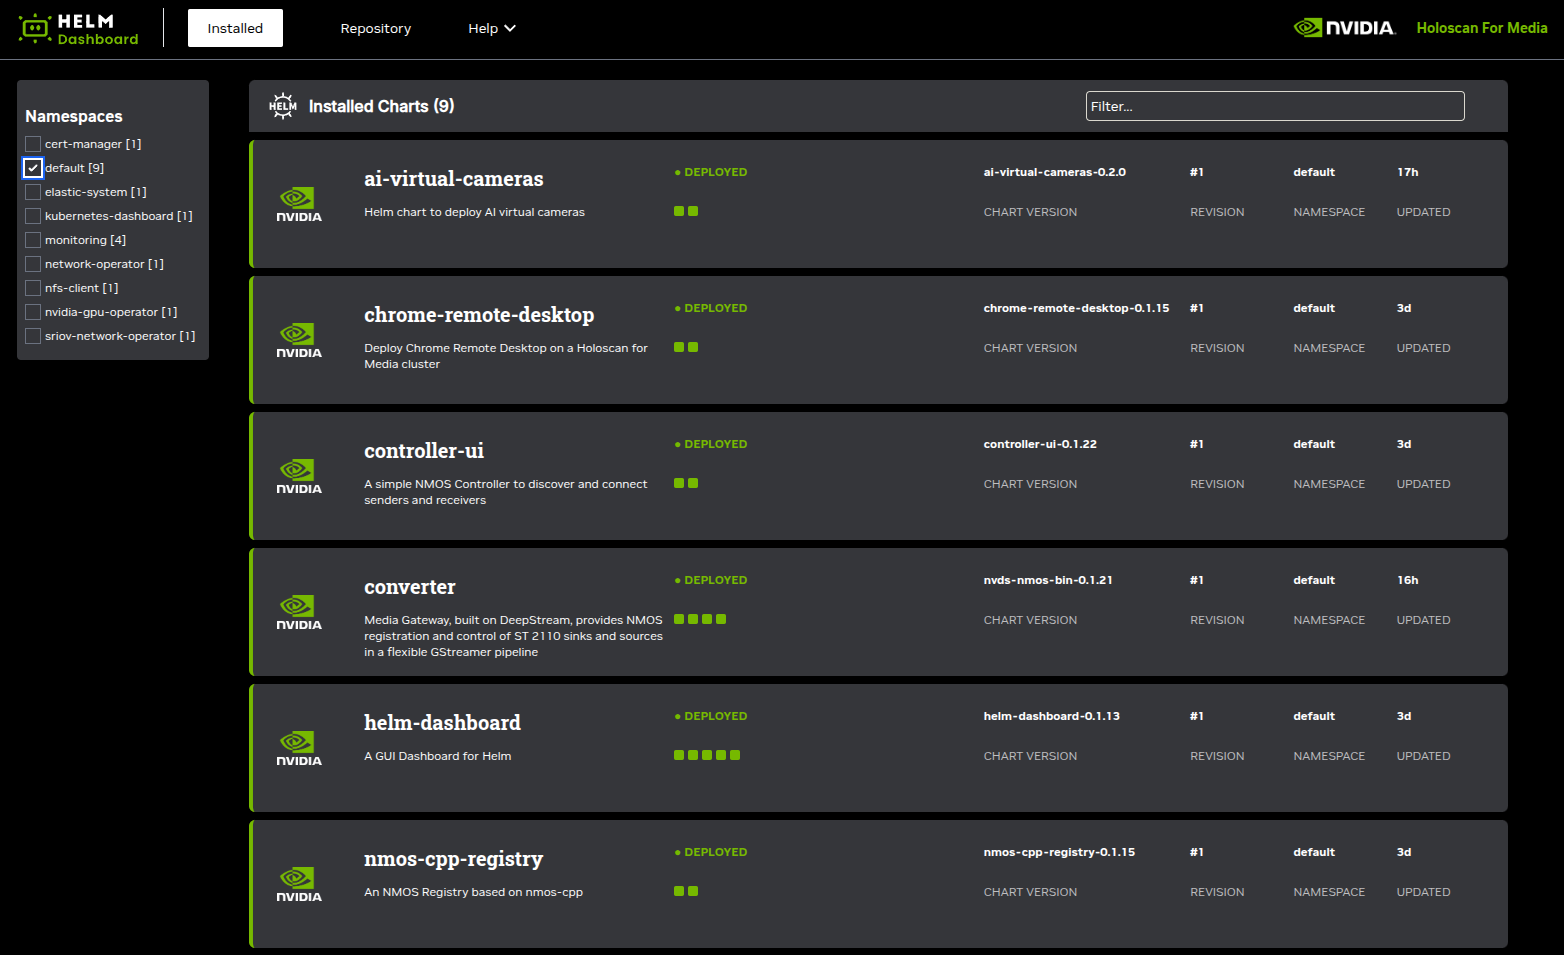
After clicking the name of a pod, its configuration can be changed using the visual interface instead of Helm command line interface.