Platform Monitoring#
This section provides instructions for enabling monitoring and installing dashboards for GPU, SR-IOV network, PTP, and NMOS Registry metrics. These monitoring components help track system performance, troubleshoot issues, and verify the platform runs reliably.
Before proceeding, make sure the monitoring stack itself is installed and running:
For the local developer setup, the monitoring stack is installed by default, unless you disabled it in the
config.yamlfile when using the automated installation or in the Cloud Native Stack values file when following the manual setup.Access Grafana at
http://<node-ip>:32222using the credentialsadmin/cns-stack.To retrieve the node IP, run the following command and replace
<node-ip>in the URL with the actual IP:kubectl get nodes -o jsonpath='{range .items[*]}{.status.addresses[?(@.type=="InternalIP")].address}{"\n"}{end}'
For the production setup, the automated installation includes the monitoring stack. If you are following the manual setup instructions, ensure that User Workload Monitoring is enabled.
Access Grafana at
http://<grafana-route-hostname>using the credentials specified in thecustom-vars.yamlfile located in the configuration directory (default credentials areh4m/grafana).To retrieve the Grafana route hostname, run the following command and replace
<grafana-route-hostname>in the URL with the actual hostname:oc -n openshift-user-workload-monitoring get route grafana -o jsonpath='{.spec.host}'
Attention
If you did the platform setup using the automation, the dashboards described in this section will be automatically deployed and available in Grafana.
GPU Monitoring#
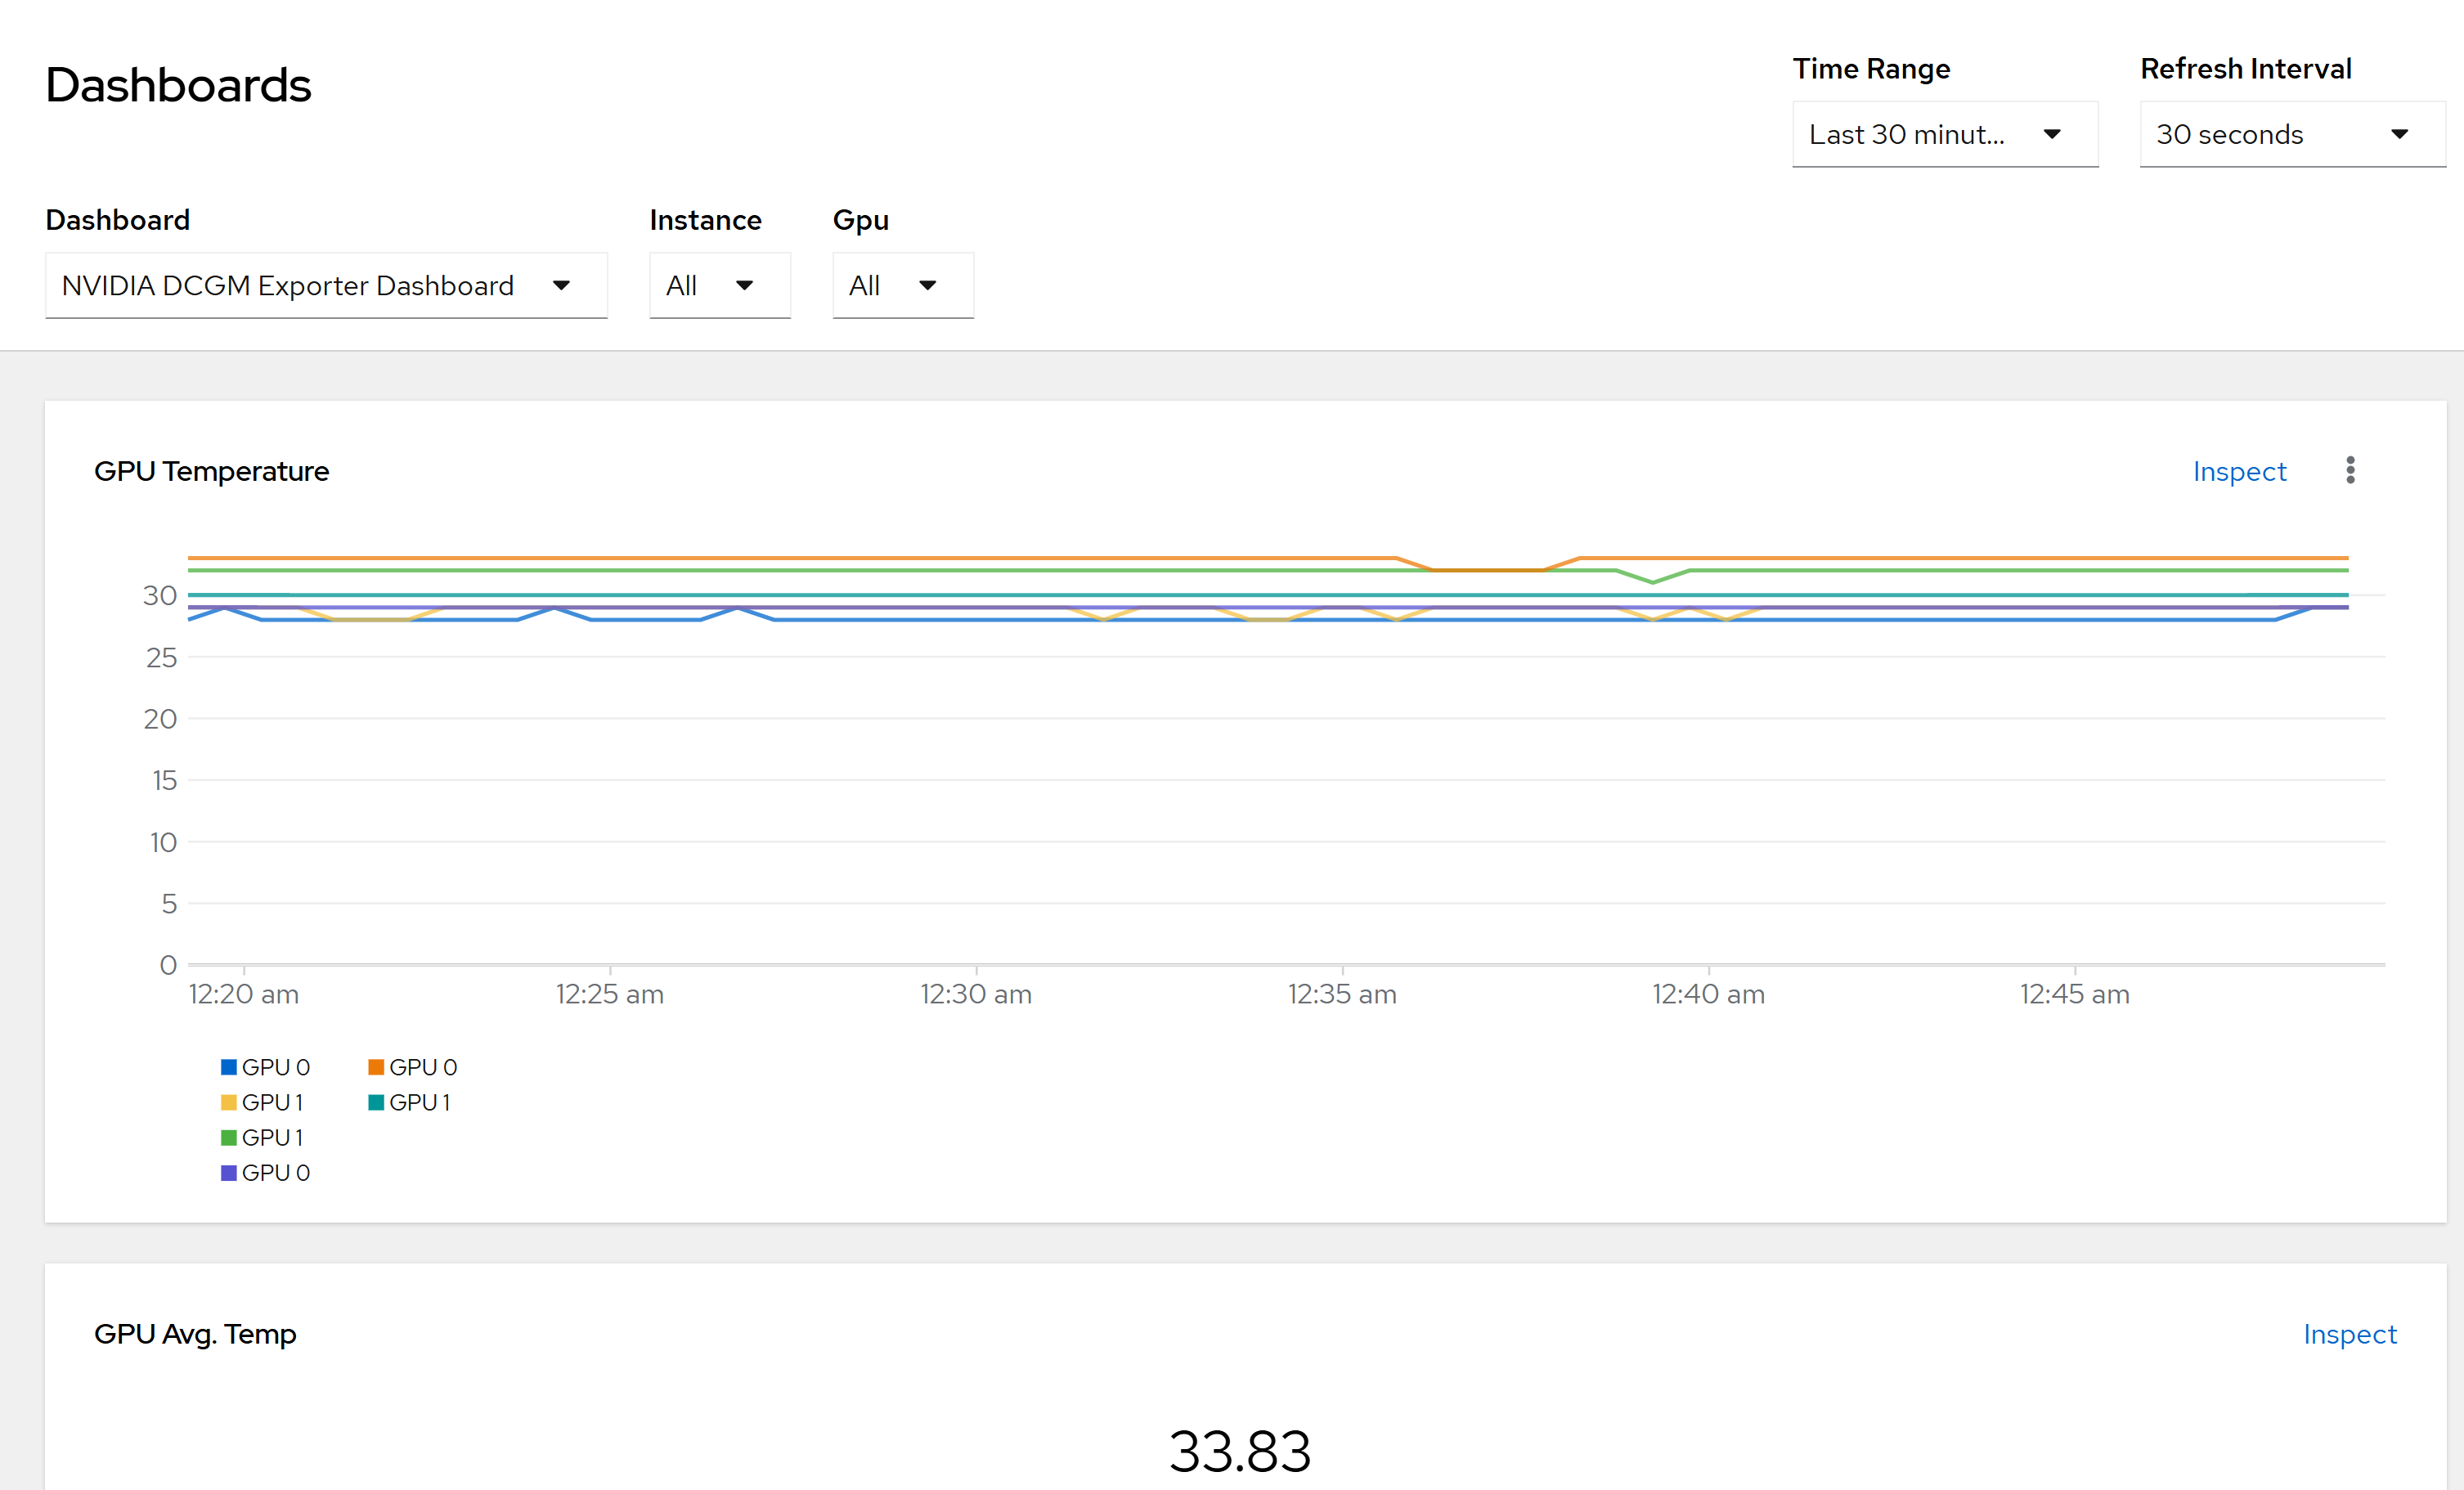
The Data Center GPU Manager (DCGM) dashboard monitors GPU performance and health.
For the local developer setup, the DCGM dashboard is already installed and visible in Grafana. For the production setup, follow the below instructions:
Create a GrafanaDashboard with the following content in the
dcgm-dashboard.yamlfile:apiVersion: grafana.integreatly.org/v1beta1 kind: GrafanaDashboard metadata: name: nvidia-dcgm-exporter-dashboard namespace: nvidia-gpu-operator spec: instanceSelector: matchLabels: dashboards: grafana resyncPeriod: 5s allowCrossNamespaceImport: true url: https://raw.githubusercontent.com/NVIDIA/dcgm-exporter/main/grafana/dcgm-exporter-dashboard.json
Apply the GrafanaDashboard:
oc apply -f dcgm-dashboard.yaml
SR-IOV Network Monitoring#
The SR-IOV network dashboard is a critical monitoring dashboard. Because our application pods run on high-speed networks, implementing this monitoring helps to track the performance of pods using SR-IOV VFs and ensures that they are meeting expected throughput levels.
To set it up, follow the SR-IOV Network Monitoring Helm Chart guide or deploy the sriov-network-monitoring Helm chart from the Helm Dashboard using the following values.yaml:
# Default values for sriov-network-monitoring.
# This is a YAML-formatted file.
# Declare variables to be passed into your templates.

metricsExporter:
  image:
    tag: v1.1.1
  # Must be set to 'v1' or 'v2' based on the cgroup version of the system
  cgroup: "" # Run "stat -fc %T /sys/fs/cgroup/", if it returns "tmpfs", cgroup is v1, if it returns "cgroup2fs", cgroup is v2.
To determine the cgroup version, run the following command on the cluster node where the SR-IOV network is deployed:
stat -fc %T /sys/fs/cgroup/
If it returns
tmpfs, cgroup isv1, if it returnscgroup2fs, cgroup isv2.Important
Make sure to run the above command on the cluster node, not on the jump node. In a production setup, you can access the cluster node in debug mode by running the following command from the jump node:
oc debug node/<node-name>
chroot /host
After deploying the Helm chart, you can check the status of the pods by running the following command:
kubectl get pods
NAME                                                              READY   STATUS             RESTARTS   AGE
sriov-network-sriov-network-monitoring-d98vl                      1/1     Running            0          5m
sriov-network-sriov-network-monitoring-gpffx                      1/1     Running            0          5m
sriov-network-sriov-network-monitoring-ql82b                      1/1     Running            0          5m
Note
The number of pods will be the same as the number of worker nodes.
The SR-IOV Network Dashboard will take one to two minutes to start showing the metrics.
If the pods do not reach the
Runningstatus, describe the pod to check for errors. If you see the following error:Warning FailedMount 1s (x6 over 16s) kubelet MountVolume.SetUp failed for volume "kubecgroup" : hostPath type check failed: /sys/fs/cgroup/kubepods.slice/ is not a directory
See the
kubepods.sliceservice status using the following command:sudo systemctl status kubepods.slice
If it is not active, start it with:
sudo systemctl start kubepods.slice
After it is installed, the SR-IOV Network Dashboard will be visible in Grafana.
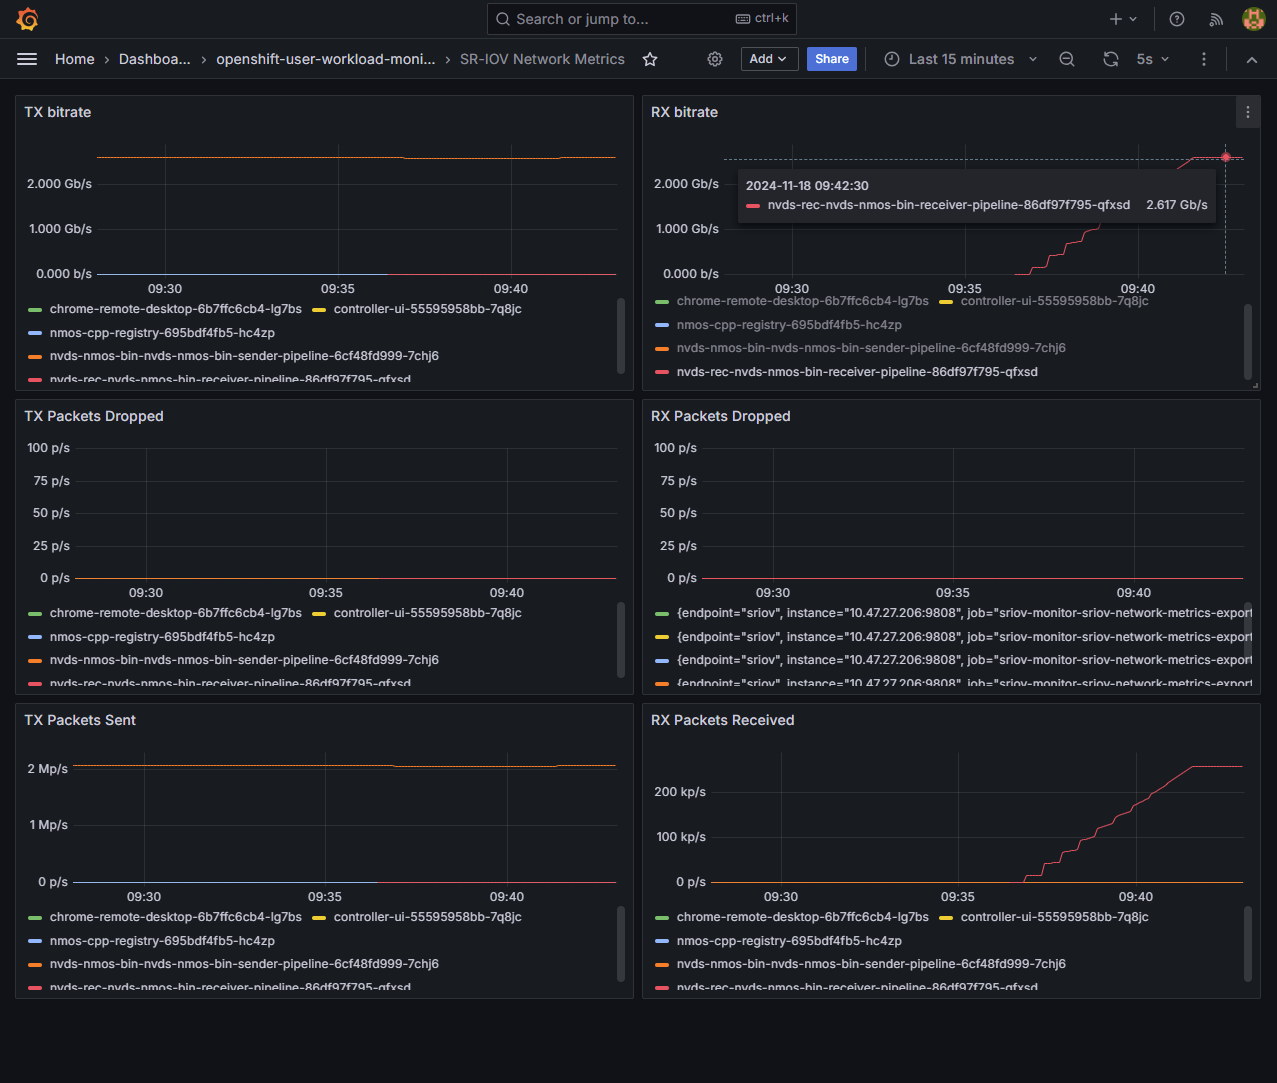
The dashboard displays key metrics like TX/RX rate, packets sent, received, and dropped, all tied directly to the pods using the VFs. These metrics allow us to monitor performance and troubleshoot any issues.
PTP Monitoring#
PTP is crucial to ensure time synchronization and ST 2110 compliance.
To set up monitoring of PTP metrics, follow the PTP Monitoring Helm Chart guide.
Note
This Helm chart is only supported for the production setup.
After it is installed, the PTP Dashboard will be visible in Grafana.
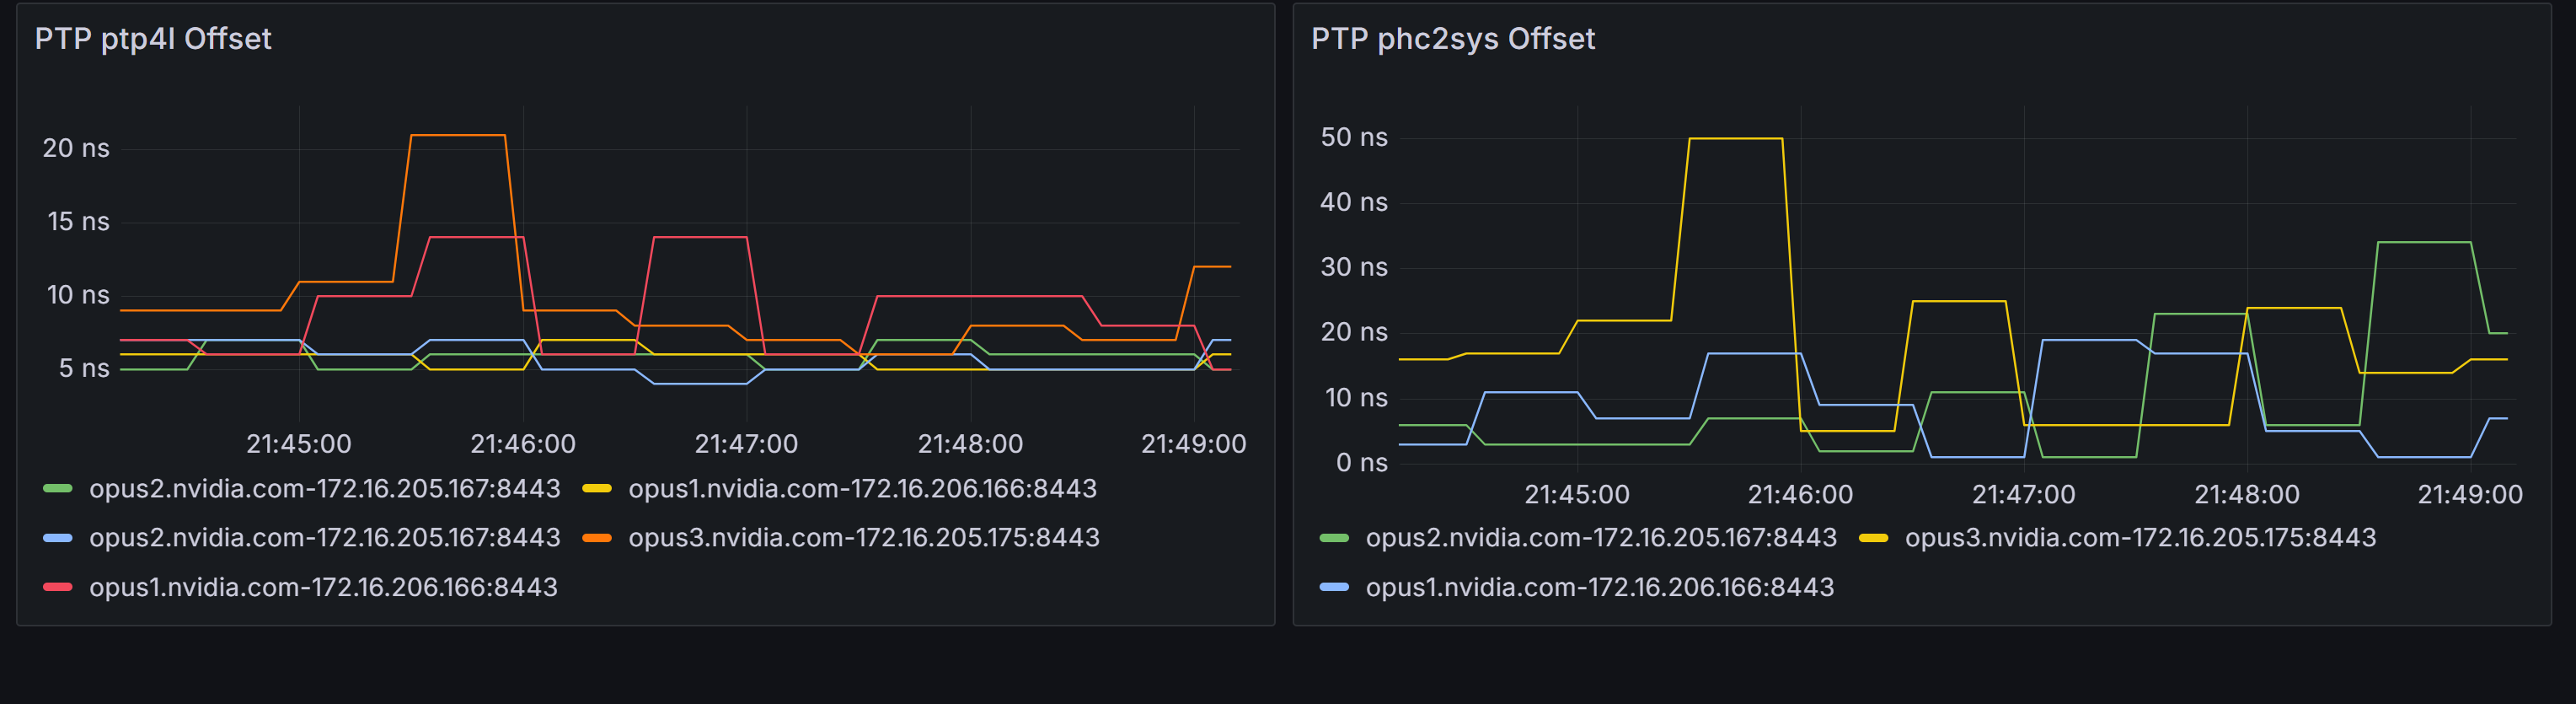
The dashboard displays two key metrics:
NIC-Switch Synchronization (ptp4l)
NIC-System Clock Synchronization (phc2sys)
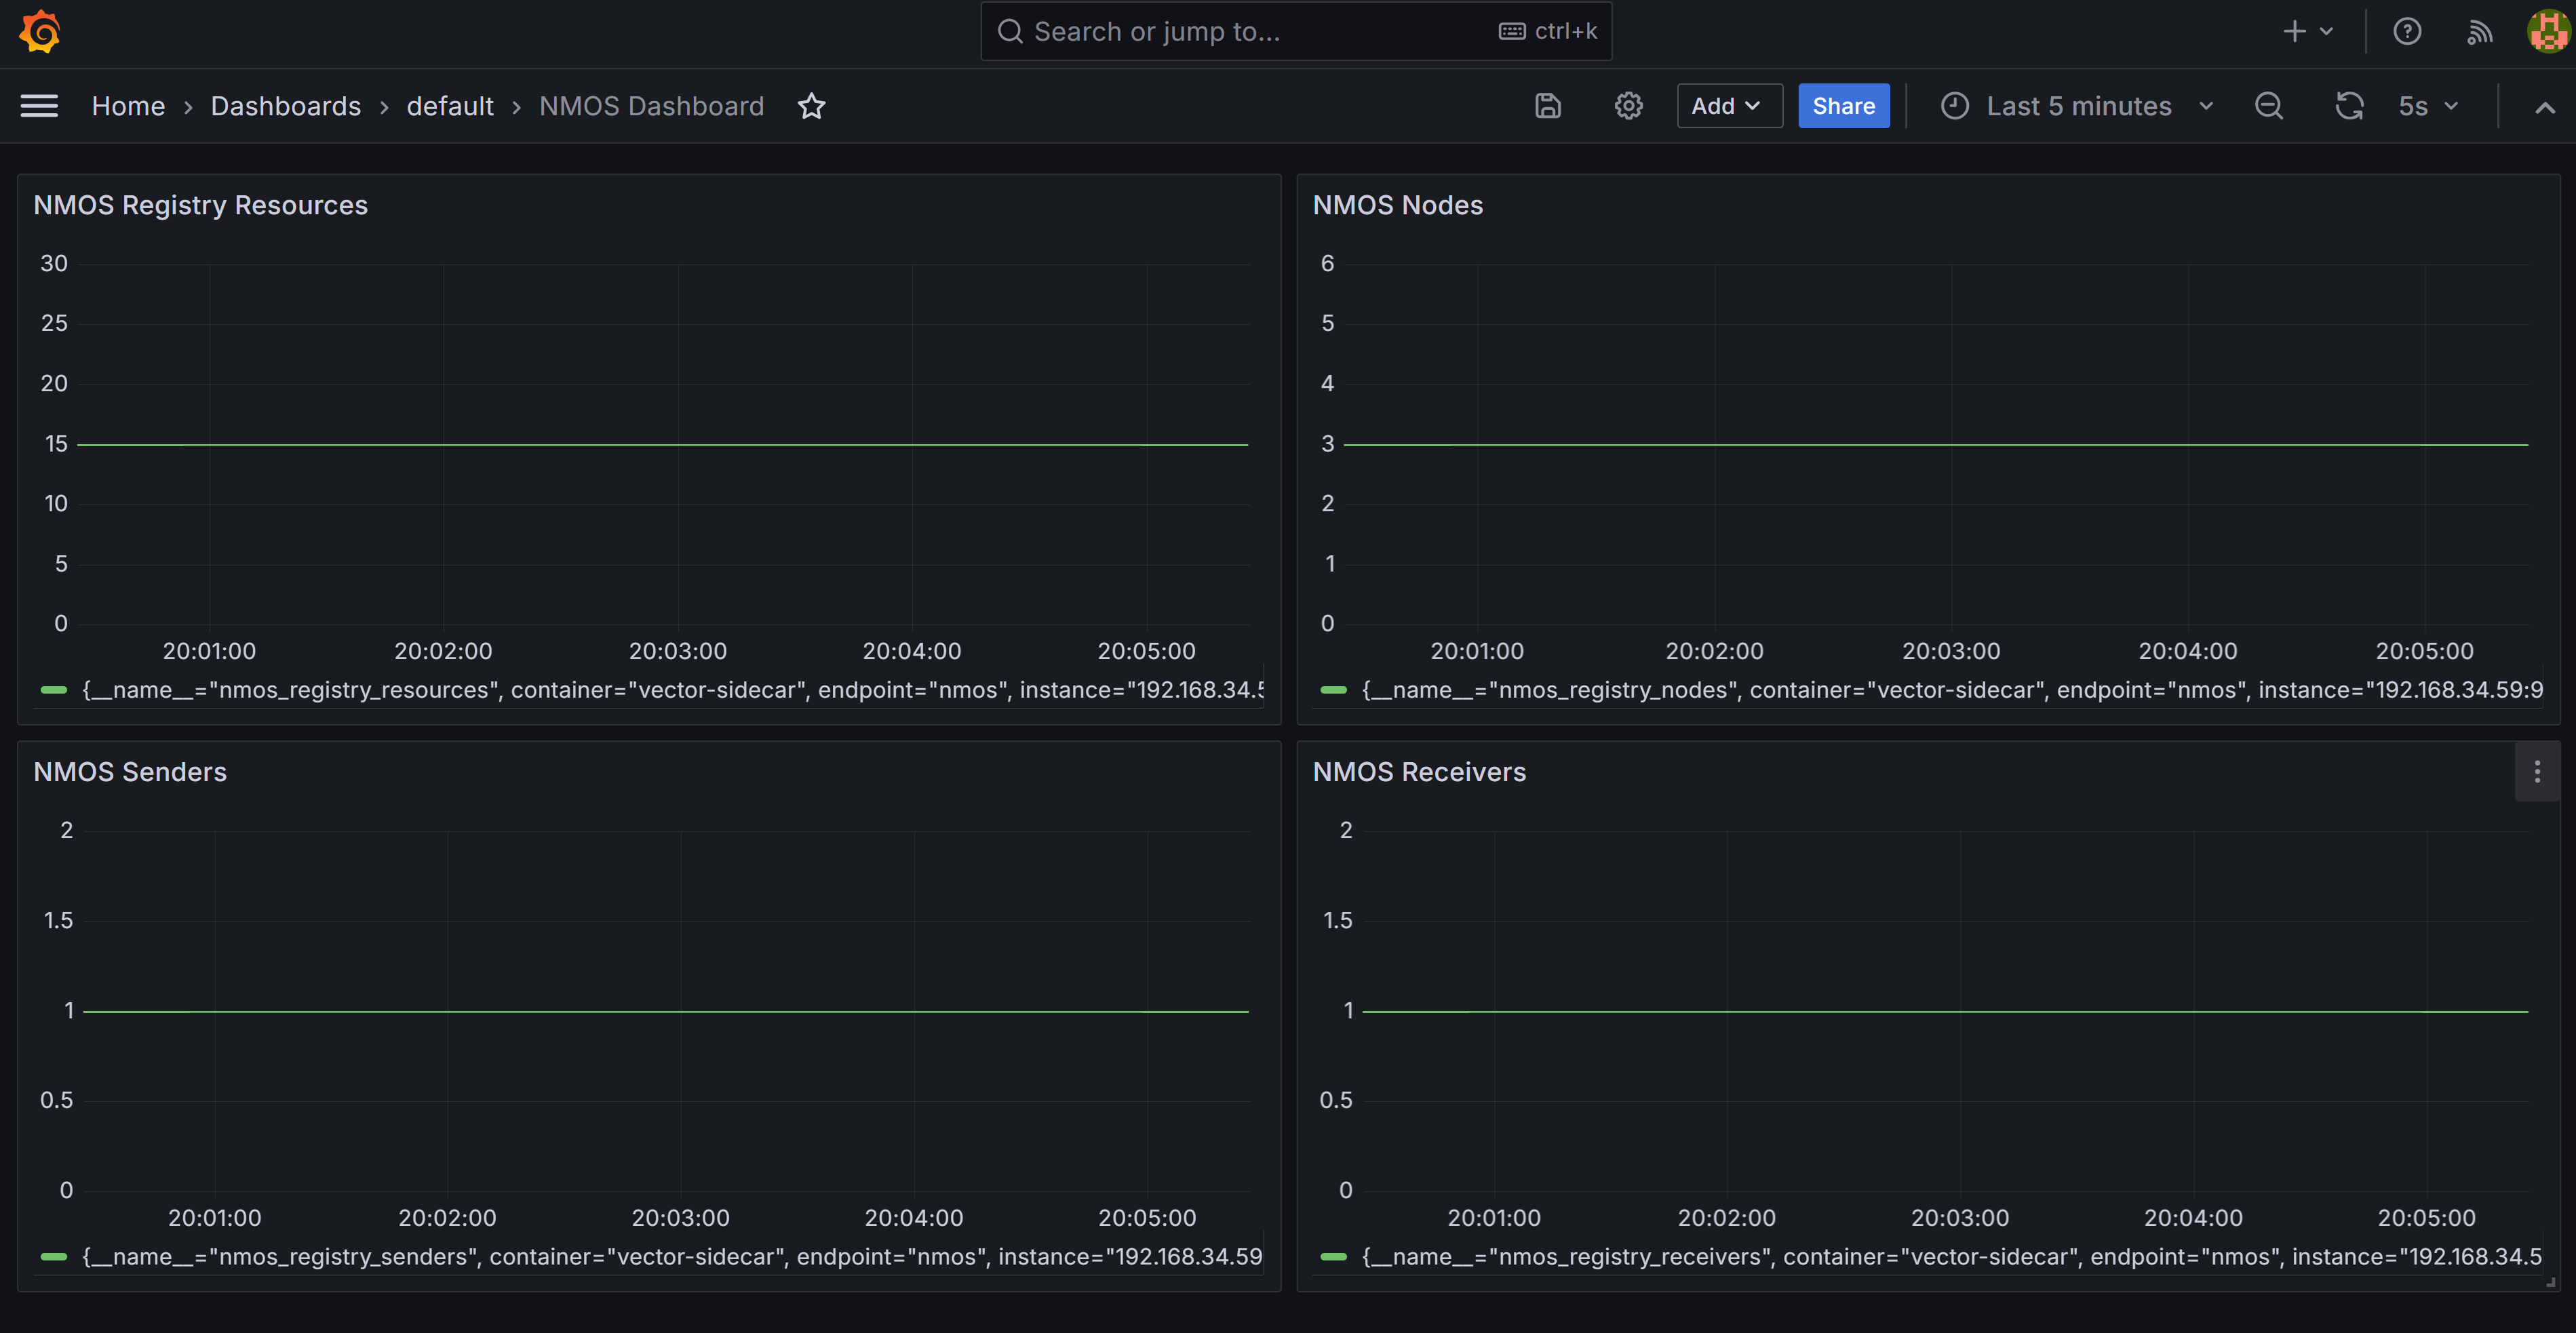
NMOS Registry Monitoring#
NMOS Registry Dashboard displays the number of NMOS-enabled nodes, senders, and receivers registered in the reference NMOS Registry.
To set it up, follow the NMOS Registry Helm chart guide or deploy the Helm chart from the Helm Dashboard, adjusting the values.yaml to set prometheusExporter.enabled to true as follows:
# Enable Log Exporter to Prometheus
prometheusExporter:
  enabled: true
  error_log: /logs/vector.txt # Error log must be in logs directory to be shared with vector sidecar containers
After it is installed, the NMOS Dashboard will be visible in Grafana.