Additional Services#
This section covers setting up a monitoring solution for user workloads, and installation of several useful services like Longhorn, MetalLB, and Istio. Longhorn is a lightweight, reliable and easy-to-use distributed block storage system for Kubernetes. MetalLB is a load balancer implementation for bare-metal clusters, using standard routing protocols. Istio provides capabilities like observability, traffic management, and security.
Prerequisites#
Install Helm on the jump node. Instructions to install Helm based on the given operating system are documented at Helm Install.
User Workload Monitoring Setup#
OpenShift provides a built-in monitoring stack based on Prometheus, Thanos and Alertmanager that can be enabled for user-defined projects, but it does not allow the addition of custom Grafana Dashboards in the OpenShift console. To address this, we will integrate Grafana with the existing OpenShift monitoring stack, to enable custom Grafana Dashboards to be created that use OpenShift’s Prometheus instance as a data source.
Enable User Workload Monitoring#
Create a ConfigMap with the following content in the
monitoring-config.yamlfile:apiVersion: v1 kind: ConfigMap metadata: name: cluster-monitoring-config namespace: openshift-monitoring data: config.yaml: | enableUserWorkload: true
Apply the ConfigMap:
oc apply -f monitoring-config.yaml
Ensure that all pods in the
openshift-user-workload-monitoringnamespace haveReadystatus:oc get pods -n openshift-user-workload-monitoring
NAME                                   READY   STATUS    RESTARTS   AGE
prometheus-operator-56fbfd68d6-vv874   2/2     Running   0          2m35s
prometheus-user-workload-0             6/6     Running   0          2m28s
prometheus-user-workload-1             6/6     Running   0          2m28s
thanos-ruler-user-workload-0           4/4     Running   0          2m28s
thanos-ruler-user-workload-1           4/4     Running   0          2m28s
Installing Grafana Operator#
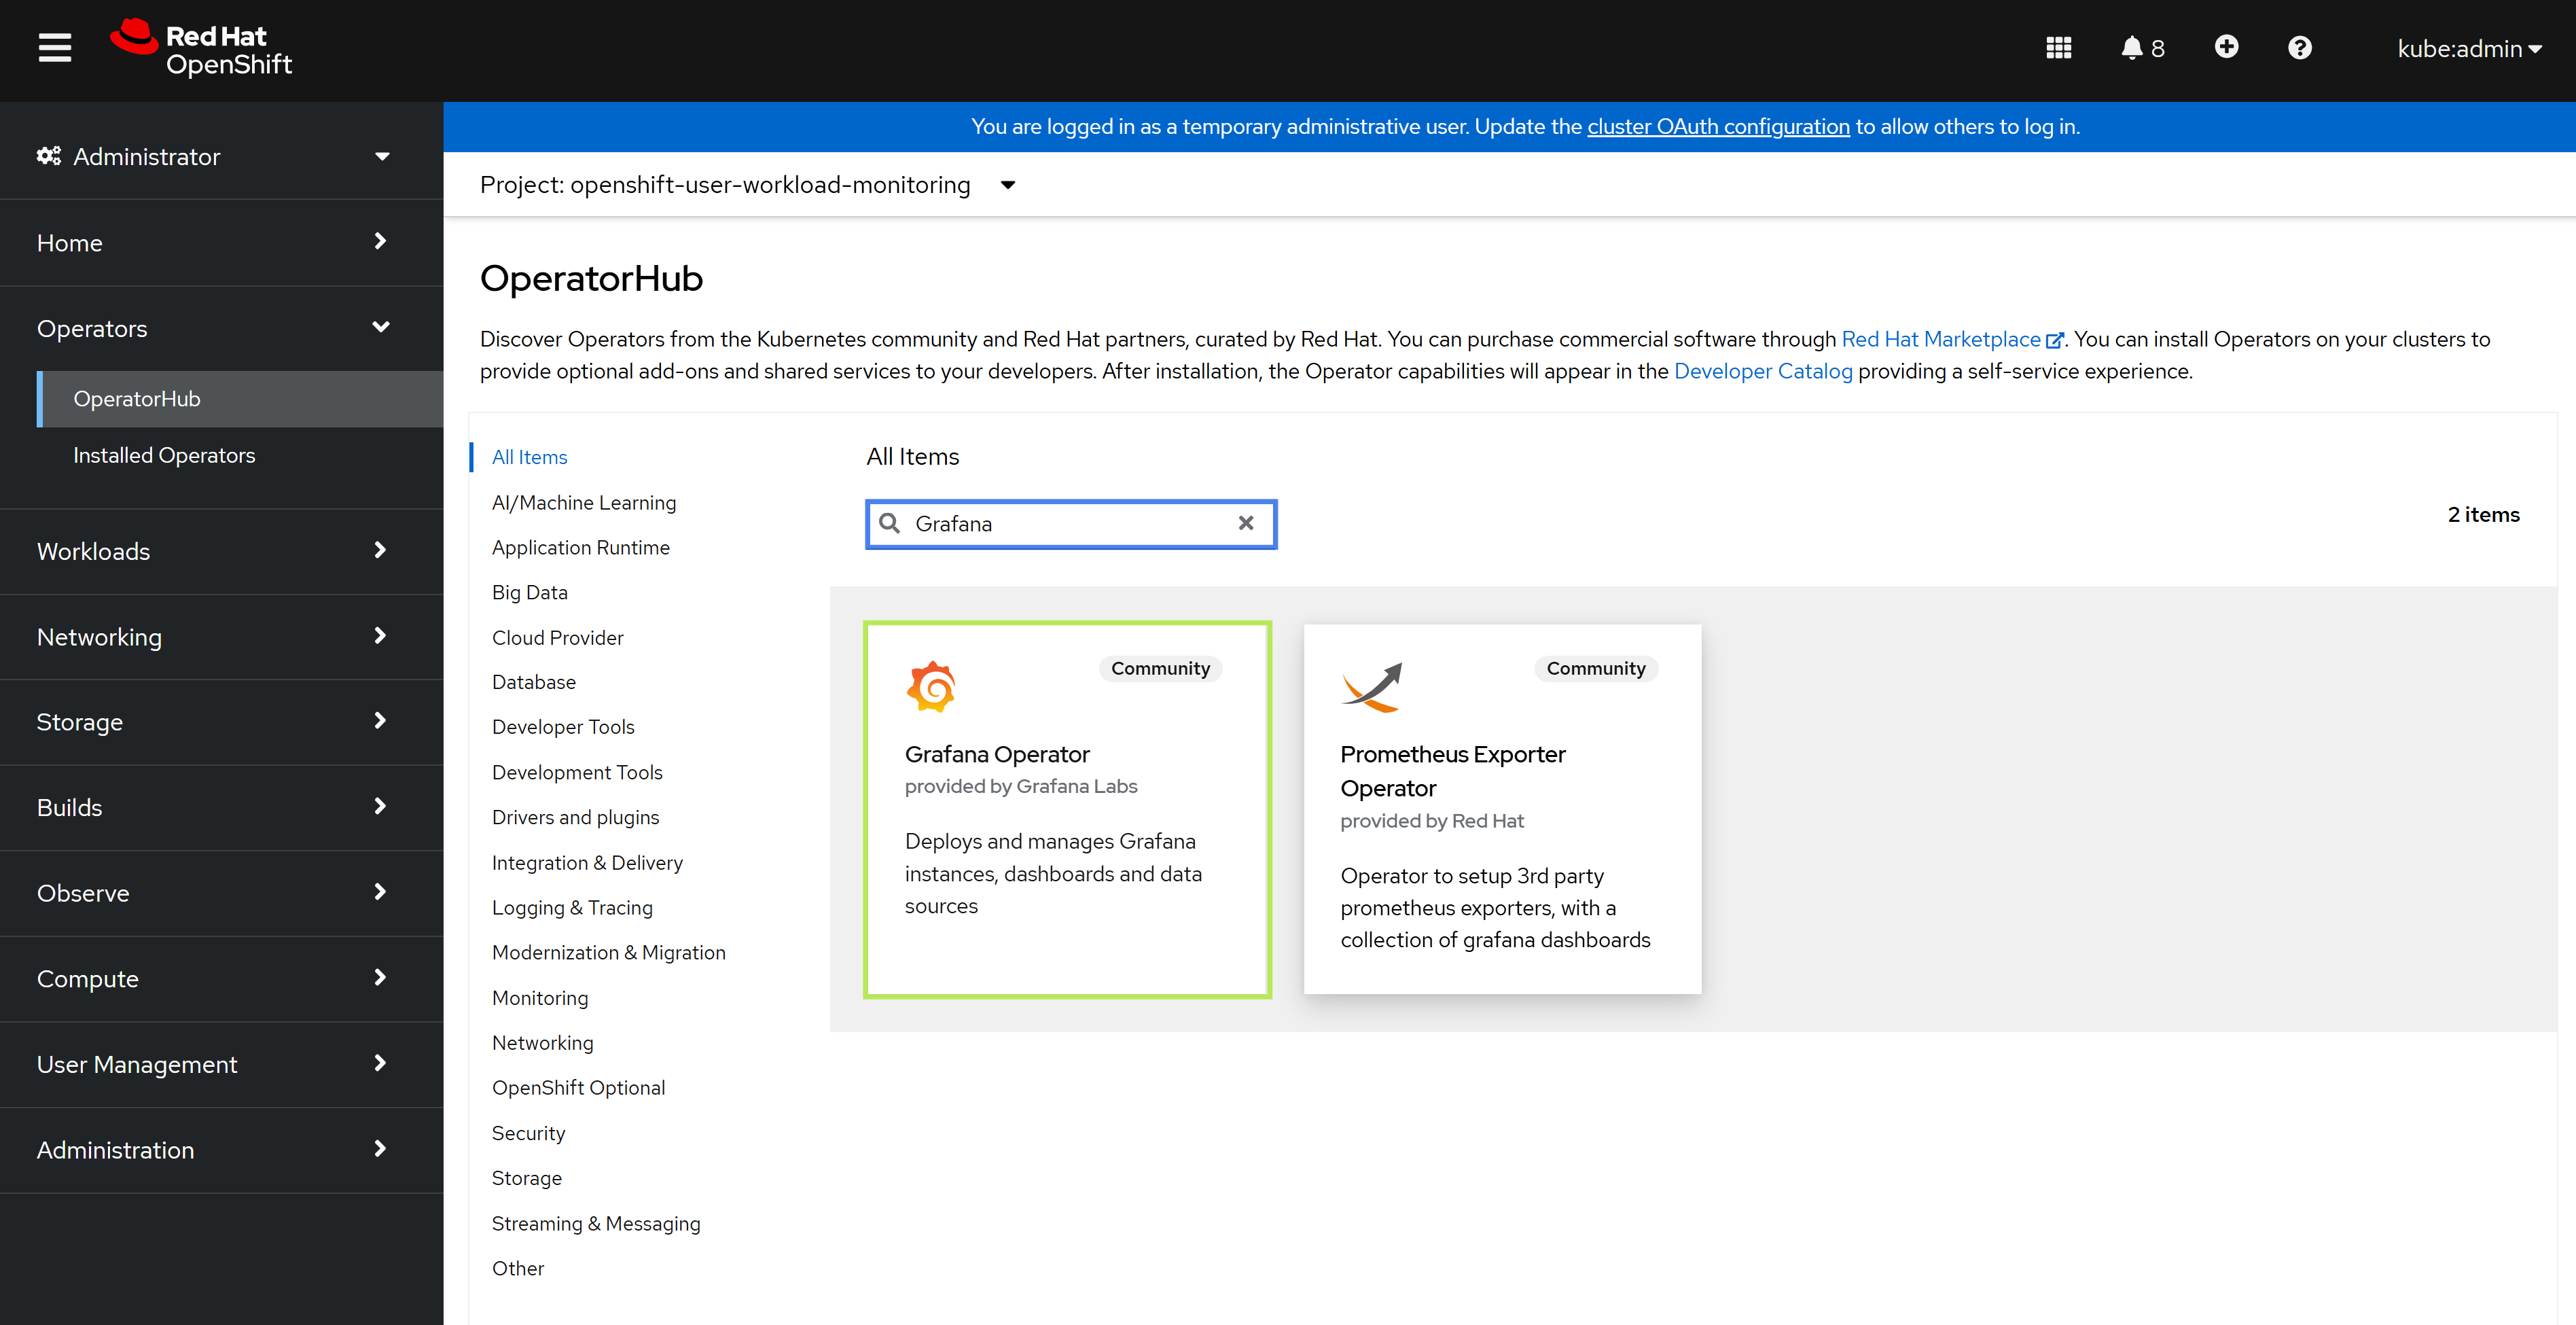
To install the operator using the Web console, expand Operators section and select Operator Hub, change the project context to openshift-user-workload-monitoring. Use the search bar to search for Grafana. Select Grafana Operator and continue to accept the disclaimer.
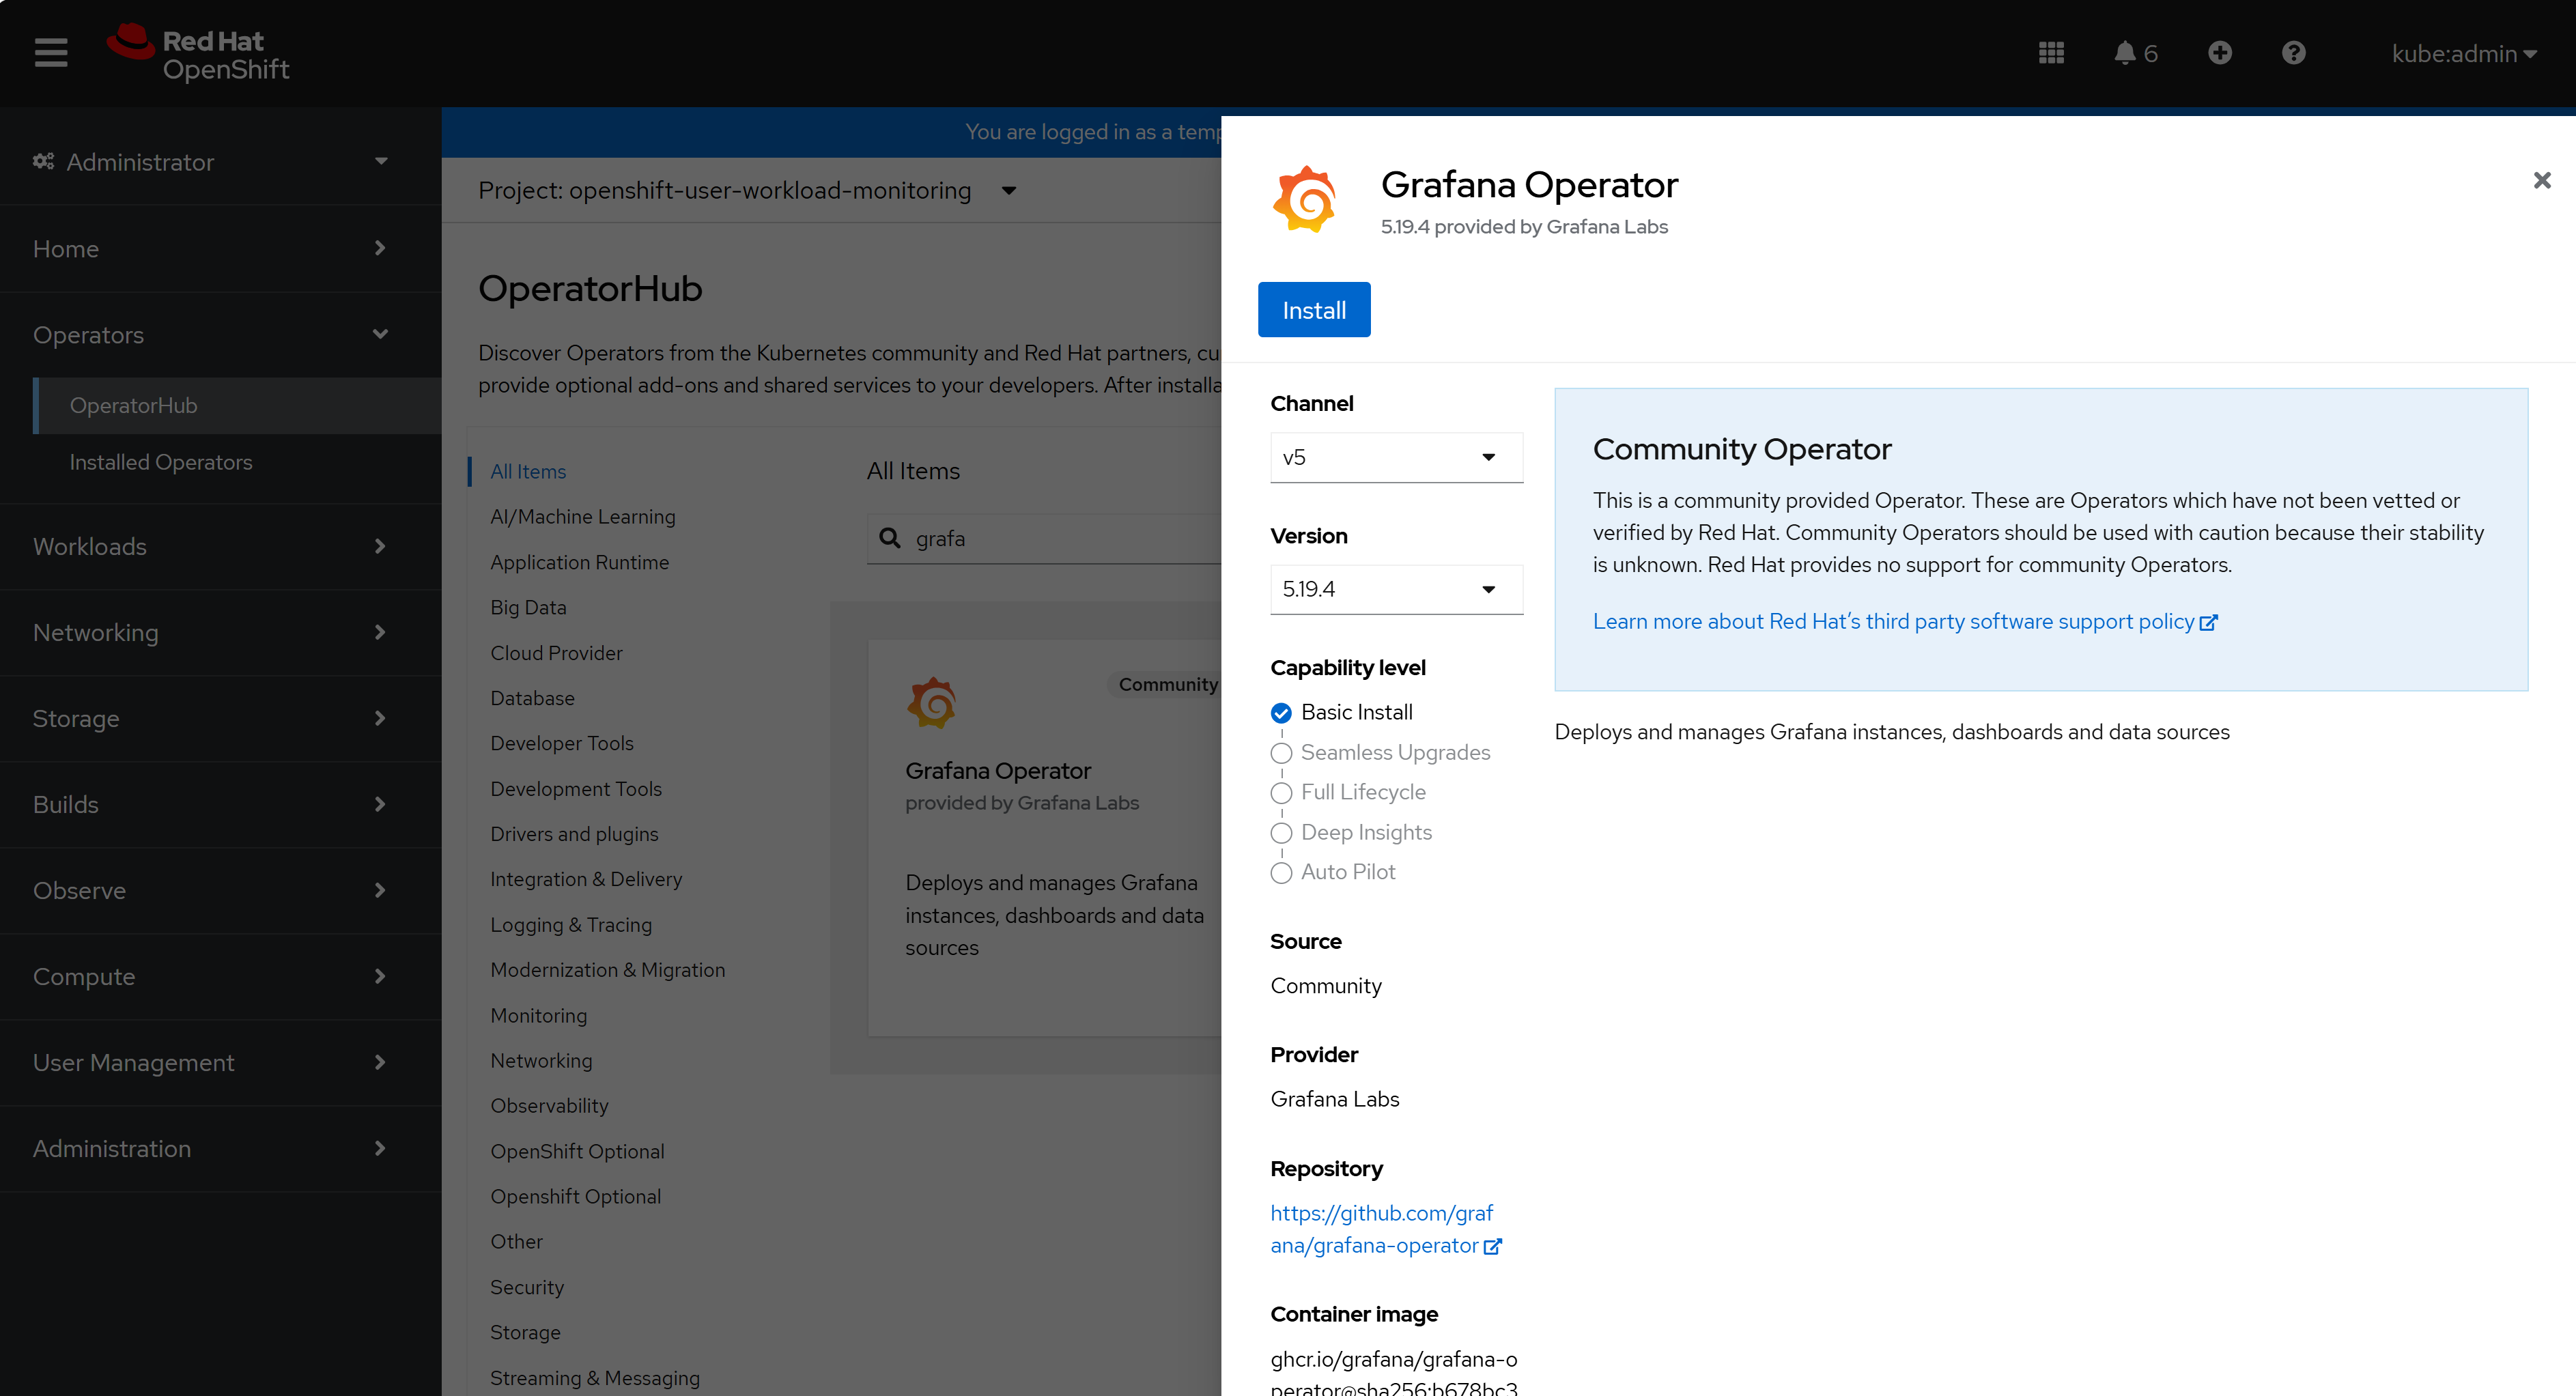
In the opened pop-up window, click Install.
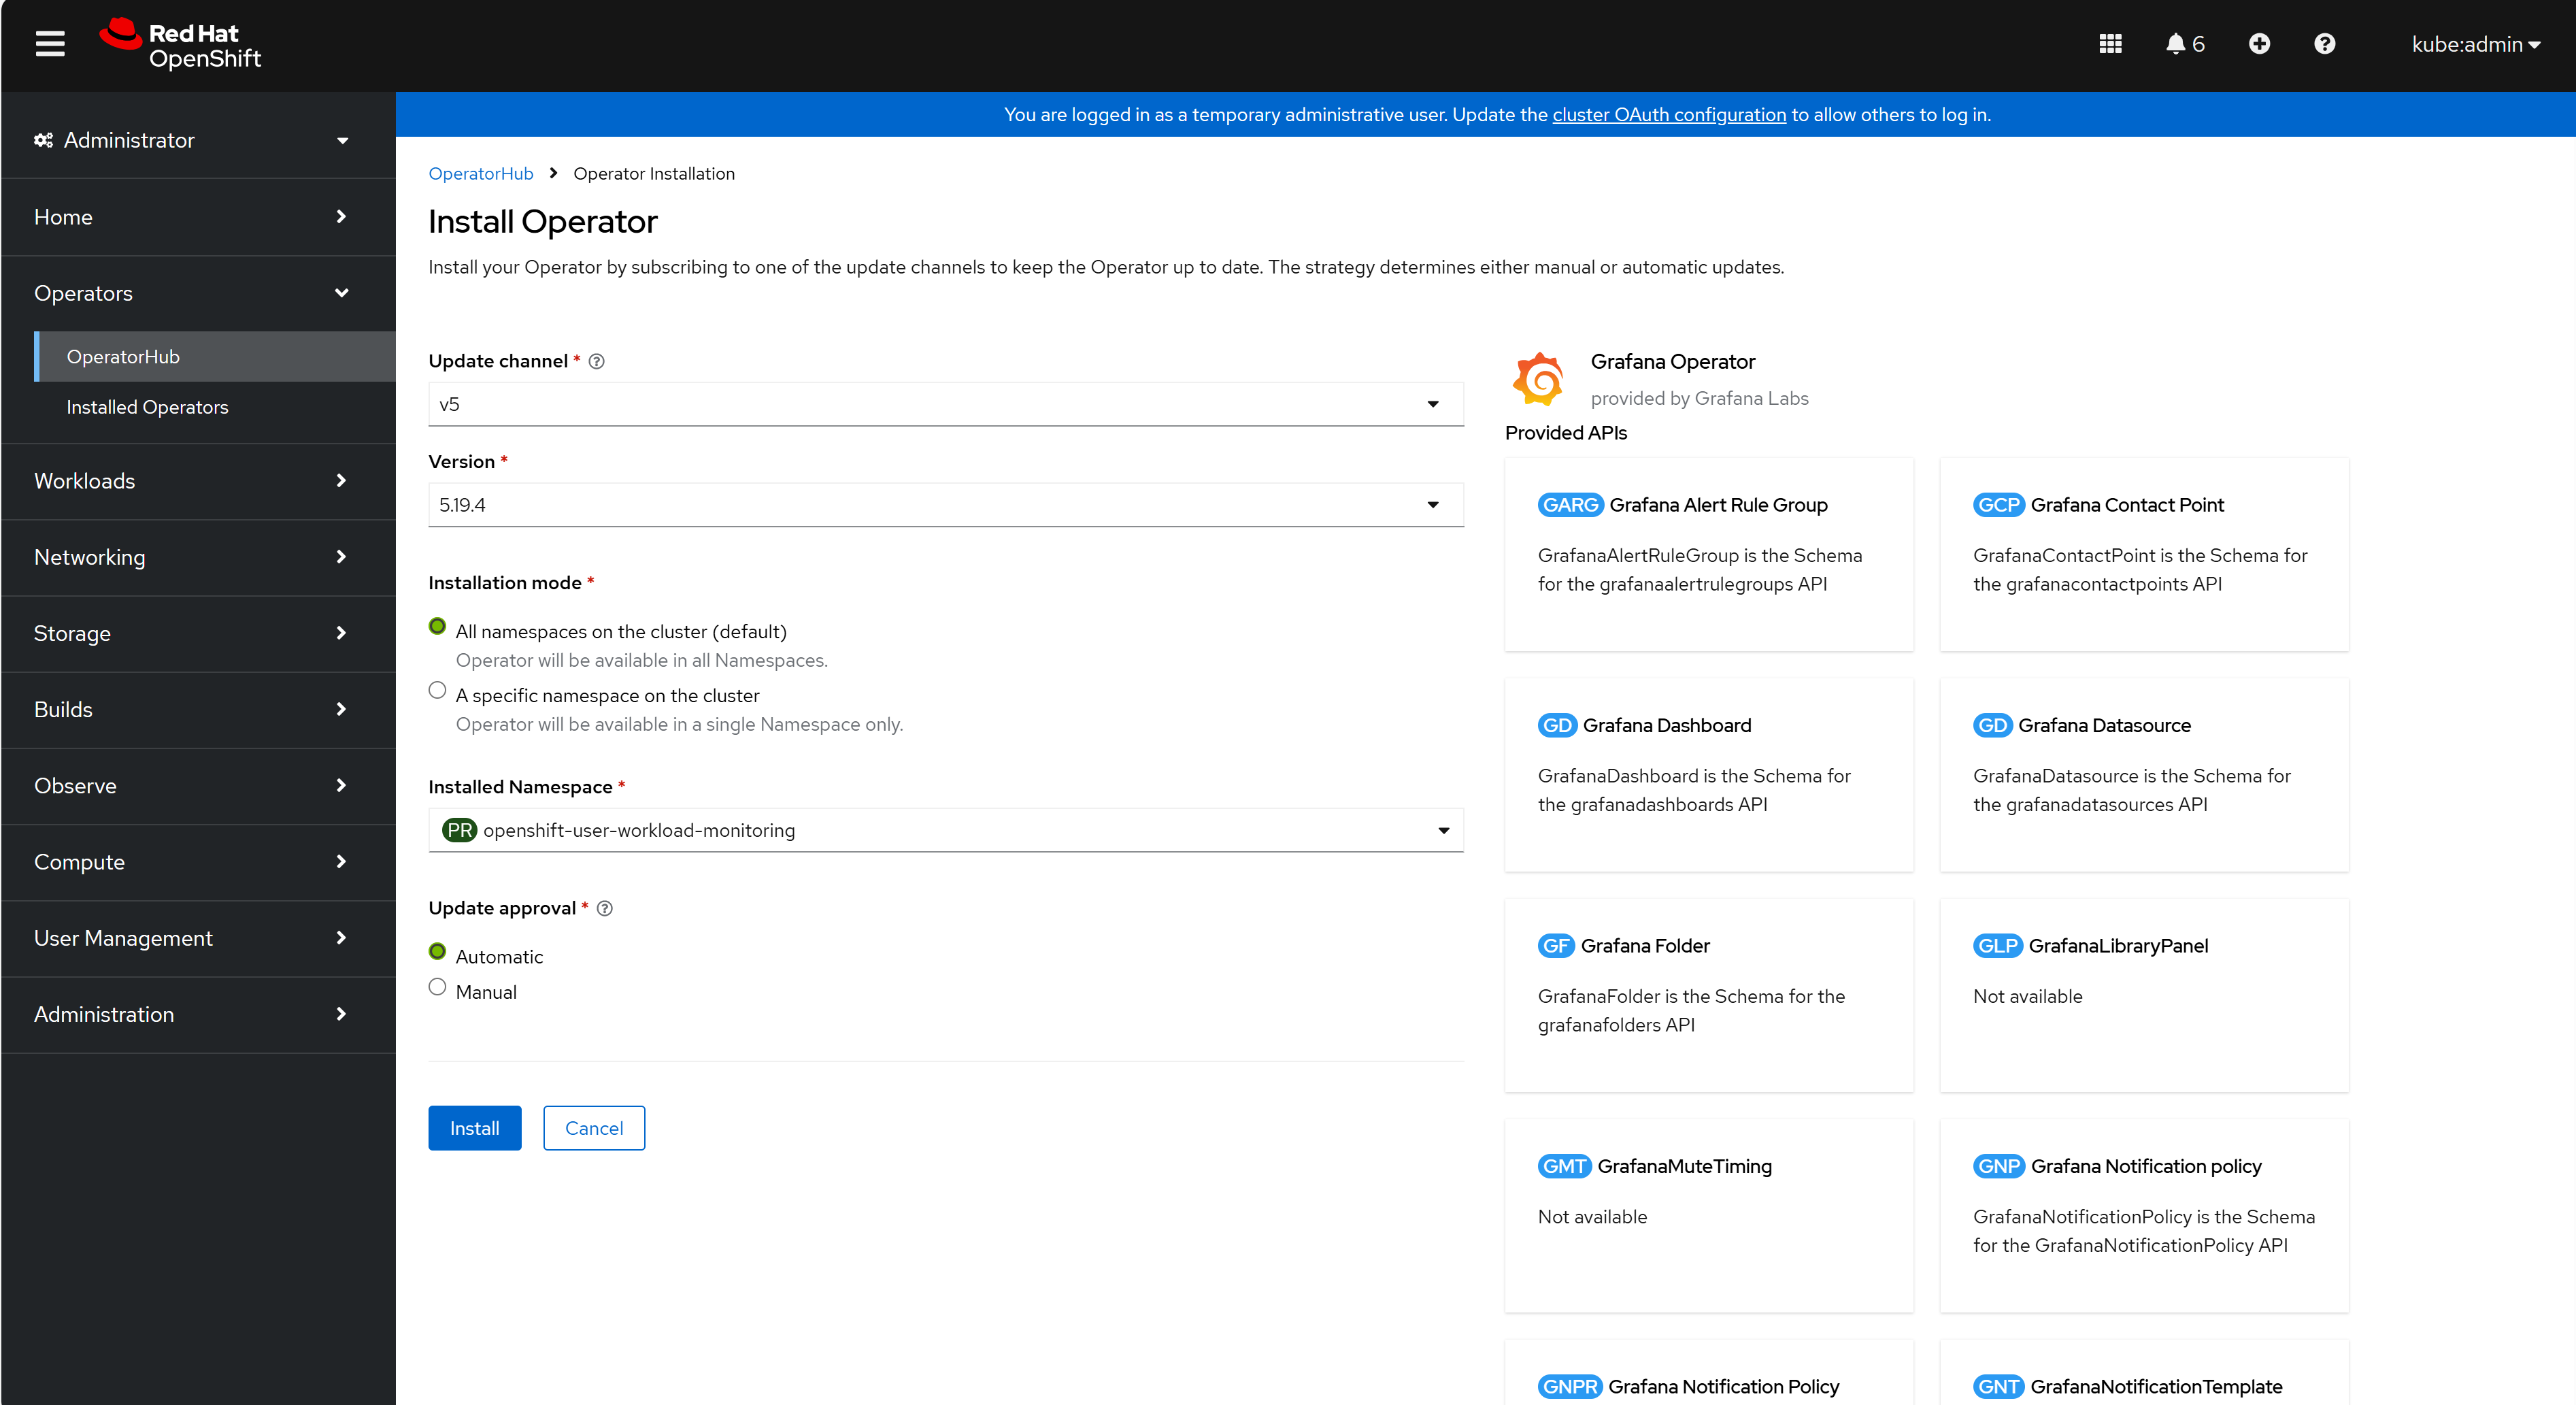
Select openshift-user-workload-monitoring as the Installed Namespace and click Install.
Wait for 1–2 minutes for installation to complete. Ensure that the Grafana Operator pod has
Readystatus:oc get pods -n openshift-user-workload-monitoring
NAME                                                      READY   STATUS    RESTARTS   AGE
grafana-operator-controller-manager-v5-5c9c74cd67-l6vkj   1/1     Running   0          28s
prometheus-operator-56fbfd68d6-vv874                      2/2     Running   0          27m
prometheus-user-workload-0                                6/6     Running   0          27m
prometheus-user-workload-1                                6/6     Running   0          27m
thanos-ruler-user-workload-0                              4/4     Running   0          27m
thanos-ruler-user-workload-1                              4/4     Running   0          27m
Creating Grafana Secret#
Create a secret with the following content in the
grafana-secret.yamlfile:kind: Secret apiVersion: v1 metadata: name: credentials namespace: openshift-user-workload-monitoring stringData: GF_SECURITY_ADMIN_PASSWORD: <your_password> GF_SECURITY_ADMIN_USER: <your_username> type: Opaque
Replace
<your_password>and<your_username>with the following:<your_password>: Set the desired password to authenticate with Grafana<your_username>: Set the desired username to authenticate with Grafana
Apply the secret:
oc create -f grafana-secret.yaml
Deploying Grafana Instance#
Create a Grafana instance CR with the following content in the
grafana-instance.yamlfile:apiVersion: grafana.integreatly.org/v1beta1 kind: Grafana metadata: name: grafana namespace: openshift-user-workload-monitoring labels: dashboards: "grafana" folders: "grafana" spec: deployment: spec: template: spec: containers: - name: grafana env: - name: GF_SECURITY_ADMIN_USER valueFrom: secretKeyRef: key: GF_SECURITY_ADMIN_USER name: credentials - name: GF_SECURITY_ADMIN_PASSWORD valueFrom: secretKeyRef: key: GF_SECURITY_ADMIN_PASSWORD name: credentials config: auth: disable_login_form: "false" log: mode: console
Deploy the Grafana instance:
oc create -f grafana-instance.yaml
Verify that the Grafana instance has been deployed and has
Readystatus:oc get pods -n openshift-user-workload-monitoring
NAME                                                      READY   STATUS    RESTARTS   AGE
grafana-deployment-7d8c7b7565-gkv5w                       1/1     Running   0          22s
grafana-operator-controller-manager-v5-5c9c74cd67-l6vkj   1/1     Running   0          22m
prometheus-operator-56fbfd68d6-vv874                      2/2     Running   0          49m
prometheus-user-workload-0                                6/6     Running   0          49m
prometheus-user-workload-1                                6/6     Running   0          49m
thanos-ruler-user-workload-0                              4/4     Running   0          49m
thanos-ruler-user-workload-1                              4/4     Running   0          49m
Assign the cluster-monitoring-view role to the
grafana-saservice account created by the Grafana instance:oc adm policy add-cluster-role-to-user cluster-monitoring-view -z grafana-sa -n openshift-user-workload-monitoring
Create the Grafana service account token secret with the following content in the
grafana-sa-token.yamlfile:apiVersion: v1 kind: Secret metadata: name: grafana-sa-token namespace: openshift-user-workload-monitoring annotations: kubernetes.io/service-account.name: grafana-sa type: kubernetes.io/service-account-token
Apply the secret:
oc create -f grafana-sa-token.yaml
Exposing Grafana Service#
Create an edge route:
oc -n openshift-user-workload-monitoring create route edge grafana --service=grafana-service --insecure-policy=Redirect --hostname=monitoring.<cluster-ingress-domain>
Replace
<cluster-ingress-domain>with the actual ingress domain of the cluster, which can be retrieved with the following command:oc get ingresscontroller default -n openshift-ingress-operator -o jsonpath='{.status.domain}'
apps.h4m.example.com
Retrieve the Grafana route hostname:
oc -n openshift-user-workload-monitoring get route grafana -o jsonpath='{.spec.host}'
monitoring.apps.h4m.example.com
Important
If you are relying on a local
hostsfile to map application endpoints to the Ingress controller, add a new entry for the Grafana endpoint. Replace<ingress-ip>with the Ingress Virtual IP address or, on a single-node cluster, the Node IP, and replace<grafana-route-hostname>with the Grafana route hostname obtained above. Refer to IP Addresses and DNS Records for more information.<ingress-ip> <grafana-route-hostname>
Access Grafana using the URL:
https://<grafana-route-hostname>. Login using the credentials specified in the Creating Grafana Secret step.
Configuring Grafana Datasource#
Create a Grafana Datasource CR with the following content in the
grafana-datasource.yamlfile:apiVersion: grafana.integreatly.org/v1beta1 kind: GrafanaDatasource metadata: name: grafana-ds namespace: openshift-user-workload-monitoring spec: valuesFrom: - targetPath: "secureJsonData.httpHeaderValue1" valueFrom: secretKeyRef: name: "grafana-sa-token" key: "token" instanceSelector: matchLabels: dashboards: "grafana" datasource: name: Prometheus type: prometheus uid: prometheus access: proxy url: https://thanos-querier.openshift-monitoring.svc:9091 isDefault: true jsonData: tlsSkipVerify: true timeInterval: "5s" httpHeaderName1: "Authorization" secureJsonData: httpHeaderValue1: "Bearer ${token}"
Apply the datasource:
oc create -f grafana-datasource.yaml
Installing Longhorn#
To install Longhorn:
Log into the jump node.
Add Longhorn:
helm repo add longhorn https://charts.longhorn.io
longhorn has been added to your repositories
Update your Helm repositories:
helm repo update
Hang tight while we grab the latest from your chart repositories...
...Successfully got an update from the longhorn chart repository
Update Complete. ⎈Happy Helming!⎈
Install Longhorn:
helm install longhorn longhorn/longhorn --namespace longhorn-system
  --create-namespace --version 1.6.1 --set openshift.enabled=true
NAME: longhorn
LAST DEPLOYED: Tue Apr 5 09:16:23 2024
NAMESPACE: longhorn-system
STATUS: deployed
REVISION: 1
TEST SUITE: None
NOTES:
Longhorn is now installed on the cluster!

Please wait a few minutes for other Longhorn components such as CSI
deployments, Engine Images, and Instance Managers to be initialized.

Visit our documentation at https://longhorn.io/docs/
Ensure all Longhorn pods have the
Runningstatus:oc get pods -n longhorn-system NAME READY STATUS RESTARTS AGE csi-attacher-785fd6545b-7k42j 1/1 Running 16 7d1h csi-attacher-785fd6545b-hk6cz 1/1 Running 0 21h csi-attacher-785fd6545b-xflnp 1/1 Running 0 21h csi-provisioner-8658f9bd9c-dsrcc 1/1 Running 9 7d1h csi-provisioner-8658f9bd9c-nfj2r 1/1 Running 1 21h csi-provisioner-8658f9bd9c-t42p2 1/1 Running 0 21h csi-resizer-68c4c75bf5-kjwj8 1/1 Running 0 21h csi-resizer-68c4c75bf5-qv6kf 1/1 Running 14 7d1h csi-resizer-68c4c75bf5-s2kj4 1/1 Running 0 21h csi-snapshotter-7c466dd68f-fvbb6 1/1 Running 0 21h csi-snapshotter-7c466dd68f-j2bnd 1/1 Running 0 21h csi-snapshotter-7c466dd68f-wf85g 1/1 Running 16 7d1h engine-image-ei-68f17757-965sd 1/1 Running 18 63d engine-image-ei-68f17757-rv8cl 1/1 Running 13 63d engine-image-ei-68f17757-sggfc 1/1 Running 10 63d instance-manager-64896d0c43a988ada1 1/1 Running 0 5d2h instance-manager-853e26c37f6b3dd915 1/1 Running 0 44h instance-manager-ef72db15e639b20758 1/1 Running 0 21h longhorn-csi-plugin-9fxzj 3/3 Running 59 63d longhorn-csi-plugin-jlvgp 3/3 Running 36 63d longhorn-csi-plugin-r45j7 3/3 Running 36 63d longhorn-driver-deployer-75fff9c757-9ghqk 1/1 Running 0 21h longhorn-manager-gngq9 1/1 Running 6 13d longhorn-manager-jd4pn 1/1 Running 1 13d longhorn-manager-zxmj4 1/1 Running 5 13d longhorn-ui-6456f89c8f-ht79n 1/1 Running 0 21h longhorn-ui-6456f89c8f-mdwrr 1/1 Running 0 7d1h
Installing MetalLB Operator#
MetalLB Operator is used to provide external IP address to services of type LoadBalancer on the cluster.
To install the operator using the Web console:
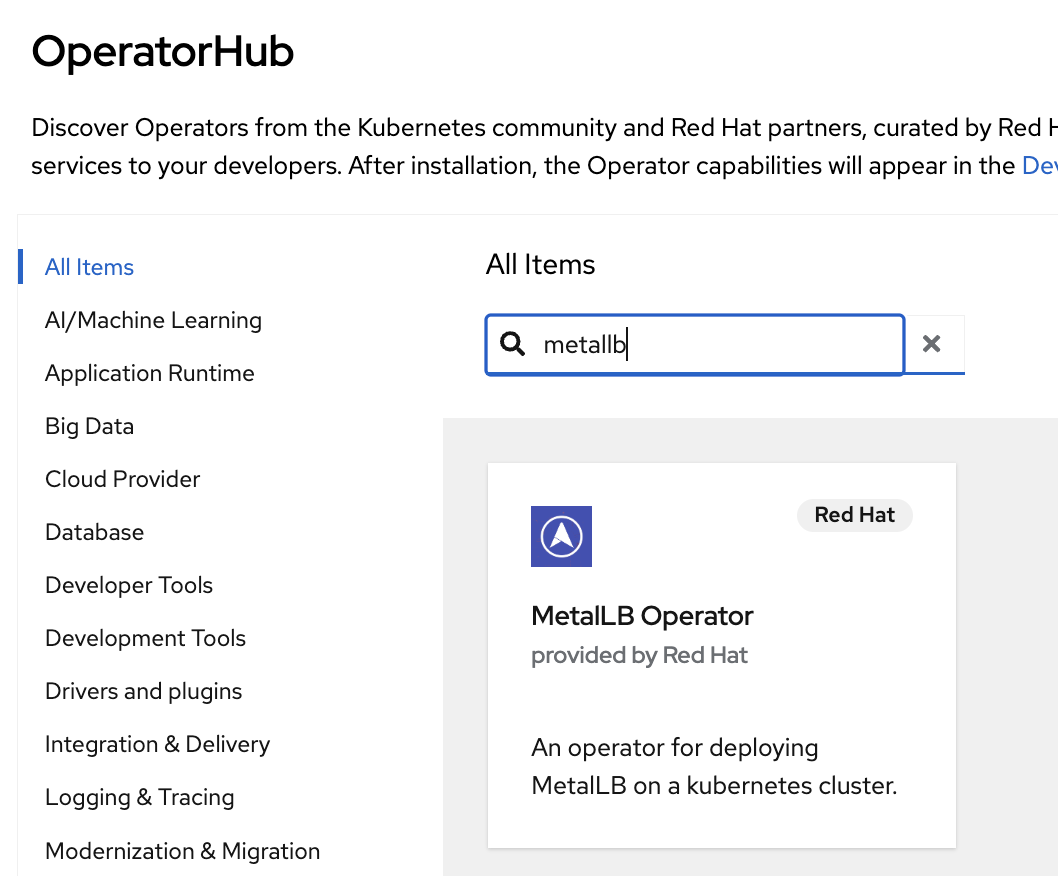
Expand Operators section and select Operator Hub. Use the search bar to search for MetalLB. Select MetalLB Operator.
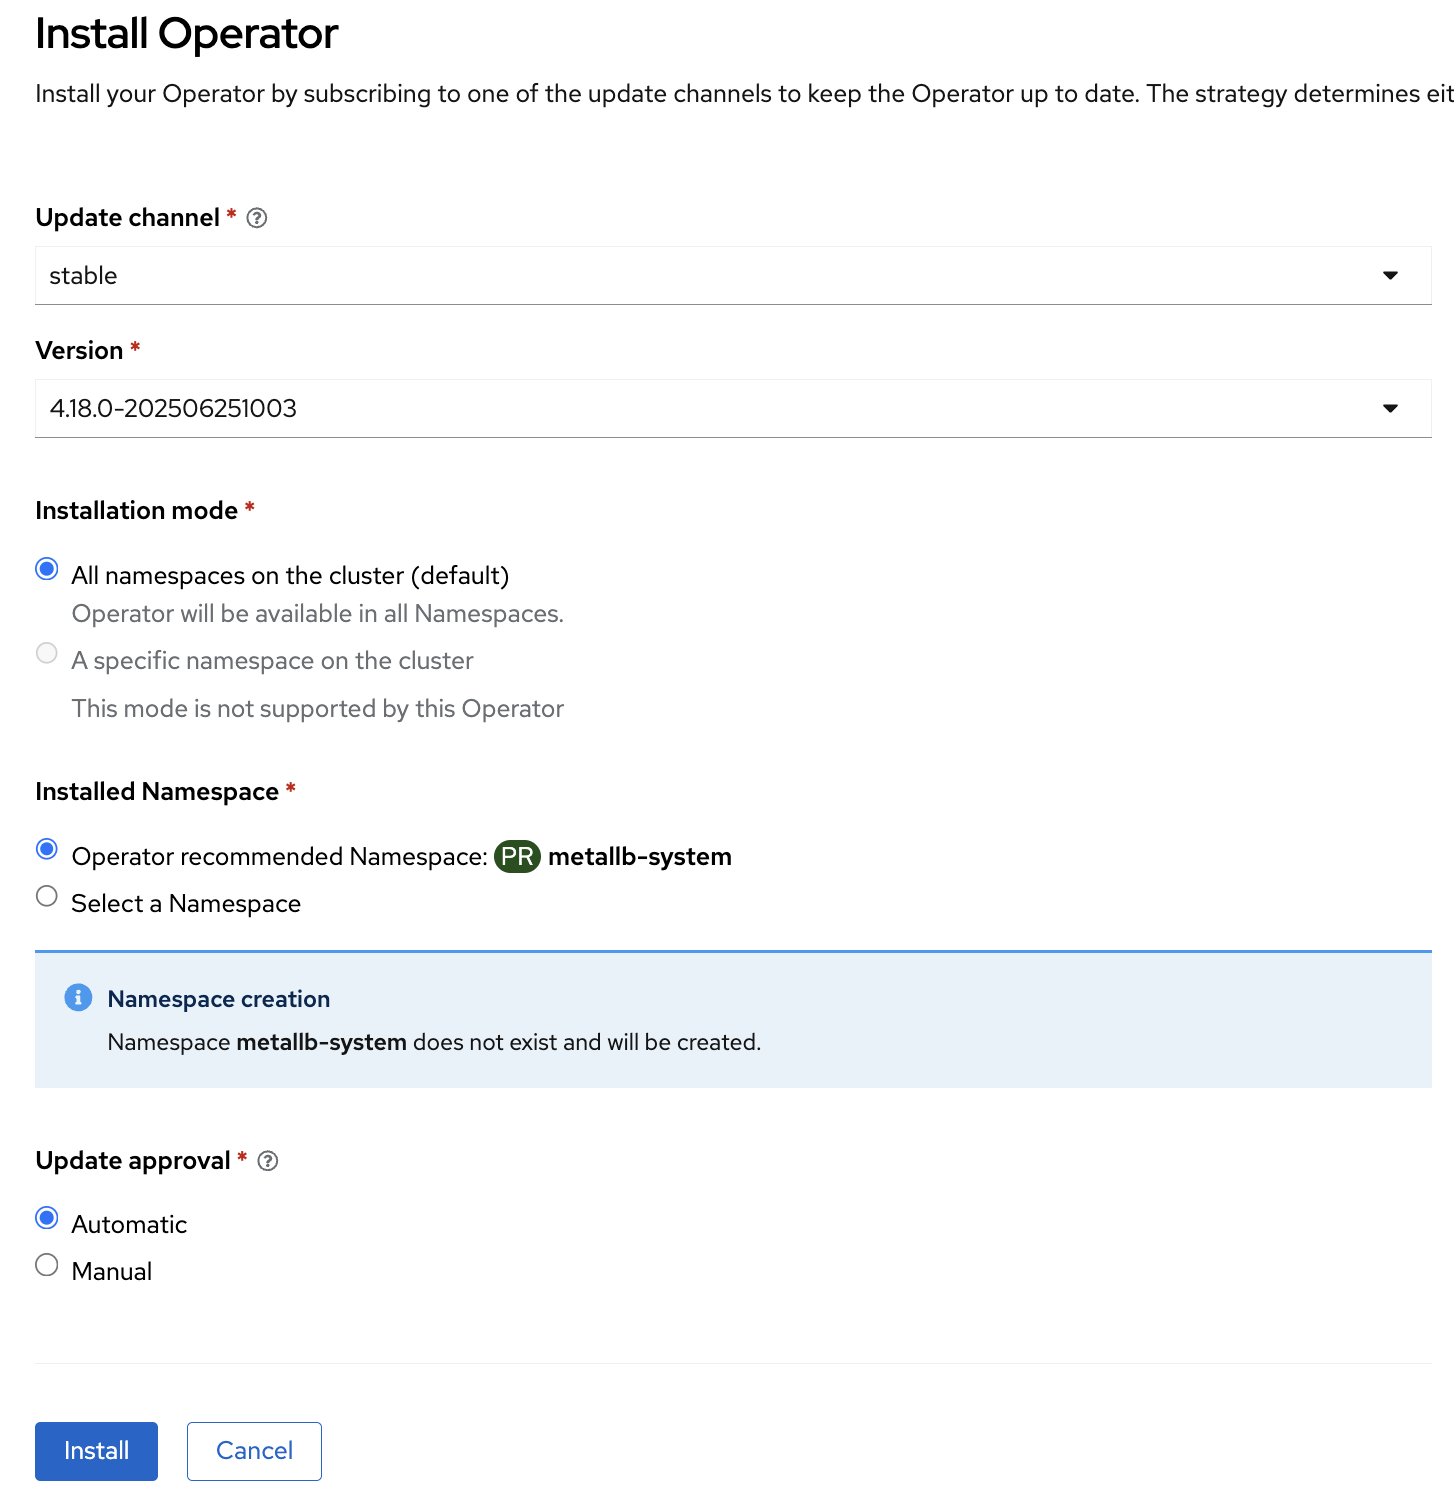
In the pop-up window, click Install.
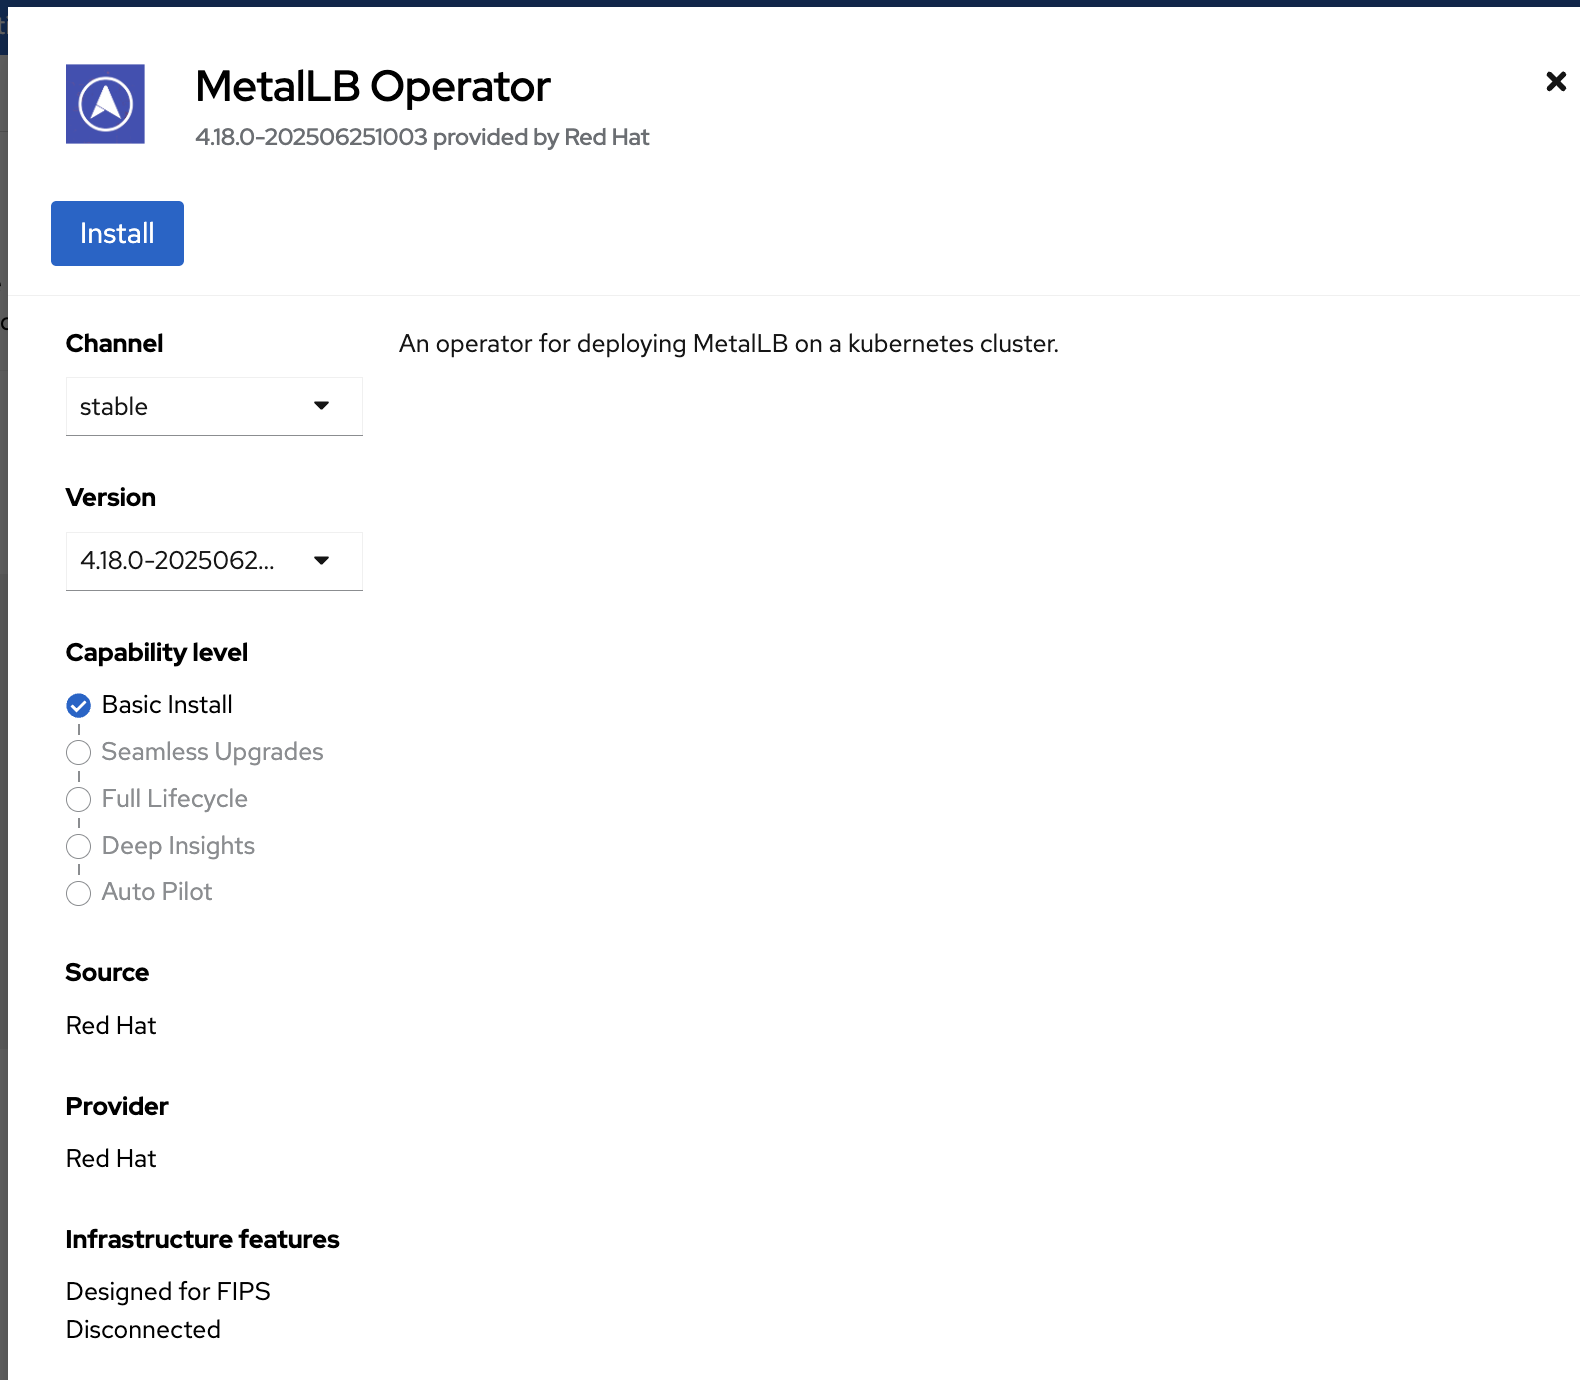
Click Install.
After the installation completes, navigate to Operators section, click Installed Operators, and select MetalLB Operator.
On the MetalLB Operator details screen, click Create instance in the MetalLB section.
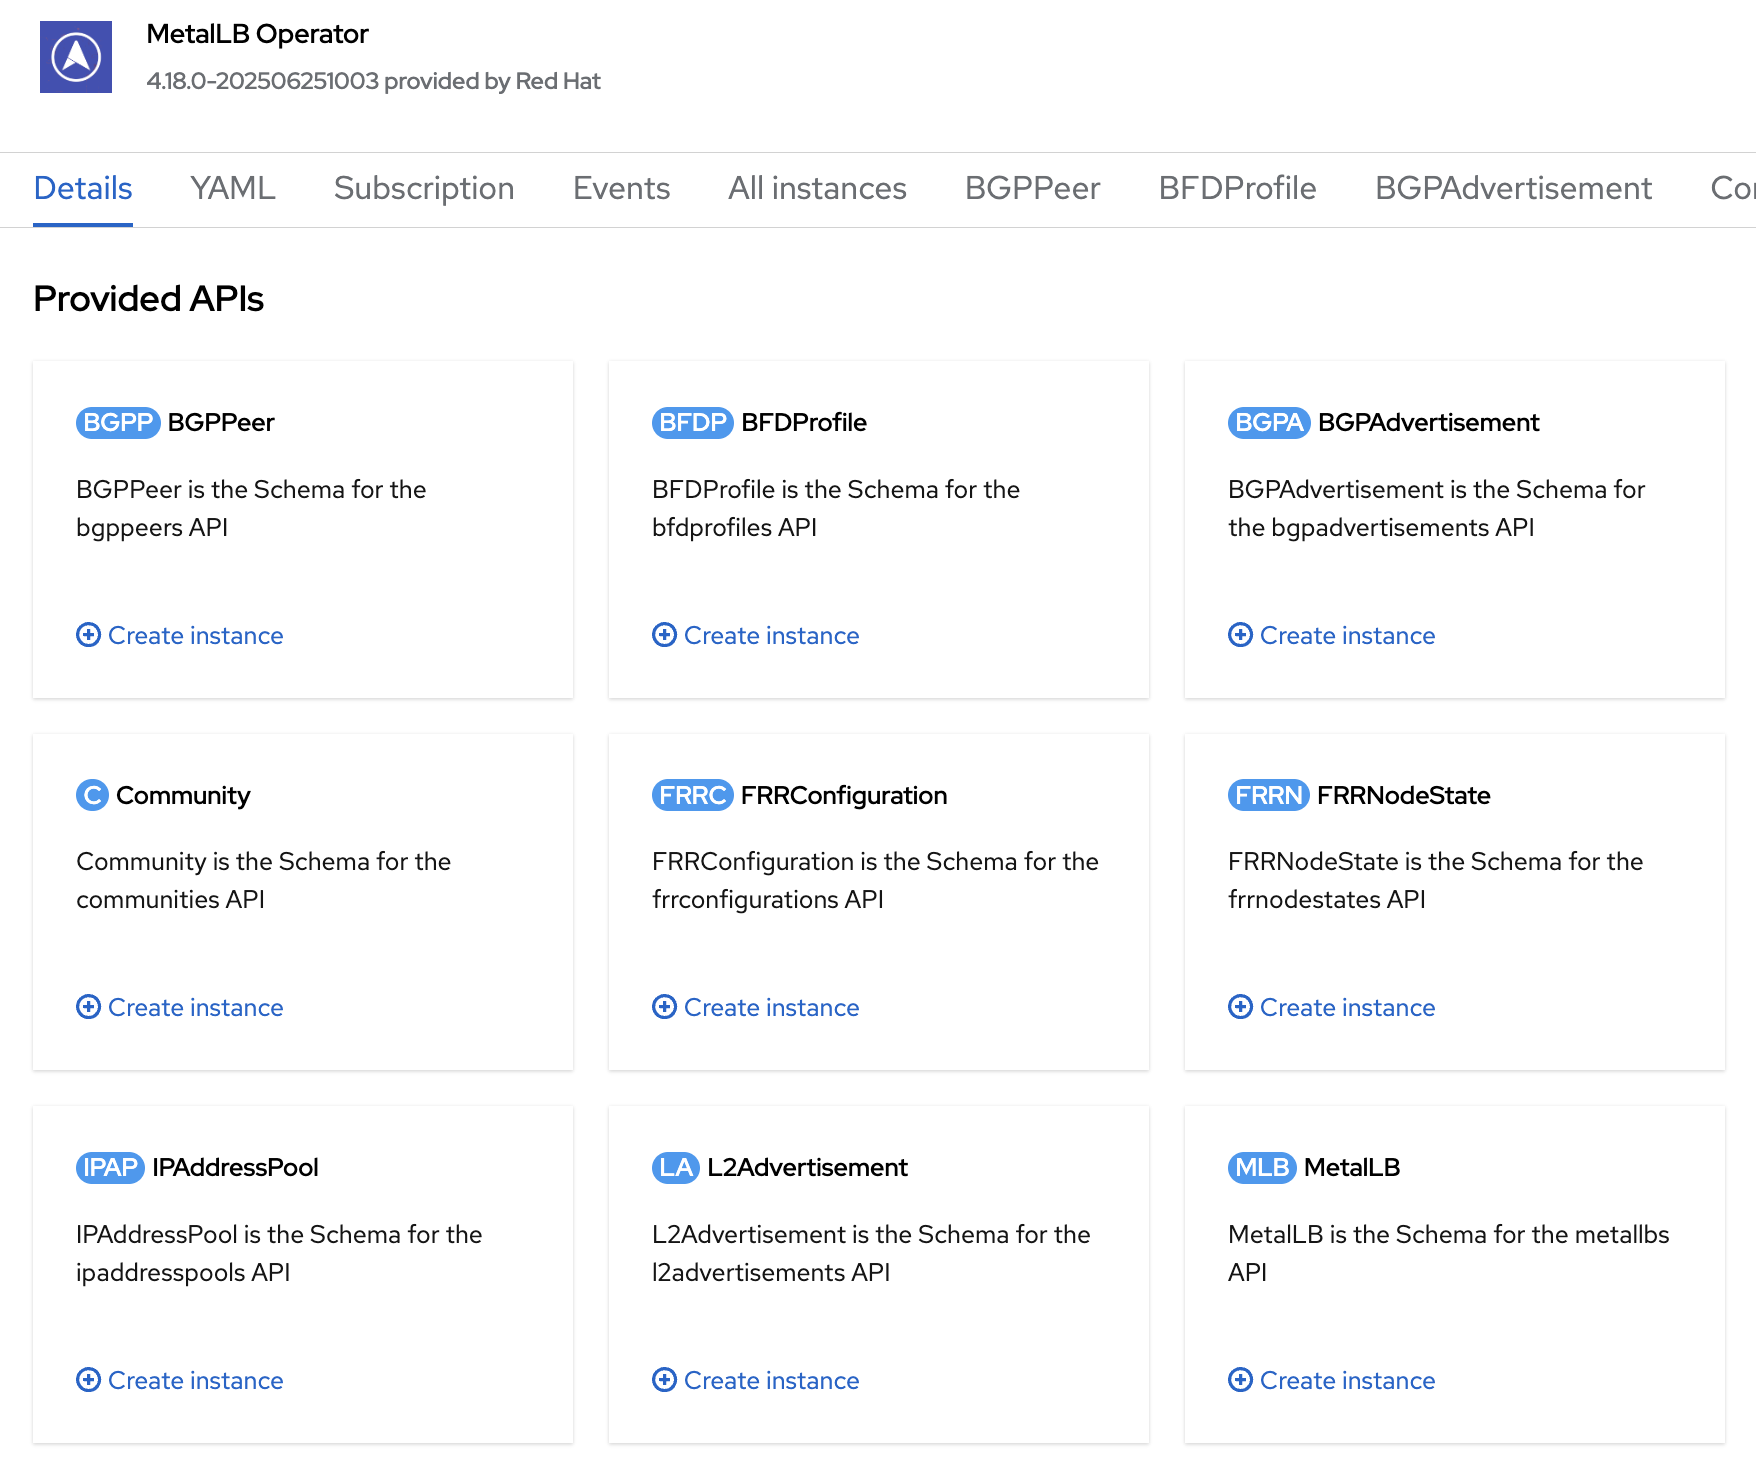
Click the Create button.
Configure Address Pool and L2Advertisement#
Create
ip_addresspool.yamlbased on the following example. Modify the IP addresses based on your environment:apiVersion: metallb.io/v1beta1 kind: IPAddressPool metadata: namespace: metallb-system name: holoscanmedia-metallb labels: zone: holoscanmedia spec: addresses: - 10.21.10.101/32 - 10.21.10.102/32 - 10.21.10.103/32 - 10.21.10.104/32 - 10.21.10.105/32
Apply the configuration:
oc create -f ip_addresspool.yaml
Verify that the address pool is configured properly:
oc describe -n metallb-system IPAddressPool holoscanmedia-metallb
Name:         holoscanmedia-metallb
Namespace:    metallb-system
Labels:       zone=holoscanmedia
Annotations:  <none>
API Version:  metallb.io/v1beta1
Kind:         IPAddressPool
Metadata:
...
Spec:
    Addresses:
        10.21.10.101/32
        10.21.10.102/32
        10.21.10.103/32
        10.21.10.104/32
        10.21.10.105/32
    Auto Assign:       true
    Avoid Buggy IPs:  false
Events:              <none>
Create
l2_advertisement.yamlwith the following content. The match-expression value must match the zone specified in the IPAddressPool created previously:apiVersion: metallb.io/v1beta1 kind: L2Advertisement metadata: name: l2advertisement-label namespace: metallb-system spec: ipAddressPoolSelectors: - matchExpressions: - key: zone operator: In values: - holoscanmedia
Apply the configuration:
oc create -f l2_advertisement.yaml
Fuse Mounting#
To access /dev/fuse, the following MachineConfig needs to be created.
Create
fuse.yamlbased on the following template. Replace<role>withworkerfor a 5-node cluster andmasterfor a 3-node cluster or SNO:apiVersion: machineconfiguration.openshift.io/v1 kind: MachineConfig metadata: labels: machineconfiguration.openshift.io/role: <role> name: 99-worker-crio-fuse spec: config: ignition: version: 3.2.0 storage: files: - path: /etc/crio/crio.conf.d/99-crio-fuse.conf overwrite: true contents: source: data:text/plain;charset=utf-8;base64,W2NyaW8ucnVudGltZS5ydW50aW1lcy5mdXNlXQpydW50aW1lX3BhdGggPSAiL3Vzci9iaW4vcnVuYyIKcnVudGltZV9yb290ID0gIi9ydW4vcnVuYyIKcnVudGltZV90eXBlID0gIm9jaSIKYWxsb3dlZF9hbm5vdGF0aW9ucyA9IFsKICAgICJpby5rdWJlcm5ldGVzLmNyaS1vLkRldmljZXMiLApdCg==
The Base64-encoded data in the YAML above corresponds to the following plain text:
[crio.runtime.runtimes.fuse]
runtime_path = "/usr/bin/runc"
runtime_root = "/run/runc"
runtime_type = "oci"
allowed_annotations = [
    "io.kubernetes.cri-o.Devices",
]
Apply the MachineConfig:
oc create -f fuse.yaml
This will restart the nodes.
Monitor the progress by gathering MCP status:
oc get mcp

NAME     CONFIG                                             UPDATED   UPDATING   DEGRADED   MACHINECOUNT   READYMACHINECOUNT   UPDATEDMACHINECOUNT   DEGRADEDMACHINECOUNT   AGE
master   rendered-master-d140dfa8496eef52dd9ee9d1383704aa   False     True       False      3              2                   3                     0                      65d
worker   rendered-worker-dd78f8d267786d267d0789cc7514ce18   True      False      False      0              0                   0                     0                      65d
Wait until
READYMACHINECOUNTis equal to the number of worker nodes in the cluster.
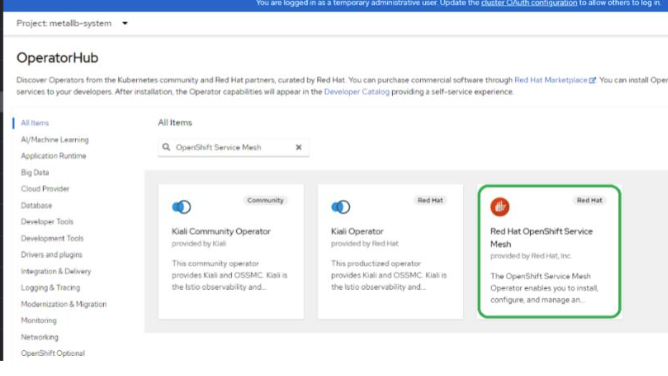
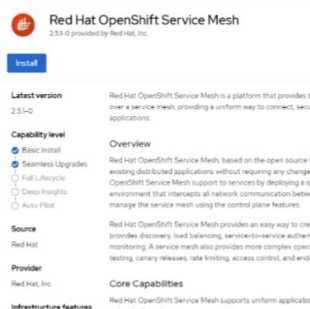
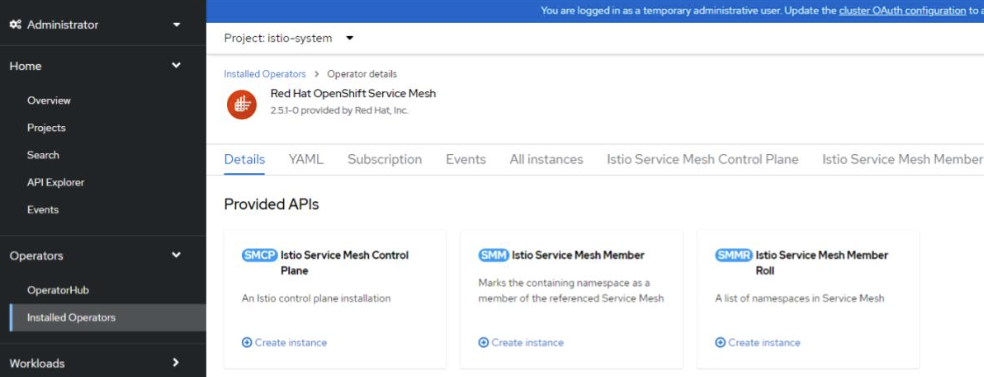
Installing OpenShift Service Mesh Operator#
Red Hat OpenShift Service Mesh provides an easy way to create a network of deployed services that provides discovery, load balancing, service-to-service authentication, failure recovery, metrics, and monitoring. The OpenShift Service Mesh is built on open-source Istio.
To install the operator using the Web console:
Expand Operators section and select Operator Hub.
Use the search bar to search for OpenShift Service Mesh.
Select Red Hat OpenShift Service Mesh provided by RedHat and maintained by RedHat.
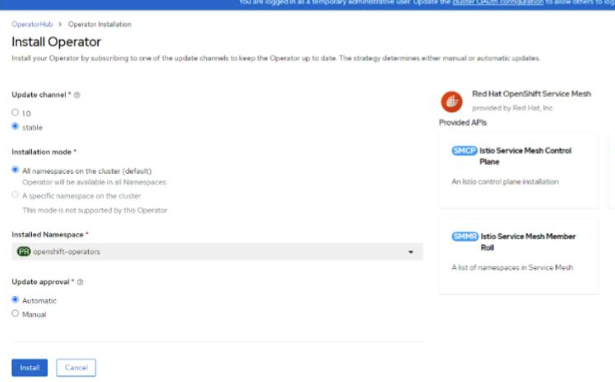
In the pop-up window, click Install.
Click Install.
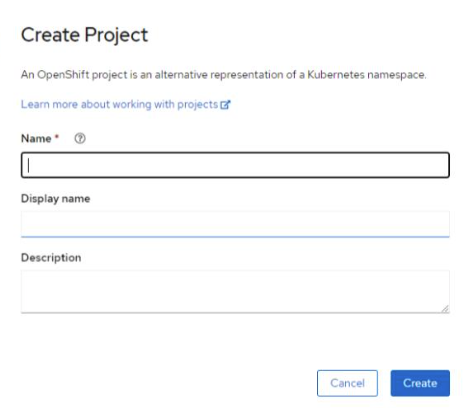
Create a project istio-system. Navigate to Home > Projects and click Create Project.
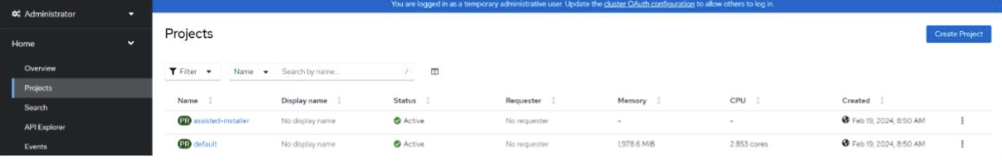
Enter name as istio-system and click Create.
Navigate to Operators section, click Installed Operators, select project istio-system, and click RedHat OpenShift Service Mesh.
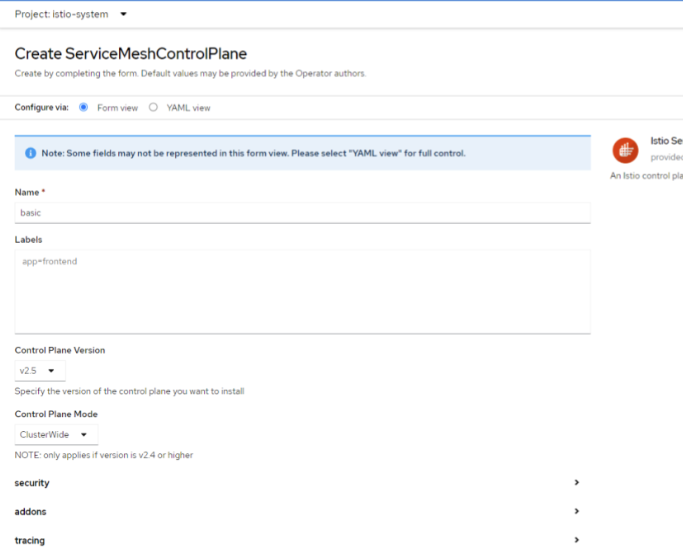
Click Create instance under Istio Service Mesh Control Plane.
On Create ServiceMeshControlPlane screen, switch Control Plane Mode to ClusterWide.
Expand addons section and disable all addons.
Under the tracing section, select Tracing provider as None.
Click Create.
Allow non-service mesh traffic:
OpenShift Service Mesh adds a default network policy, which blocks all non-service mesh traffic. If you need to allow non-service mesh traffic, then apply a network policy to the required namespace. For example, this example, which allows all incoming connections to all pods.
Create
enable_ingress.yamlwith the following content:apiVersion: networking.k8s.io/v1 kind: NetworkPolicy metadata: annotations: name: allow-ingress spec: ingress: - {} podSelector: {} policyTypes: - Ingress
Apply the configuration to the default namespace:
oc create -f enable_ingress.yaml
Allow egress traffic:
To ensure egress traffic flows, add egress sidecar info for the namespace where istio-injection is enabled.
Create
egress.yamlbased on the following template. Replace<namespace>with the namespace whereistio-injectionis enabled:apiVersion: networking.istio.io/v1alpha3 kind: Sidecar metadata: name: default namespace: <namespace> spec: egress: - hosts: - "./*" - "istio-system/*"
Apply the configuration:
oc create -f egress.yaml