

Clusters
This guide explains the procedure to view and manage Clusters.
The Cluster table provides a quick and easy way to see the status of your cluster.
Clusters Table
The Clusters table can be found under Resources in the NVIDIA Run:ai platform.
The clusters table provides a list of the clusters added to NVIDIA Run:ai platform, along with their status.
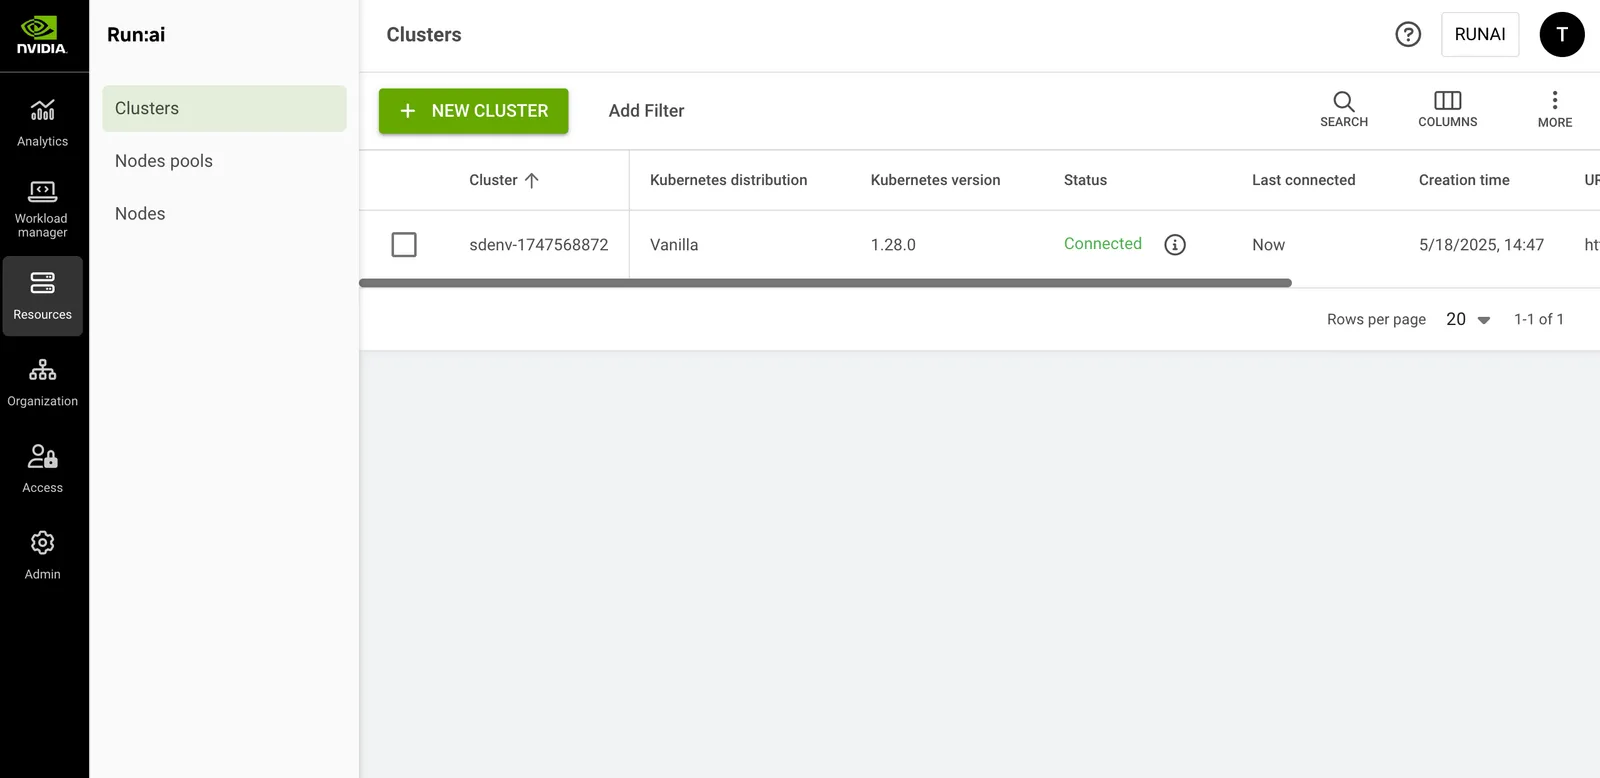
The clusters table consists of the following columns:
Cluster Status
Network Topologies Associated with the Cluster
Click one of the values in the Network topologies column to view the list of network topologies and their parameters.
Customizing the Table View
- Filter - Click ADD FILTER, select the column to filter by, and enter the filter values
- Search - Click SEARCH and type the value to search by
- Sort - Click each column header to sort by
- Column selection - Click COLUMNS and select the columns to display in the table
- Download table - Click MORE and then Click Download as CSV. Export to CSV is limited to 20,000 rows.
Adding a New Cluster
Follow the setup and installation instructions below to get the installation instructions to install the NVIDIA Run:ai cluster.
Setup
- In the NVIDIA Run:ai UI, go to Resources -> Clusters and click NEW CLUSTER.
- Enter a unique name for your cluster.
- Optional: Choose the NVIDIA Run:ai cluster version (latest, by default).
- Set the cluster location:
- Same as control plane - Install the NVIDIA Run:ai cluster on the same Kubernetes cluster as the NVIDIA Run:ai control plane.
- Remote control plane - Install the NVIDIA Run:ai cluster on a different Kubernetes cluster than the NVIDIA Run:ai control plane. Enter the Cluster URL. For more information, see Fully Qualified Domain Name requirement.
- Click CONTINUE
Installation Instructions
- Follow the installation instructions and run the commands provided on your Kubernetes cluster. For more information, see Install the Cluster.
- Click DONE
The cluster is displayed in the table with the status Waiting to connect. Once installation is complete, the cluster status changes to Connected.
Managing Network Topologies
Network topologies optimize placement and accelerate distributed workloads by keeping pods on nodes that are as close to each other as possible in the network. For more details, see Accelerating workloads with network topology-aware scheduling.
To add topologies that represent the cluster’s network:
- Select the cluster you want to add a network topology for
- In the top action bar, click NETWORK TOPOLOGIES
- In the Network Topologies Associated with <Cluster Name> modal, click + NETWORK TOPOLOGY
- Enter a unique name for the topology. If the name already exists, you will be requested to enter a different name.
- Click + LABEL to add the node label keys that represent the network hierarchy
- Order labels from farthest (first) to closest (last)
- Ensure the labels match the corresponding keys on the nodes. For example:
cloud.provider.com/topology-block,cloud.provider.com/topology-rack,kubernetes.io/hostname - Drag labels to adjust their order if needed
- Click SAVE NETWORK TOPOLOGY
After creating the network topology, the administrator must associate it with the relevant node pool(s). See Node pools for more details:
- If you are using the default node pool (that is, no additional node pools are defined), attach the topology to the default node pool.
- If different node pools have different topologies, each node pool must be linked to its corresponding topology.
- If the entire cluster shares the same topology, link the same topology to all node pools.
Removing a Cluster
- Select the cluster you want to remove
- Click REMOVE
- A dialog appears: Make sure to carefully read the message before removing
- Click REMOVE to confirm the removal.
Using the API
Go to the Clusters API reference to view the available actions
Using MCP
The NVIDIA Run:ai MCP server exposes Cluster and Infrastructure tools to inspect clusters via natural language:
get_cluster_physical_inventory- see a cluster’s GPU nodes, GPU models, and total, allocatable, allocated, and free GPUs, CPU cores, and memoryget_cluster_infrastructure_health- see nodes that are NotReady or Unknown, with their conditions, taints, and GPU countsget_cluster_metrics- track a cluster’s GPU and CPU capacity and utilization over time
See AI Agents for setup.
Troubleshooting
Before starting, make sure you have access to the Kubernetes cluster where NVIDIA Run:ai is deployed with the necessary permissions
Troubleshooting Scenarios
Cluster disconnected
Cluster disconnected
Description: When the cluster’s status is ‘disconnected’, there is no communication from the cluster services reaching the NVIDIA Run:ai Platform. This may be due to networking issues or issues with NVIDIA Run:ai services.
Mitigation:
-
Check NVIDIA Run:ai’s services status:
-
Open your terminal
-
Make sure you have access to the Kubernetes cluster with permissions to view pods
-
Copy and paste the following command to verify that NVIDIA Run:ai’s services are running:
-
If any of the services are not running, see the ‘cluster has service issues’ scenario.
-
-
Check the network connection
-
Open your terminal
-
Make sure you have access to the Kubernetes cluster with permissions to create pods
-
Copy and paste the following command to create a connectivity check pod:
-
Replace
<control-plane-endpoint>with the URL of the Control Plane in your environment. If the pod fails to connect to the Control Plane, check for potential network policies
-
-
Check and modify the network policies
-
Open your terminal
-
Copy and paste the following command to check the existence of network policies:
-
Review the policies to ensure that they allow traffic from the NVIDIA Run:ai namespace to the Control Plane. If necessary, update the policies to allow the required traffic
Example of allowing traffic:
-
Check infrastructure-level configurations:
- Ensure that firewall rules and security groups allow traffic between your Kubernetes cluster and the Control Plane
- Verify required ports and protocols:
- Ensure that the necessary ports and protocols for NVIDIA Run:ai’s services are not blocked by any firewalls or security groups
-
-
Check NVIDIA Run:ai services logs
-
Open your terminal
-
Make sure you have access to the Kubernetes cluster with permissions to view logs
-
Copy and paste the following commands to view the logs of the NVIDIA Run:ai services:
-
Try to identify the problem from the logs. If you cannot resolve the issue, continue to the next step.
-
-
Diagnosing internal network issues:
NVIDIA Run:ai operates on Kubernetes, which uses its internal subnet and DNS services for communication between pods and services. If you find connectivity issues in the logs, the problem might be related to Kubernetes’ internal networking.To diagnose DNS or connectivity issues, you can start a debugging Pod with networking utilities:
-
Copy the following command to your terminal, to start a pod with networking tools:
This command creates an interactive pod (
netutils) where you can use networking commands likeping,curl,nslookup, etc., to troubleshoot network issues. -
Use this pod to perform network resolution tests and other diagnostics to identify any DNS or connectivity problems within your Kubernetes Cluster.
-
Cluster disconnected due to a faulty GPU node
Cluster disconnected due to a faulty GPU node
Description: A single faulty GPU node can cause the entire cluster to show a Disconnected status in the NVIDIA Run:ai platform, even when all other nodes are healthy. This typically occurs when the node is stuck in GPU validation and the NVIDIA Run:ai system DaemonSets cannot complete initialization on it. This happens because the NVIDIA Run:ai platform evaluates cluster health based on all system DaemonSet pods being available. A single stuck pod causes the DaemonSet to report as unavailable, which cascades to the cluster-level health status.
Cordoning the node is not sufficient. A common first response is to cordon the faulty node using kubectl cordon. However, cordoning only prevents new pods from being scheduled on the node. It does not evict pods that already tolerate the node.kubernetes.io/unschedulable taint. The NVIDIA Run:ai system DaemonSets tolerate this taint by default. As a result, their pods remain running (or stuck) on the cordoned node, and the cluster continues to report as Disconnected.
Mitigation: These steps require cluster-admin permissions to taint nodes. To isolate the faulty node and allow the cluster to recover:
-
Add a custom taint to the faulty node to prevent new DaemonSet pods from being scheduled on it:
-
Identify the stuck DaemonSet pod on the faulty node:
-
Delete the stuck pod. The taint from step 1 prevents the DaemonSet controller from recreating it, which reduces the expected pod count and allows the DaemonSet to report as fully available:
-
Verify the cluster status returns to Connected in the NVIDIA Run:ai platform UI.
-
After the hardware issue on the node is resolved, remove the taint:
Note
If the node has no workloads worth preserving on its remaining healthy GPUs, a full drain and reboot (kubectl drain <node-name> --ignore-daemonsets --delete-emptydir-data) is an alternative approach. This resolves the underlying hardware fault directly and the taint workaround is not needed.
Cluster has service issues
Cluster has service issues
Description: When a cluster’s status is ‘Has service issues`, it means that one or more NVIDIA Run:ai services running in the cluster are not available.
Mitigation:
- Verify non-functioning services
-
Open your terminal
-
Make sure you have access to the Kubernetes cluster with permissions to view the
runaiconfigresource -
Copy and paste the following command to determine which services are not functioning:
-
- Check for Kubernetes events
-
Open your terminal
-
Make sure you have access to the Kubernetes cluster with permissions to view events
-
Copy and paste the following command to get all Kubernetes events:
-
- Inspect resource details
-
Open your terminal
-
Make sure you have access to the Kubernetes cluster with permissions to describe resources
-
Copy and paste the following command to check the details of the required resource:
-
Cluster is waiting to connect
Cluster is waiting to connect
Description: When the cluster’s status is ‘waiting to connect’, it means that no communication from the cluster services reaches the NVIDIA Run:ai Platform. This may be due to networking issues or issues with NVIDIA Run:ai services.
Mitigation:
- Check NVIDIA Run:ai’s services status
-
Open your terminal
-
Make sure you have access to the Kubernetes cluster with permissions to view pods
-
Copy and paste the following command to verify that NVIDIA Run:ai’s services are running:
-
If any of the services are not running, see the ‘cluster has service issues’ scenario.
-
- Check the network connection
-
Open your terminal
-
Make sure you have access to the Kubernetes cluster with permissions to create pods
-
Copy and paste the following command to create a connectivity check pod:
-
Replace
<control-plane-endpoint>with the URL of the Control Plane in your environment. If the pod fails to connect to the Control Plane, check for potential network policies:
-
- Check and modify the network policies
-
Open your terminal
-
Copy and paste the following command to check the existence of network policies:
-
Review the policies to ensure that they allow traffic from the NVIDIA Run:ai namespace to the Control Plane. If necessary, update the policies to allow the required traffic
-
Example of allowing traffic:
-
Check infrastructure-level configurations:
-
Ensure that firewall rules and security groups allow traffic between your Kubernetes cluster and the Control Plane
-
Verify required ports and protocols:
- Ensure that the necessary ports and protocols for NVIDIA Run:ai’s services are not blocked by any firewalls or security groups
-
- Check NVIDIA Run:ai services logs
-
Open your terminal
-
Make sure you have access to the Kubernetes cluster with permissions to view logs
-
Copy and paste the following commands to view the logs of the NVIDIA Run:ai services:
-
Try to identify the problem from the logs. If you cannot resolve the issue, continue to the next step
-
Cluster is missing prerequisites
Cluster is missing prerequisites
Description: When a cluster’s status displays Missing prerequisites, it indicates that at least one of the Mandatory Prerequisites has not been fulfilled. In such cases, NVIDIA Run:ai services may not function properly.
One specific case is GPU fractions readiness: if the cluster’s NVIDIA GPU Operator version does not meet the minimum required version, or the cluster otherwise does not meet the prerequisites for GPU fractions, the status message names the reason and states that GPU fractions are not supported. This does not block the rest of the cluster from functioning; only GPU fractions are affected. To resolve this, update the installation to meet the GPU fractions prerequisites, for example by upgrading the NVIDIA GPU Operator to the required version. See Prerequisites and Features for the required versions.
Mitigation:
If you have ensured that all prerequisites are installed and the status still shows missing prerequisites, follow these steps:
- Check the message in the NVIDIA Run:ai platform for further details regarding the missing prerequisites.
- Inspect the
runai-publicConfigMap:-
Open your terminal. In the terminal, type the following command to list all ConfigMaps in the
runainamespace:
-
- Describe the ConfigMap
-
Locate the ConfigMap named
runai-publicfrom the list -
To view the detailed contents of this ConfigMap, type the following command:
-
- Find Missing Prerequisites
- In the output displayed, look for a section labeled
dependencies.required - This section provides detailed information about any missing resources or prerequisites. Review this information to identify what is needed
- In the output displayed, look for a section labeled