

Workloads
This guide describes how to view, monitor, and manage workloads running on the NVIDIA Run:ai platform.
Workloads Table
The Workloads table can be found under Workload manager in the NVIDIA Run:ai platform.
The workloads table provides a list of all the workloads scheduled on the NVIDIA Run:ai Scheduler, and allows you to manage them.
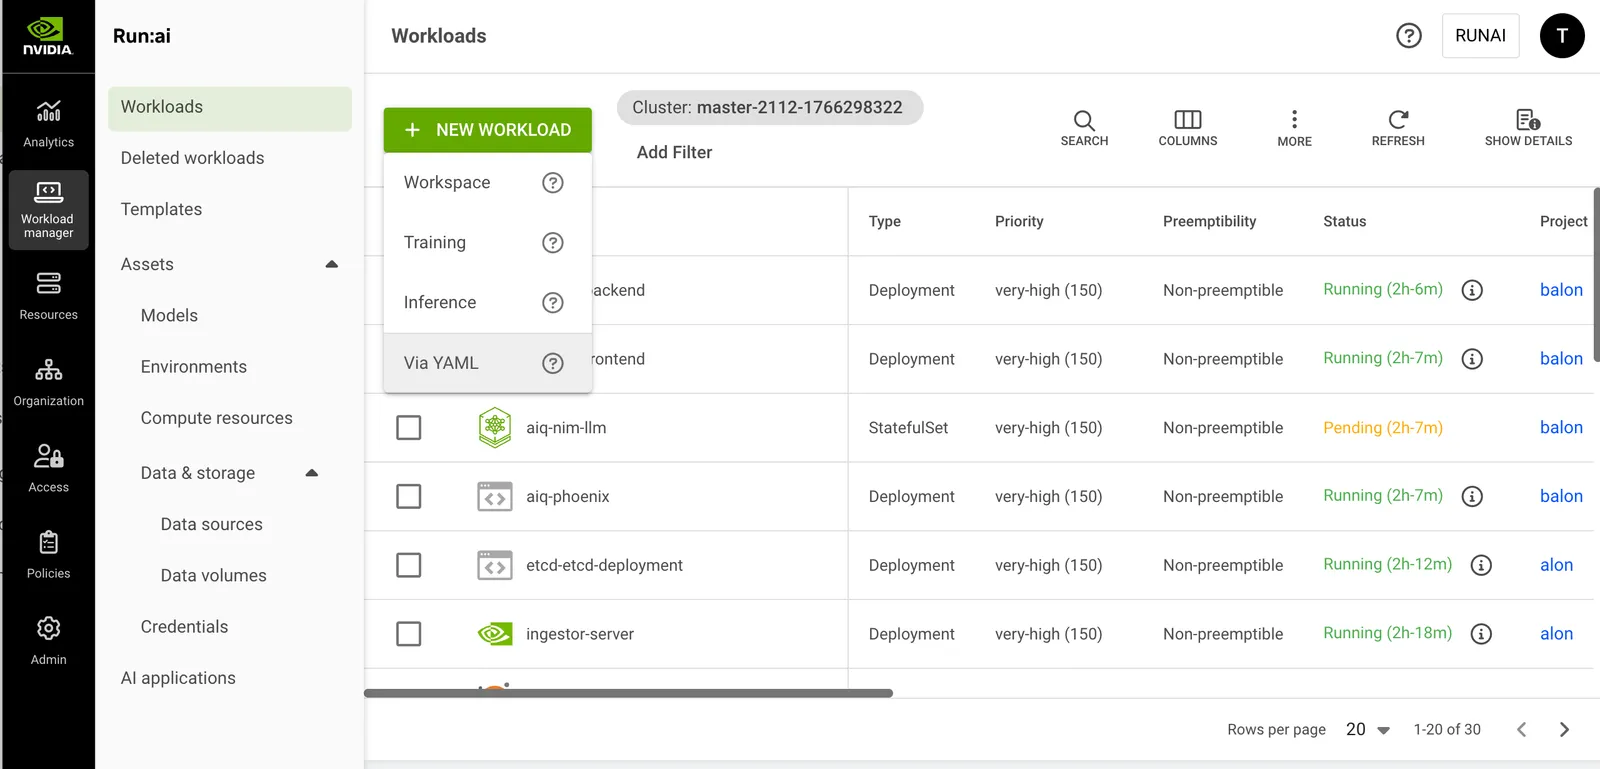
The Workloads table consists of the following columns:
Workload Status
The following table describes the different phases in a workload life cycle. The UI provides additional details for some of the below workload statuses which can be viewed by clicking the icon next to the status.
Pods Associated with the Workload
Click one of the values in the Running/requested pods column, to view the list of pods and their parameters.
Connections Associated with the Workload
A connection refers to the method by which you can access and interact with the running workloads. It is essentially the “doorway” through which you can reach and use the applications (tools) these workloads provide.
Click one of the values in the Connection(s) column, to view the list of connections and their parameters. Connections are network interfaces that communicate with the application running in the workload. Connections are either the URL the application exposes or the IP and the port of the node that the workload is running on.
Data Sources Associated with the Workload
Click one of the values in the Data source(s) column to view the list of data sources and their parameters.
Customizing the Table View
- Filter - Click ADD FILTER, select the column to filter by, and enter the filter values
- Search - Click SEARCH and type the value to search by
- Sort - Click each column header to sort by
- Column selection - Click COLUMNS and select the columns to display in the table
- Download table - Click MORE and then Click Download as CSV. Export to CSV is limited to 20,000 rows.
- Refresh - Click REFRESH to update the table with the latest data
- Show/Hide details - Click to view additional information on the selected row
Show/Hide Details
Click a row in the Workloads table and then click the SHOW DETAILS button at the upper-right side of the action bar. The details pane appears, presenting the following tabs:
Event History
Displays the workload status over time. It displays events describing the workload lifecycle and alerts on notable events. Use the filter to search through the history for specific events.
Metrics
The Metrics screen contains a dropdown allowing you to switch between the following metrics views:
- Resource utilization - Displays general GPU, CPU and network metrics
- GPU profiling - Shows additional NVIDIA-specific metrics
- Inference - Displays inference workload metrics including throughput, latency, and replica counts
- NVIDIA NIM - Displays NIM-specific workload metrics such as request concurrency, request counts, time to first token (TTFT), latency percentiles, and GPU KV-cache utilization
- vLLM - Displays vLLM-specific workload metrics such as request concurrency, request counts, token throughput, time to first token (TTFT), latency percentiles, and GPU KV-cache utilization
Note
GPU profiling metrics are disabled by default. If unavailable, your administrator must enable it under General settings → Analytics → GPU profiling metrics. Before enabling, the administrator must configure GPU profiling through the DCGM Exporter and NVIDIA Run:ai Prometheus integration. For configuration steps, see GPU profiling metrics.
Resource Utilization
- GPU utilization
Per GPU graph and an average of all GPUs graph, all on the same chart, along an adjustable period allows you to see the trends of all GPUs compute utilization (percentage of GPU compute) in this node. - GPU memory utilization
Per GPU graph and an average of all GPUs graph, all on the same chart, along an adjustable period allows you to see the trends of all GPUs memory usage (percentage of the GPU memory) in this node. - CPU compute utilization
The average of all CPUs’ cores compute utilization graph, along an adjustable period allows you to see the trends of CPU compute utilization (percentage of CPU compute) in this node. - CPU memory utilization
The utilization of all CPUs memory in a single graph, along an adjustable period allows you to see the trends of CPU memory utilization (percentage of CPU memory) in this node. - CPU memory usage
The usage of all CPUs memory in a single graph, along an adjustable period allows you to see the trends of CPU memory usage (in GB or MB of CPU memory) in this node. - NVLink bandwidth total
The rate of data transmitted / received over NVLink, not including protocol headers, in bytes per second. The value represents an average over a time interval and is not an instantaneous value. The rate is averaged over the time interval. For example, if 1 GB of data is transferred over 1 second, the rate is 1 GB/s regardless of the data transferred at a constant rate or in bursts. The theoretical maximum NVLink Gen2 bandwidth is 25 GB/s per link per direction.
GPU Profiling
Select GPU profiling from the dropdown to view extended GPU device-level metrics such as memory bandwidth, SM occupancy, and other data.
- For the full list of supported metrics, see Metrics and telemetry.
- For definitions and technical descriptions, refer to the NVIDIA documentation.
Inference
For inference workloads, select Inference from the dropdown to view dedicated inference metrics:
- Throughput
Displays the total number of inference requests per second (RPS). The chart shows request throughput over time, helping you analyze traffic patterns and scaling needs. - Latency
Shows the average response time for inference requests in milliseconds. Use this chart to track performance, identify bottlenecks, and optimize model serving. - Replicas
Displays the desired vs. actual number of replicas for inference workloads. This helps you understand autoscaling behavior and whether workloads are scaling as expected.
NVIDIA NIM
For NVIDIA NIM workloads, select NVIDIA NIM from the dropdown to view dedicated NIM-specific metrics:
- Request concurrency by status
Shows the number of inference requests that are currently running or waiting, along with the model’s maximum allowed concurrency. - Request count by status
Displays the total number of inference requests completed over time, categorized as succeeded or failed. - Time to first token (TTFT)
Shows a histogram of the time (in seconds) it takes for the model to generate the first token. - Time to first token (TTFT) by percentiles
Tracks how long it takes for the model to generate the first token of a response, with percentile breakdowns (p50, p90, p99) for performance analysis. - End to end request latency
Shows a histogram of the total request latency (in seconds), measured from request submission to completion. - End to end request latency by percentiles
Measures the total response time from request submission to completion, with percentile values (p50, p90, p99) to help identify latency patterns. - GPU KV cache utilization
Reports the percentage of GPU key-value cache currently in use over time.
vLLM
For vLLM workloads, select vLLM from the dropdown to view dedicated vLLM-specific metrics:
- Request concurrency by status
Shows the number of inference requests that are currently running or waiting. - Request count by status
Displays the total number of inference requests completed over time, categorized as succeeded or failed. - Request success rate
Shows the percentage of completed requests that succeeded over time. - GPU KV cache utilization
Reports the percentage of GPU key-value cache currently in use over time. - Token throughput
Displays the number of prompt and generation tokens processed per second. - Time to first token (TTFT)
Shows a histogram of the time (in seconds) it takes for the model to generate the first token. - Time to first token (TTFT) by percentiles
Tracks how long it takes for the model to generate the first token of a response, with percentile breakdowns (p50, p95, p99) for performance analysis. - End to end request latency
Shows a histogram of the total request latency (in seconds), measured from request submission to completion. - End to end request latency by percentiles
Measures the total response time from request submission to completion, with percentile values (p50, p95, p99) to help identify latency patterns. - Queue time percentiles
Tracks how long requests wait before processing begins, with percentile breakdowns (p50, p95, p99). - Latency phase breakdown
Shows percentile breakdowns (p50, p95, p99) of time spent in the prefill, decode, and inter-token latency phases of a request.
Navigating the Graphs
- For GPUs charts - Click the GPU legend on the right-hand side of the chart, to activate or deactivate any of the GPU lines.
- You can click the date picker to change the presented period
- You can use your mouse to mark a sub-period in the graph for zooming in, and use Reset zoom to go back to the preset period
- Changes in the period affect all graphs on this screen.
Pods
Displays the list of pods running for the workload. Each row shows the pod name, status, the node and node pool it runs on, its container image, and GPU compute and memory allocations. Use the Logs and Terminal links in each row to jump directly to that pod’s logs or open a terminal session.
Logs
Workload events are ordered in chronological order. The logs contain events from the workload’s lifecycle to help monitor and debug issues.
You can view logs per pod and per container. Use the dropdown menus to select the specific pod and the container within the pod you want to inspect. Use the Container’s logs from dropdown to switch between the current and previous container instance logs.
Logs can also be downloaded for offline review. Each downloaded log file includes a unique name in the format:
Note
Logs are available only while the workload is in a non-terminal state. Once the workload completes or fails, logs are no longer accessible.
Terminal
Workload terminal provides interactive shell access to running containers and are ordered by creation time. The terminal reflects the live state of the container and is intended for real-time inspection, debugging, and manual intervention during execution.
You can open a terminal per pod and per container. Use the dropdown menus to select the specific pod and the container within the pod you want to connect to.
Each terminal session is ephemeral and exists only for the duration of the connection. Closing the terminal ends the session, and no session history is preserved.
Note
Terminal access is available only while the workload is in a running state. Once the workload completes, fails, or is suspended, terminal access is no longer available.
YAML
Note
The YAML tab is available for supported workload types only.
Displays the live Kubernetes custom resource (CR) of the selected workload element as YAML, including its spec, status, and metadata (managed fields are omitted). The CR reflects the element’s current state in the cluster, so you can inspect the exact resource definition as it is reconciled.
The YAML tab includes two actions:
- Copy to clipboard - Copies the YAML to the clipboard.
- Download YAML - Downloads the YAML as a file named
<workload-name>.yaml.
The YAML tab is available in both the side panel and the expanded Structure view.
Structure
Note
The Structure tab is available for supported workload types submitted via YAML only.
Displays a visual diagram of the workload’s hierarchy of workload elements. The diagram shows a root workload node at the top, with child elements arranged beneath it according to their parent-child relationships. Each element shows its GPU and CPU compute and memory allocations and its pod count.
If the workload exposes network endpoints, the diagram shows each endpoint as a separate node to the right of the root workload node, displaying the endpoint URL. Click the copy icon on an endpoint node to copy its URL.
The Structure tab is available in two views:
-
Side panel view - The Structure tab renders inside the workload details pane on the right side of the Workloads table. Use this view for quick inspection without leaving the table - for example, to confirm that all child elements of a recently submitted workload have been created and are running.
-
Expanded view - Each element in the diagram has a Maximize view icon in its lower-right corner. Click it to open the Workload structure in a separate, full-screen view that gives you more room to trace dependencies across deeply nested elements and to inspect resource allocations and pod status side by side. The diagram appears on the left and a resizable context panel on the right. The context panel exposes the following tabs:
- Event history - Workload lifecycle events and alerts. This tab is workload-scoped. See Event History for more details.
- Metrics - Resource utilization for the selected workload element. See Metrics for more details.
- Pods - List of pods for the selected workload element. See Pods Associated with the Workload for more details.
- Logs - Pod logs for the selected workload element. See Logs for more details.
- Terminal - Shell access to a running pod from the selected workload element. See Terminal for more details.
- YAML - The selected workload element’s CR as YAML, with copy and download actions. See YAML for more details.
- Details - The workload’s configuration details. This tab is workload-scoped.
Adding a New Workload
Before starting, make sure you have created a project or have one created for you to work with workloads.
To create a new workload:
- Click +NEW WORKLOAD
- Select a workload:
- Workspace - Interactive development environment for building and testing. Recommended for lightweight experimentation and debugging.
- Training - Workload for standard or distributed training models. Recommended for resource-intensive model development.
- Inference - Deployment of an AI model for serving via an API. Recommended for production use.
- Via YAML - Submission of a range of supported workload types using a standard Kubernetes YAML
- Click CREATE WORKLOAD
Stopping a Workload
Stopping one or more workloads kills their pods and releases the associated resources.
- Select one or more workloads from the list
- Click Stop
Running a Workload
Running one or more workloads spins up new pods and resumes the workload execution from where it was stopped.
- Select one or more workloads that you want to resume
- Click RUN
Known Kubernetes Issue: Batch Job Workloads May Get Stuck in Resuming
A known Kubernetes issue can cause batch job workload types (such as Job, PyTorchJob, and RayJob) to get stuck in the Resuming state after a Run action. The issue is fixed in the following Kubernetes releases (or newer): v1.32.9, v1.33.6, v1.34.2, v1.35.0. If your cluster runs an older version, upgrade to a fixed Kubernetes release to resolve this.
Connecting to a Workload
To connect to an application running in the workload (for example, Jupyter Notebook)
- Select the workload you want to connect
- Click CONNECT
- If the workload has only one configured tool, the connection opens directly in a new browser tab
- If multiple tools are configured, a dropdown list appears where you can select the desired tool
- The selected tool is opened in a new tab on your browser
Copying a Workload
- Select the workload you want to copy
- Click MAKE A COPY
- Enter a name for the workload. The name must be unique.
- Update the workload and click CREATE WORKLOAD
Deleting a Workload
- Select the workload you want to delete
- Click DELETE
- On the dialog, click DELETE to confirm the deletion
Note
Once a workload is deleted, it appears under Workload manager -> Deleted workloads. Deleted workloads remain available for 14 days before being permanently removed.
Managing Workload Properties
Administrators can change the default priority and category assigned to a workload type by updating the mapping using the NVIDIA Run:ai API:
- To update the priority mapping, see Workload priority control
- To update the category mapping, see Monitor workloads by category
Using API
Go to the Workloads API reference to view the available actions.
Using CLI
Go to the CLI command reference to view available actions.
Using MCP
The NVIDIA Run:ai MCP server exposes several Workloads tools to inspect and manage workloads via natural language:
list_workloads- list workloads with their status, project, cluster, and node poolget_workload_status- check a workload’s current state and whyget_workload_pods- see a workload’s pods and where they’re runningget_workload_metrics- track GPU, CPU, and memory usage over timeget_workload_history- see state transitions and revision historyget_workload_spec- see what a workload requested and where it’s placedget_workloads_summary- count running, pending, and failed workloadsmanage_workload_operations- stop, restart, update, or delete a workload
See AI Agents for setup.
Built-in Workload Environment Variables
Platform-Defined Variables
When a workload runs on the NVIDIA Run:ai platform, a number of environment variables are automatically injected into every container. These variables provide metadata about the workload’s context, such as the project it belongs to, the workload name, and a unique run identifier.
Usage Example in Python
Framework-Defined Environment Variables
In addition to NVIDIA Run:ai’s built-in environment variables, distributed training frameworks inject their own variables to coordinate communication, rank assignment, and cluster topology. These variables differ by framework and are automatically managed by the training operator (for example, Kubeflow’s Training Operator or MPI Operator). The following table lists some of the most common framework-defined variables supported for distributed training. For a complete list of environment variables, refer to the official documentation for each framework.
Troubleshooting
To understand the condition of the workload, review the workload status in the Workload table. For more information, see check the workload’s event history.
Listed below are a number of known issues when working with workloads and how to fix them: