VSS Warehouse Blueprint - 2D Vision AI Profile#
Overview#
Introduction#
The VSS Warehouse 2D Blueprint is a comprehensive guide to building a 2D intelligent video analytics system. It provides a detailed overview of the system architecture, data flow, and key components.
Deployment Architecture#
Components and Interactions#
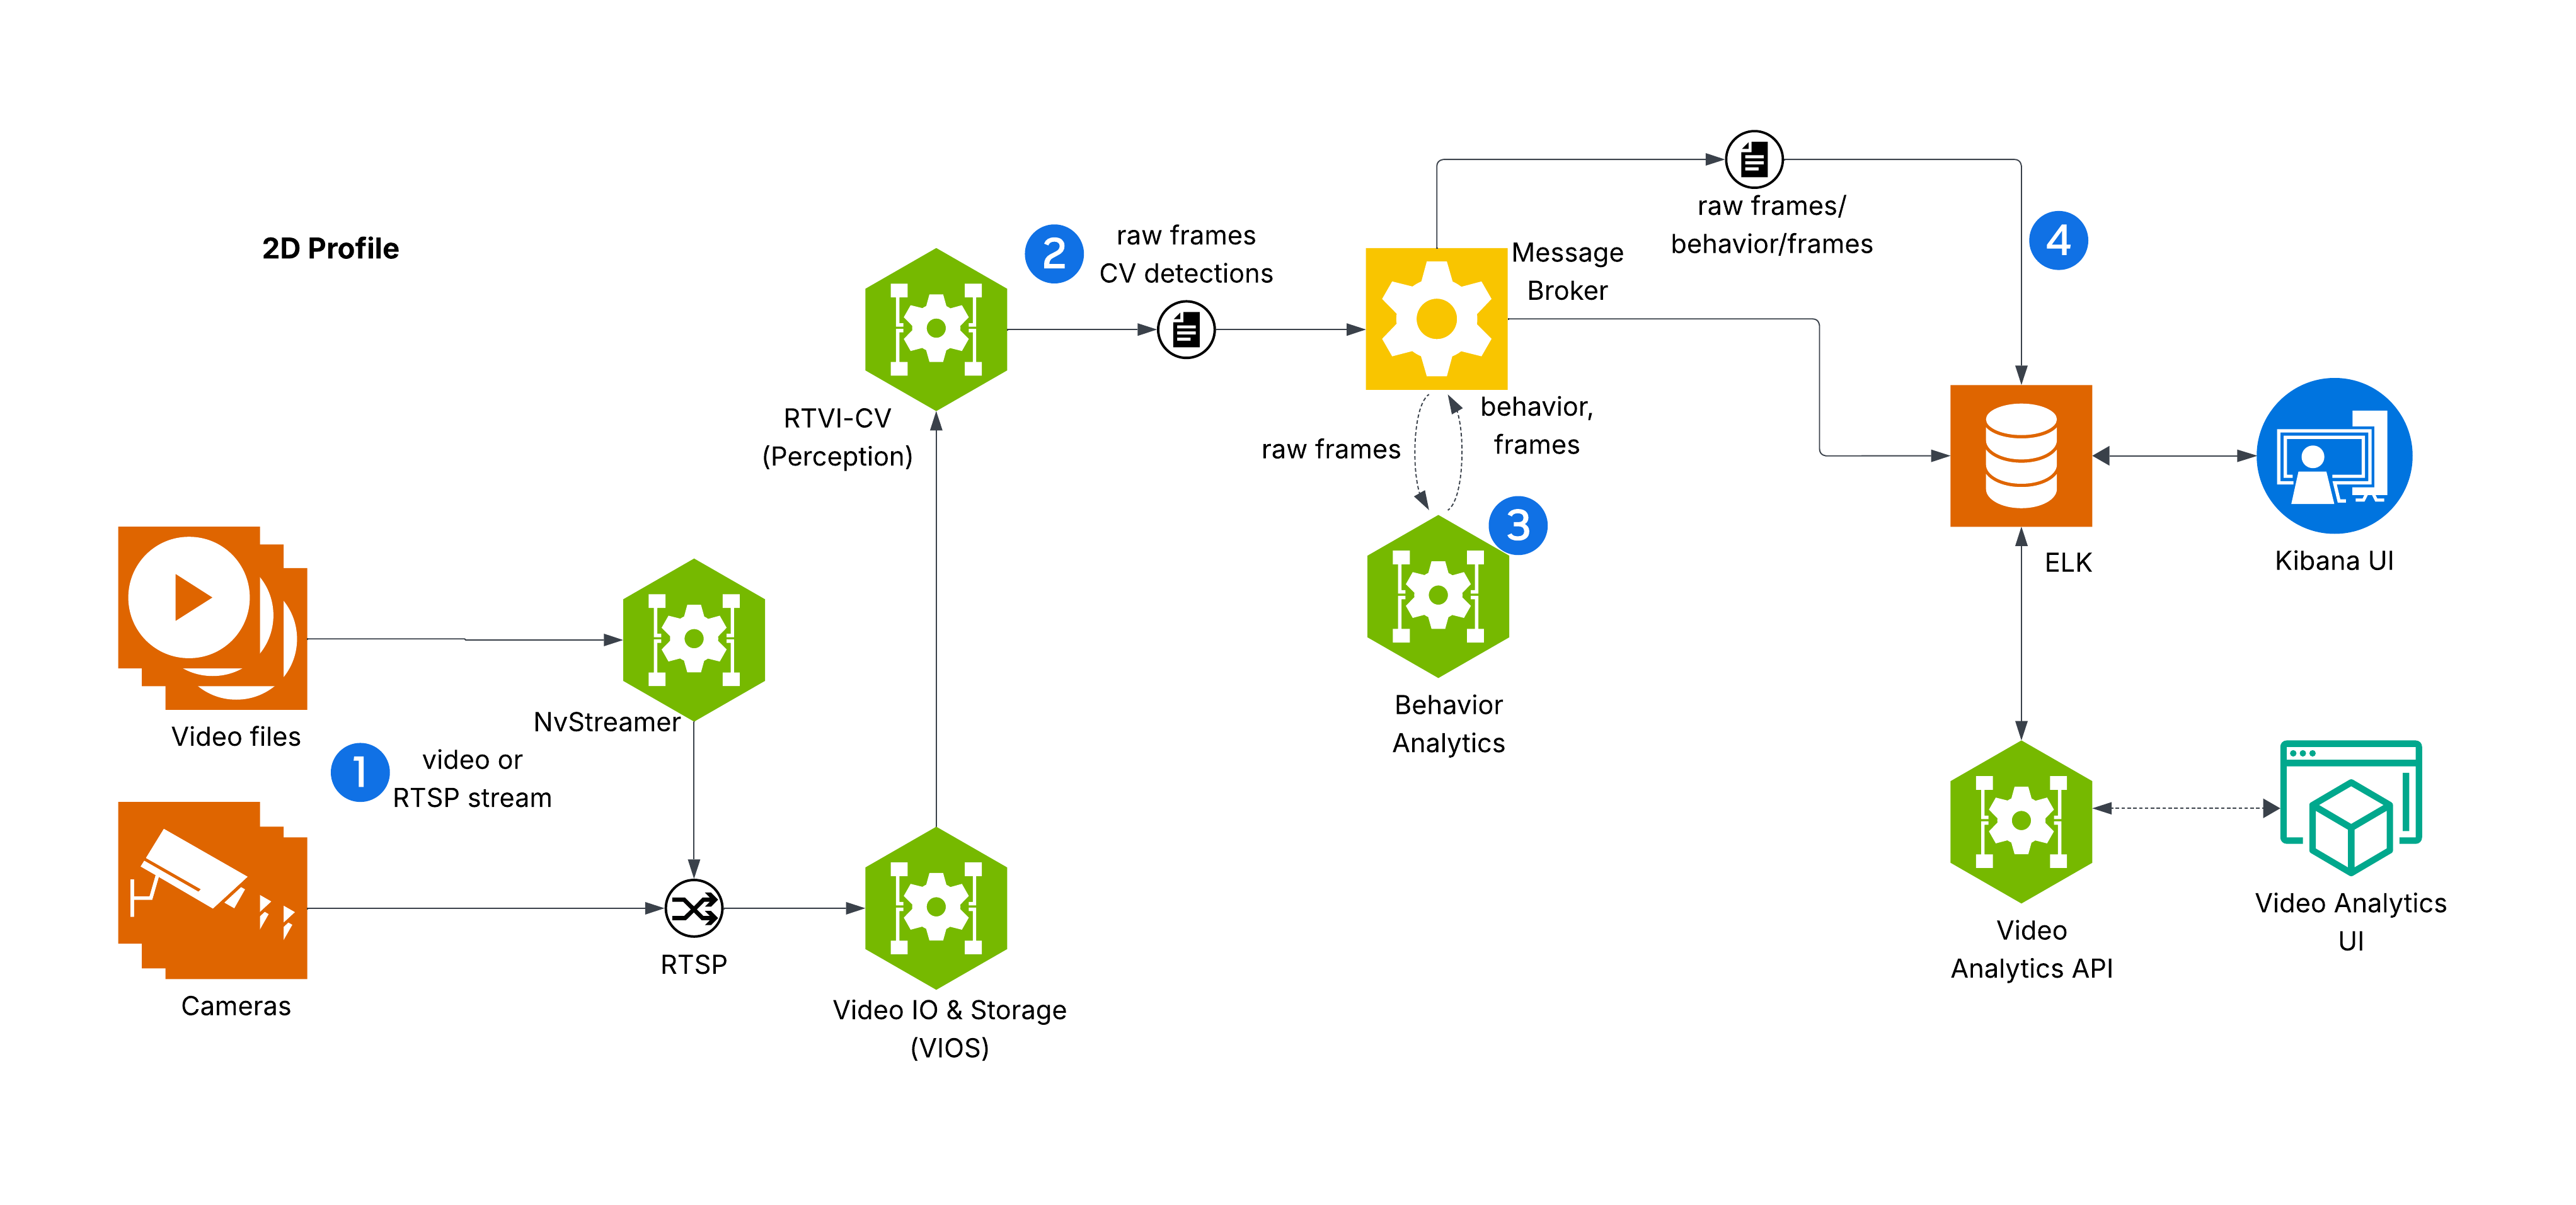
The diagram depicts VSS Warehouse 2D Blueprint, emphasizing 2D single-camera detection, tracking, and behavior analytics for safety events and metrics. Below is a breakdown of the components and their interactions.
Input Source
Videos: Raw video data stored in a filesystem, serving as input for processing.
NvStreamer (link): A microservice that streams videos via RTSP (Real-Time Streaming Protocol) to the VIOS (Video IO & Storage). NvStreamer can be swapped with real-world cameras.
Video IO & Storage (VIOS) (link)
VIOS ingests video streams from NvStreamer via RTSP.
It records the streams and forwards them (via RTSP) to the DeepStream microservice for further processing.
DeepStream (link)
DeepStream processes RTSP streams for 2D single-camera detection and tracking, utilizing the RT-DETR (Real-Time Detection Transformer) model (link) to generate precise 2D bounding boxes for diverse objects including people, humanoid robots, autonomous vehicles, and warehouse equipment.
RT-DETR features an EfficientViT/L2 backbone, pretrained on warehouse scene datasets for accurate 2D object detection in industrial environments.
It sends frame data, including detected and tracked object IDs, in Protobuf format to the message broker via the
mdx-rawtopic.
Message Broker (Kafka or Redis)
The message broker serves as the central hub for data distribution, using Protobuf for all data exchanges.
Kafka (Kafka): High-throughput message broker optimized for datacenter deployments with robust persistence and scalability.
Redis Streams: Lightweight message broker ideal for edge deployments with minimal memory footprint and low-latency requirements.
It also functions as a control bus, managing notifications (in JSON, via
mdx-notification) for calibration updates, such as new ROI or tripwire definitions.
Behavior Analytics (Behavior Analytics)
This microservice consumes
mdx-rawdata (Protobuf) from the message broker.It processes the data to generate behavior analytics, safety insights, and metrics.
The resulting data, in Protobuf format, is sent back to the message broker for indexing into Elasticsearch.
Storage
ELK (Elasticsearch, Logstash, Kibana) (ELK): Logstash retrieves mdx-raw outputs and safety violation frames from the message broker, converts Protobuf to JSON, stores the data in Elasticsearch, and supports querying and visualization.
Visualization
Kibana UI (link): A user interface for visualizing analytics data stored in Elasticsearch.
VIOS UI (link): A separate interface for interacting with the VIOS system, receiving JSON notifications from the message broker.
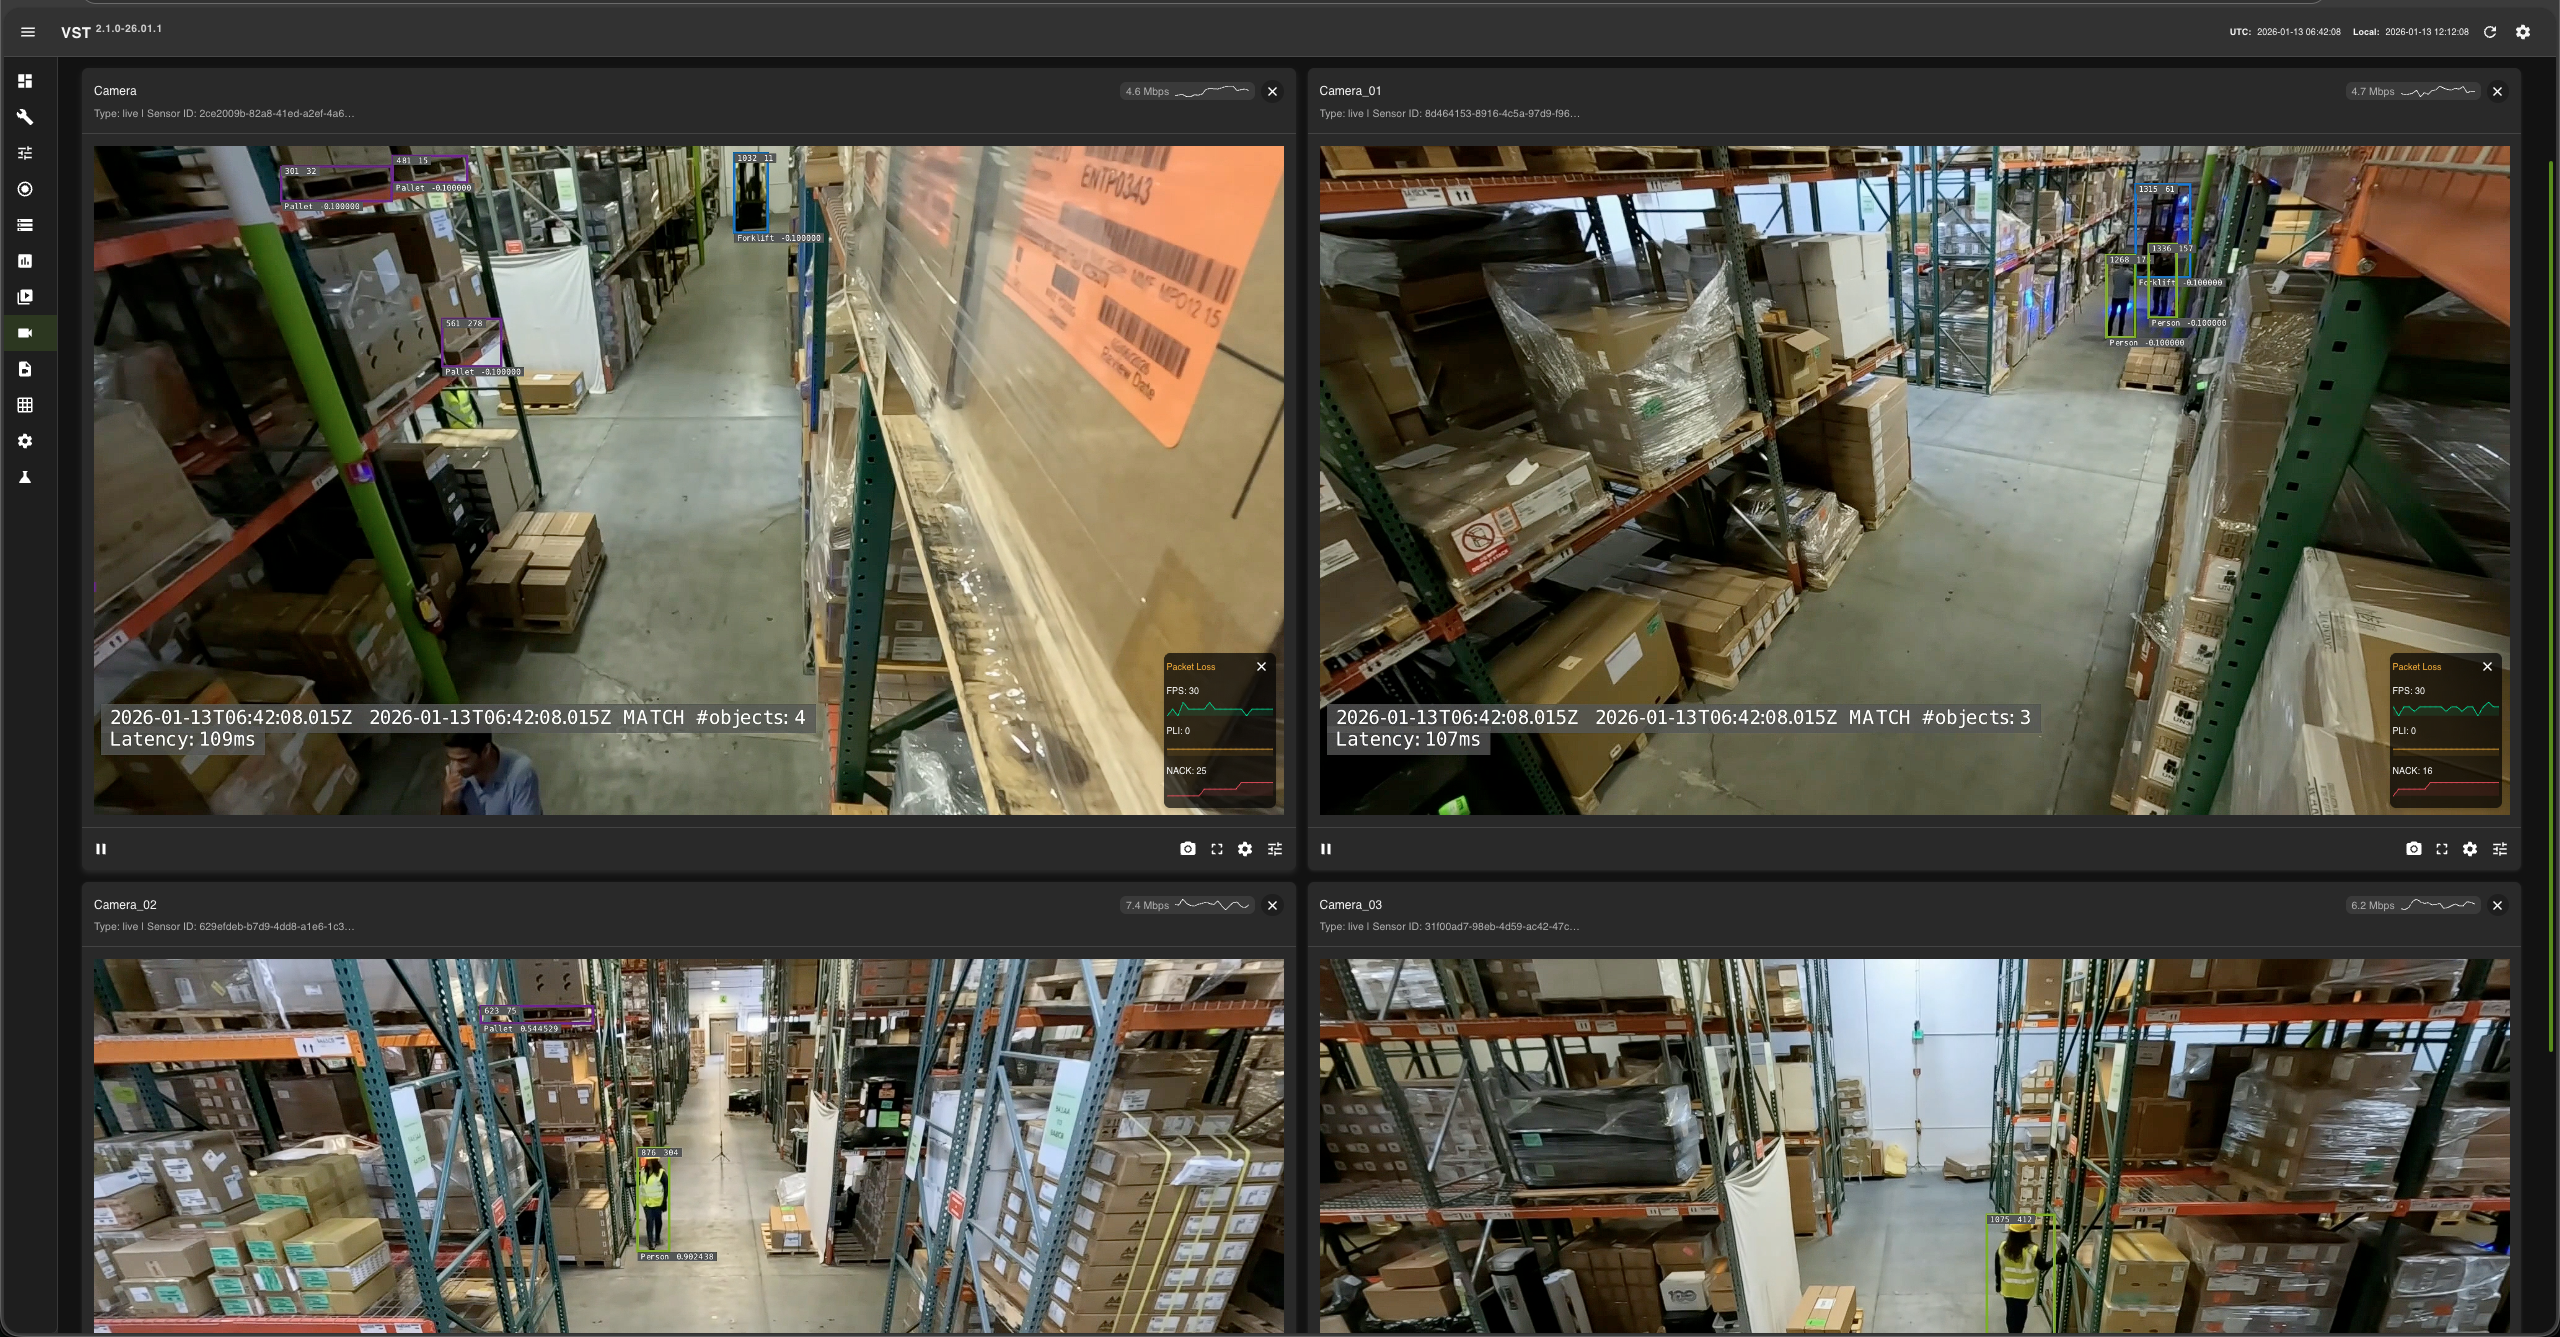
Video Analytics UI (link): A browser-based user interface for visualizing the moving objects, live camera feeds along with events and metrics. This is a sample UI to interact with the underlying data through Video Analytics API.
External Interfaces
API Gateway and MCP (API Gateway/MCP): Enables external systems to interact with the events data through API calls.
Key Technologies#
Microservices: Components like NvStreamer, VIOS, DeepStream, and Behavior Analytics are modular microservices.
RTSP: Facilitates real-time video streaming.
Protobuf: Ensures efficient, compact data exchange.
Message Broker: Manages data distribution and control messaging.
ELK Stack: Supports storage, logging, and visualization.
JSON: Used for notifications and calibration data.
Setup and Configuration#
Testing and Validation#
Kibana UI#
Note
In the new Kibana UI (versions 8.0 and later), “Index Patterns” have been renamed to “Data Views”.
Check for Events, Frames and Behavior Data Views in Kibana
Launch Chrome browser
In the address bar enter
http://<IP_address>:5601
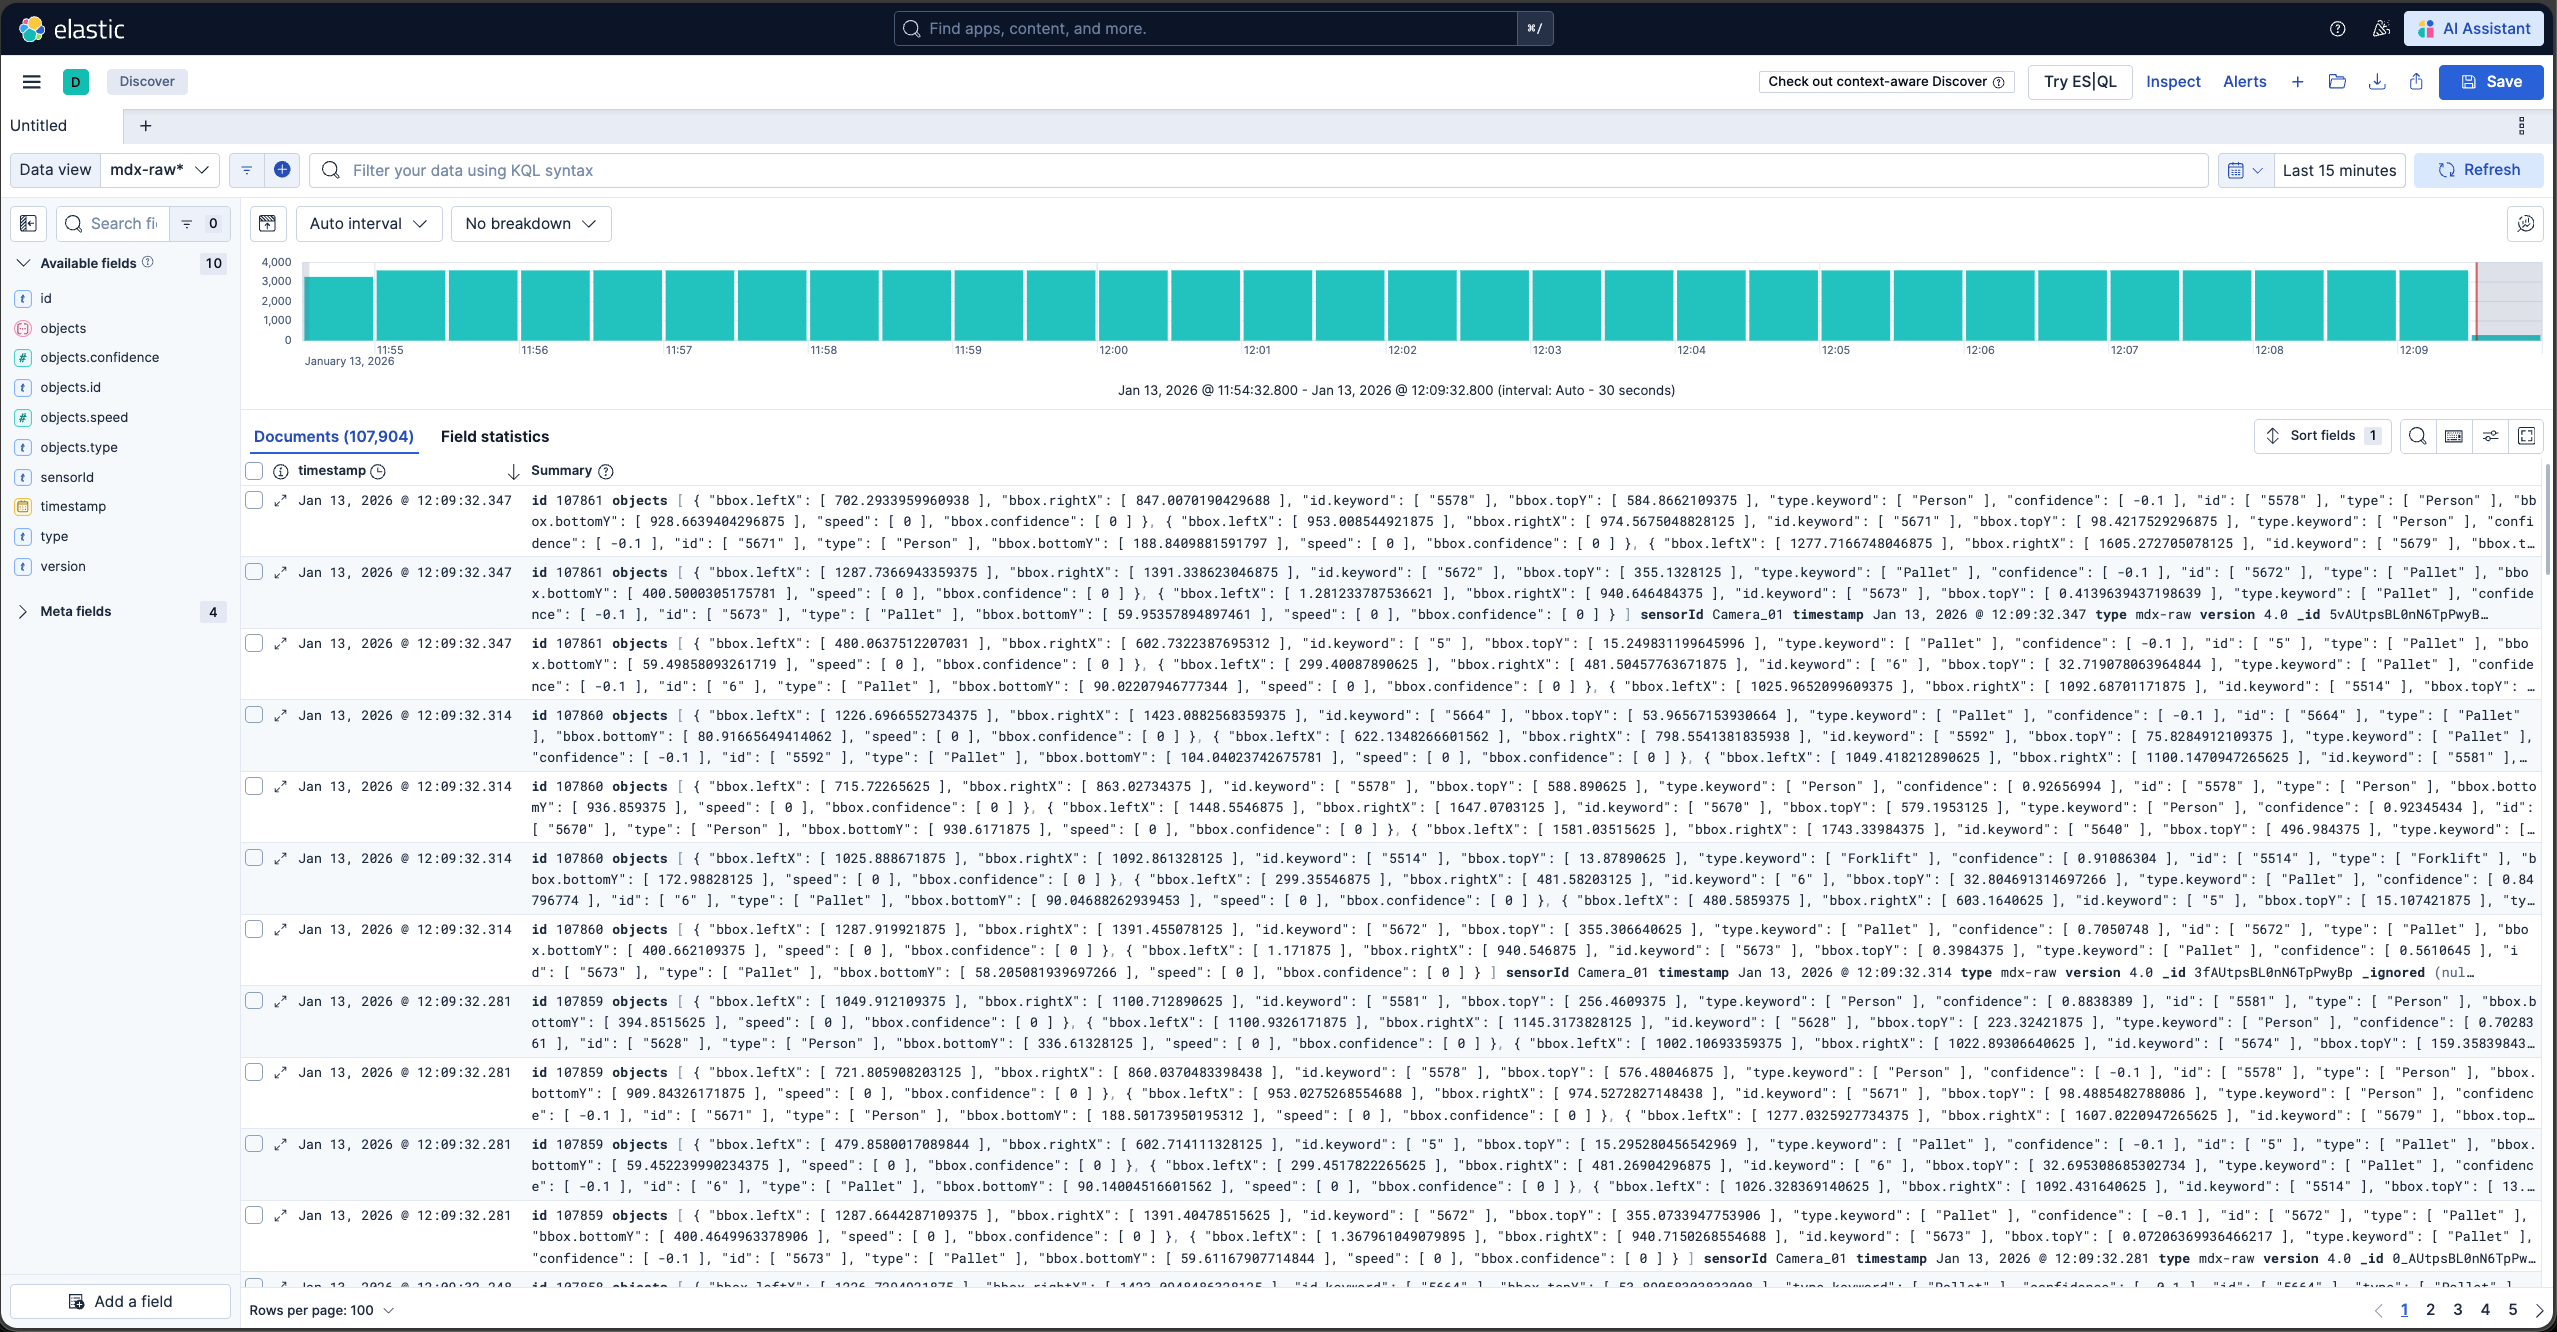
In the user interface, navigate to the Management -> Stack Management section and select Data Views under Kibana. If the data views are not visible, create new data view (via “Create data view” button on the top right corner) for mdx-raw, mdx-frames and mdx-behavior.
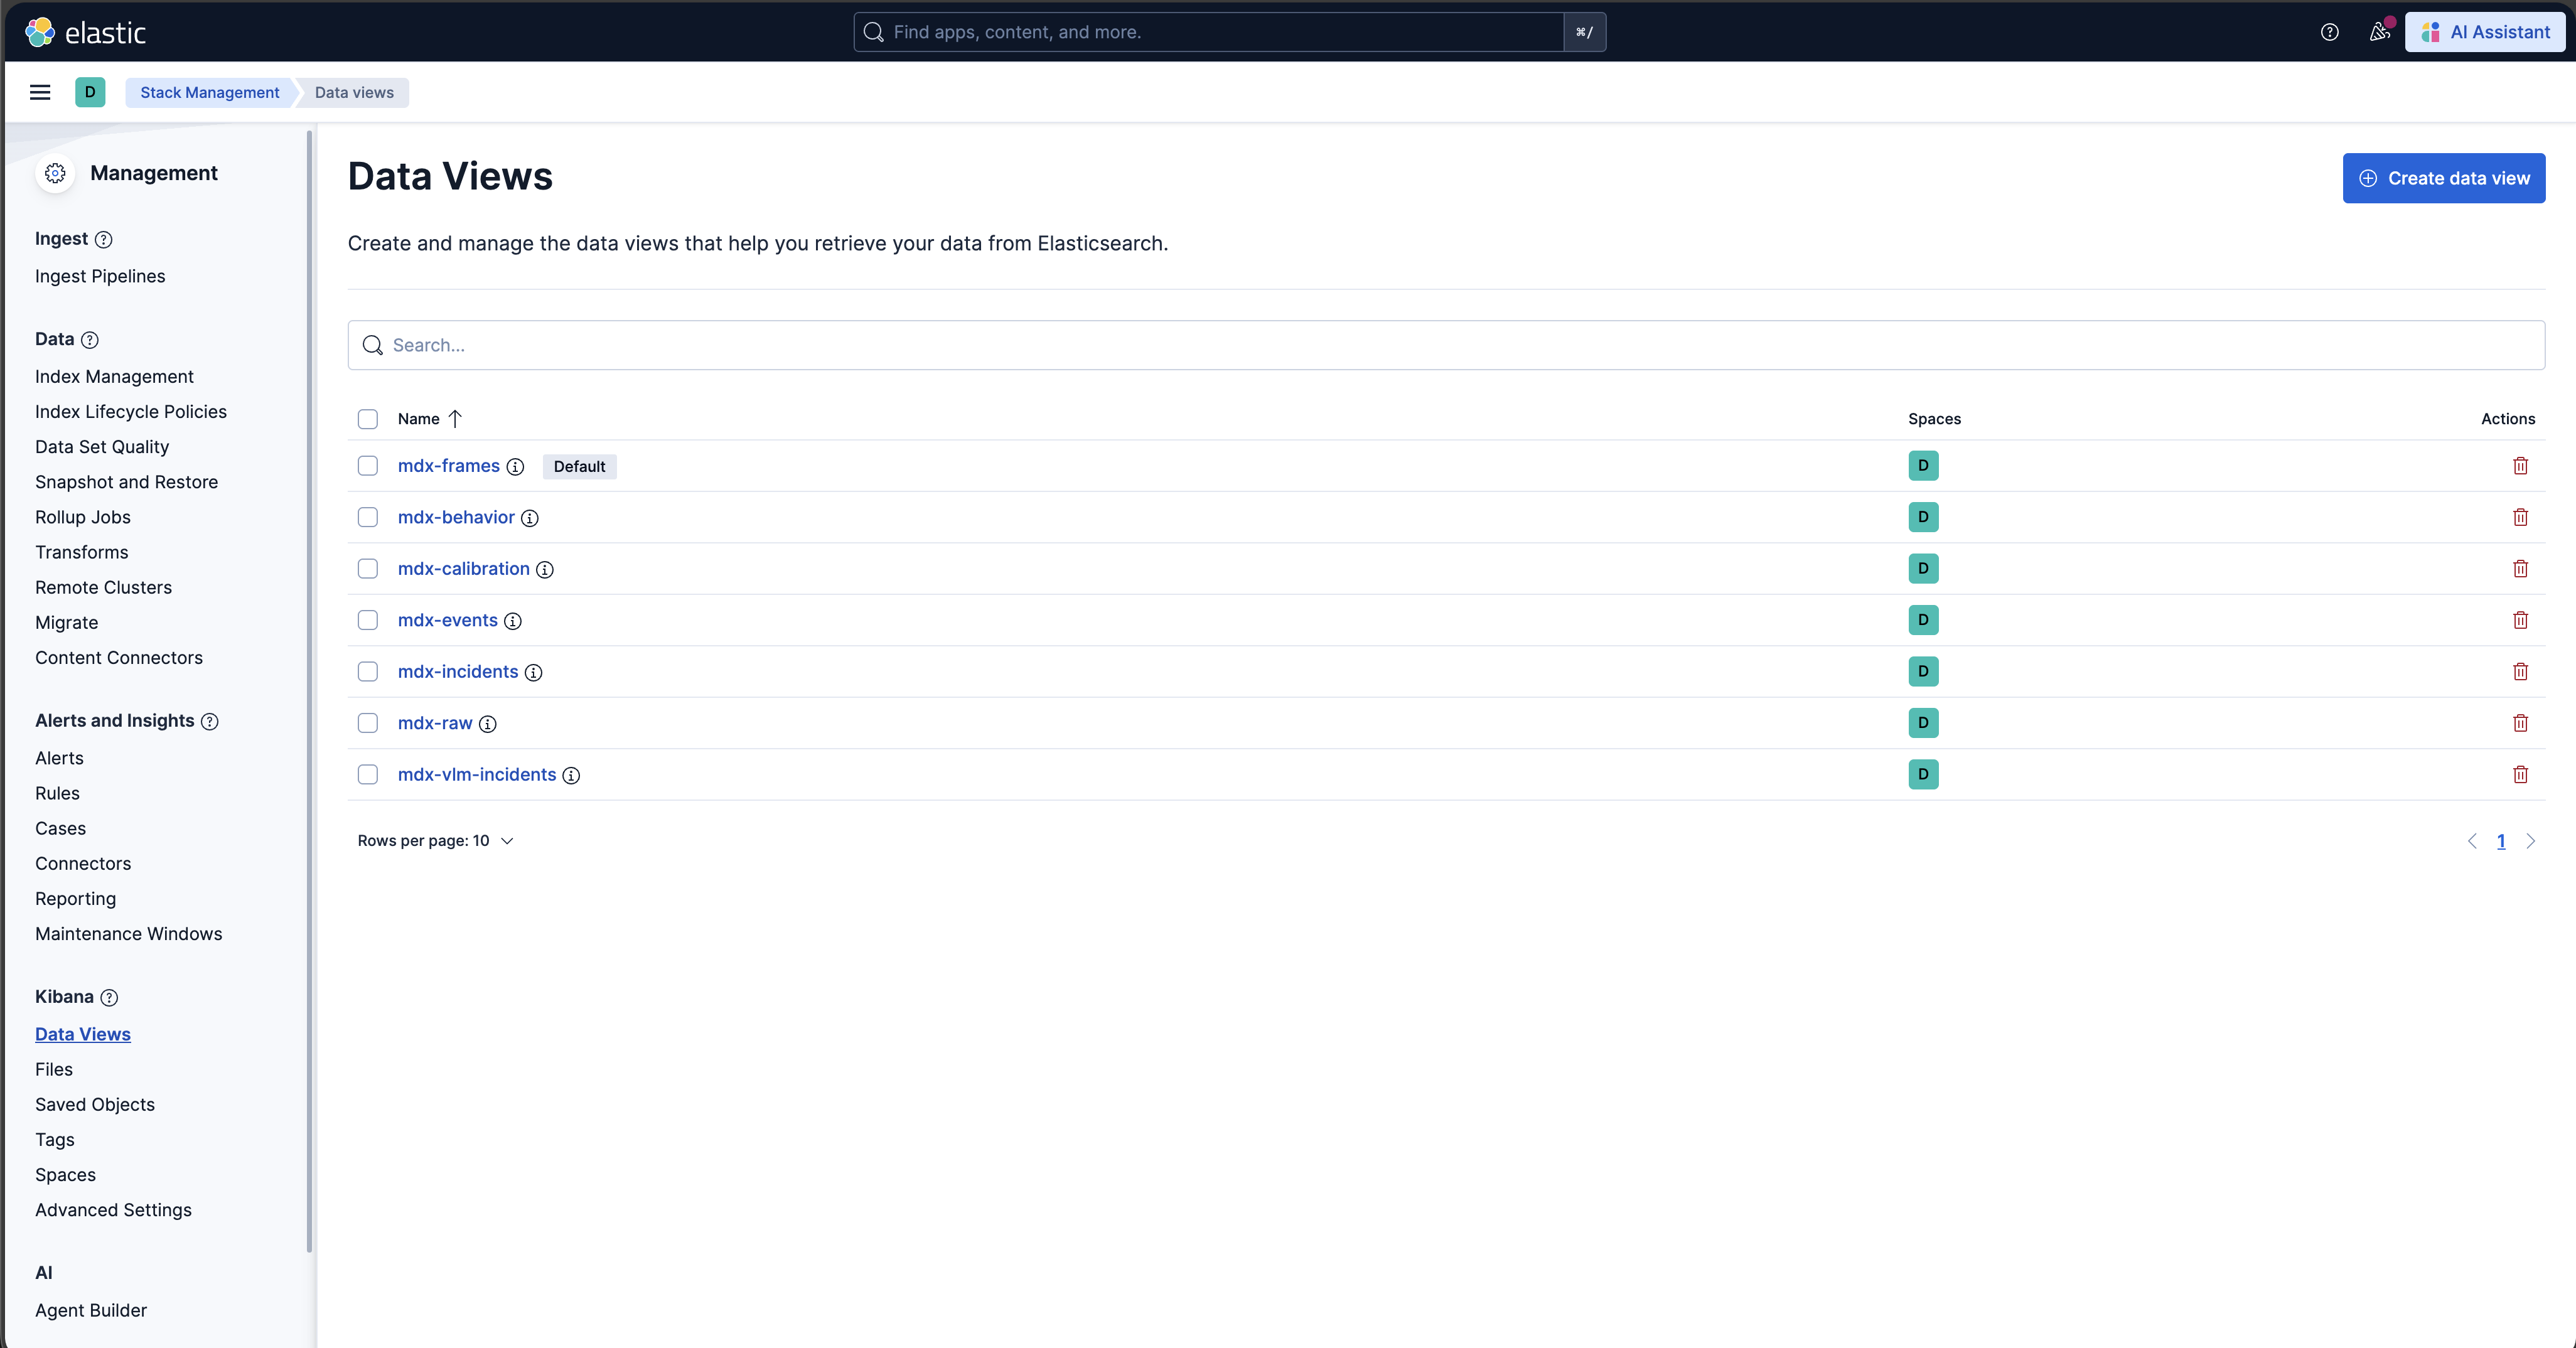
Browse the Kibana UI, discover the data views and visualize the data.
VIOS UI#
Please note: At this point the web-based application is only available for Chrome browser running on Linux, Windows or MacOS, details can be found in VIOS docs.
Launch Chrome browser
In the address bar enter
http://<IP_address>:30888/vst/
Configure and View
Reference Video Analytics UI#
We provide a sample browser-based user interface for visualizing the moving objects, live camera feeds along with events and metrics. Details can be found in Reference Video Analytics UI.
Launch Chrome browser
In the address bar enter
http://<IP_address>:3002
Configure and View
Events and Use Cases#
Events#
The VSS Warehouse 2D Blueprint processes live camera feeds, detects and tracks objects of interest, and generates events based on configurable logic.
Three fundamental types of events are supported:
ROI Events: Triggered when objects enter or exit a predefined region of interest (ROI).
Tripwire Events: Triggered when objects cross a predefined tripwire.
Proximity Events: Triggered when objects are too close to each other.
Each event type is associated with a specific logic and configuration. For more details, see Behavior Analytics.
All event data is stored in Elasticsearch, and can be queried and visualized in Kibana, the VIOS UI, and the Video Analytics UI.
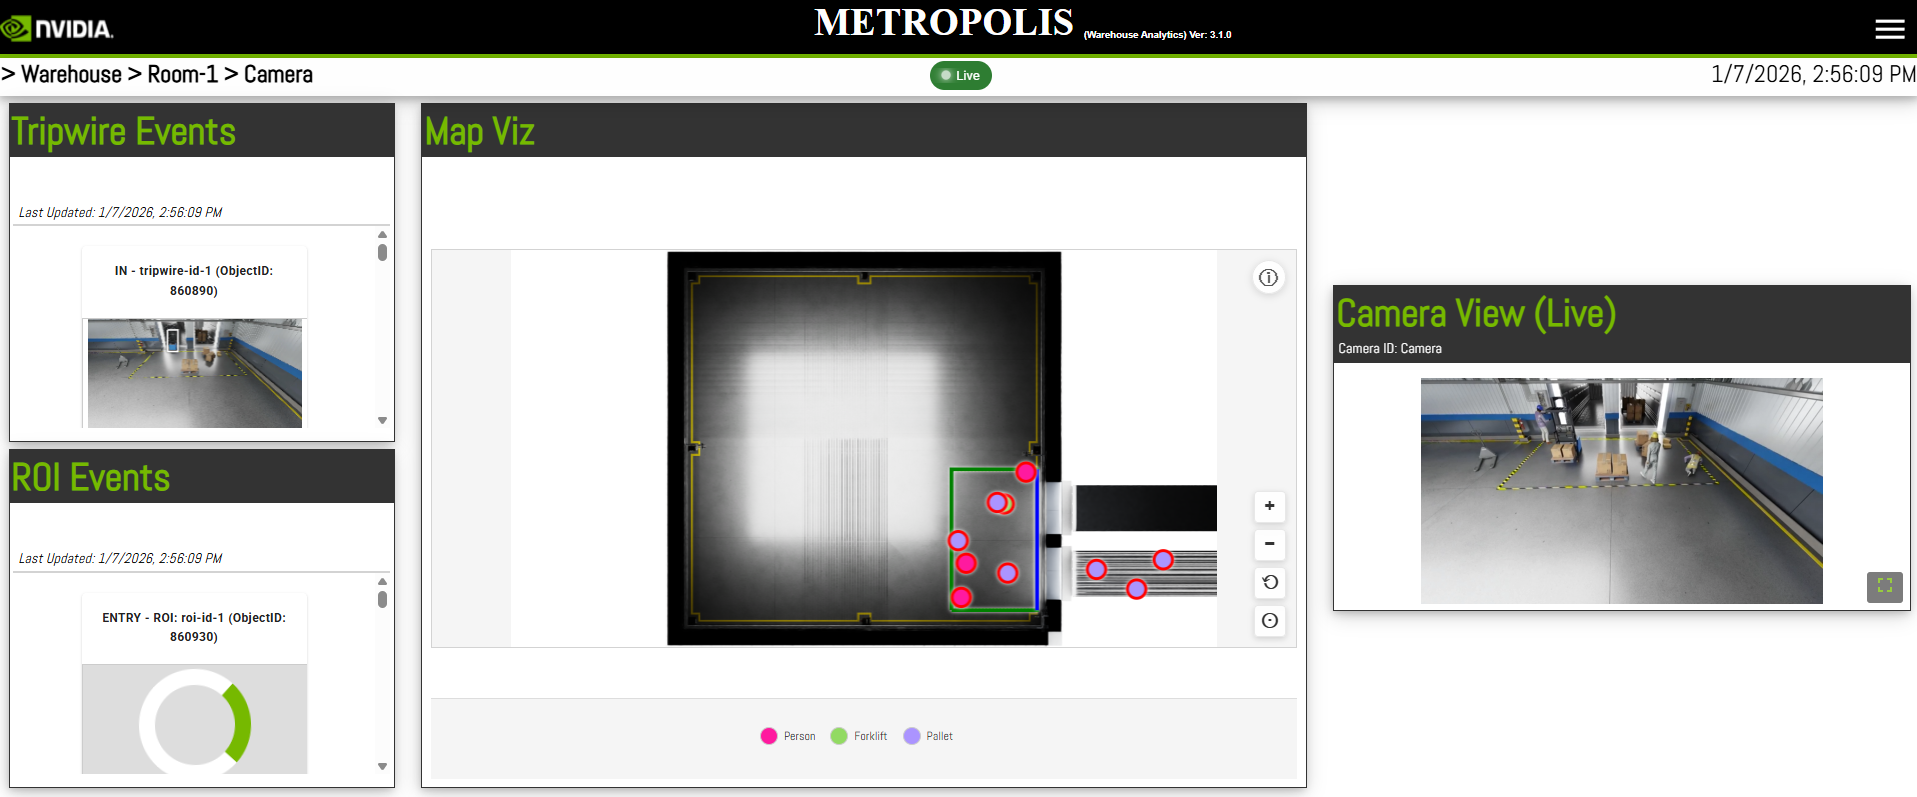
In the provided sample data, a rectangle ROI and a tripwire are predefined. The ROI is shown in green and the tripwire is shown in blue (tripwire is defined as one edge of the ROI) in the Video Analytics UI.
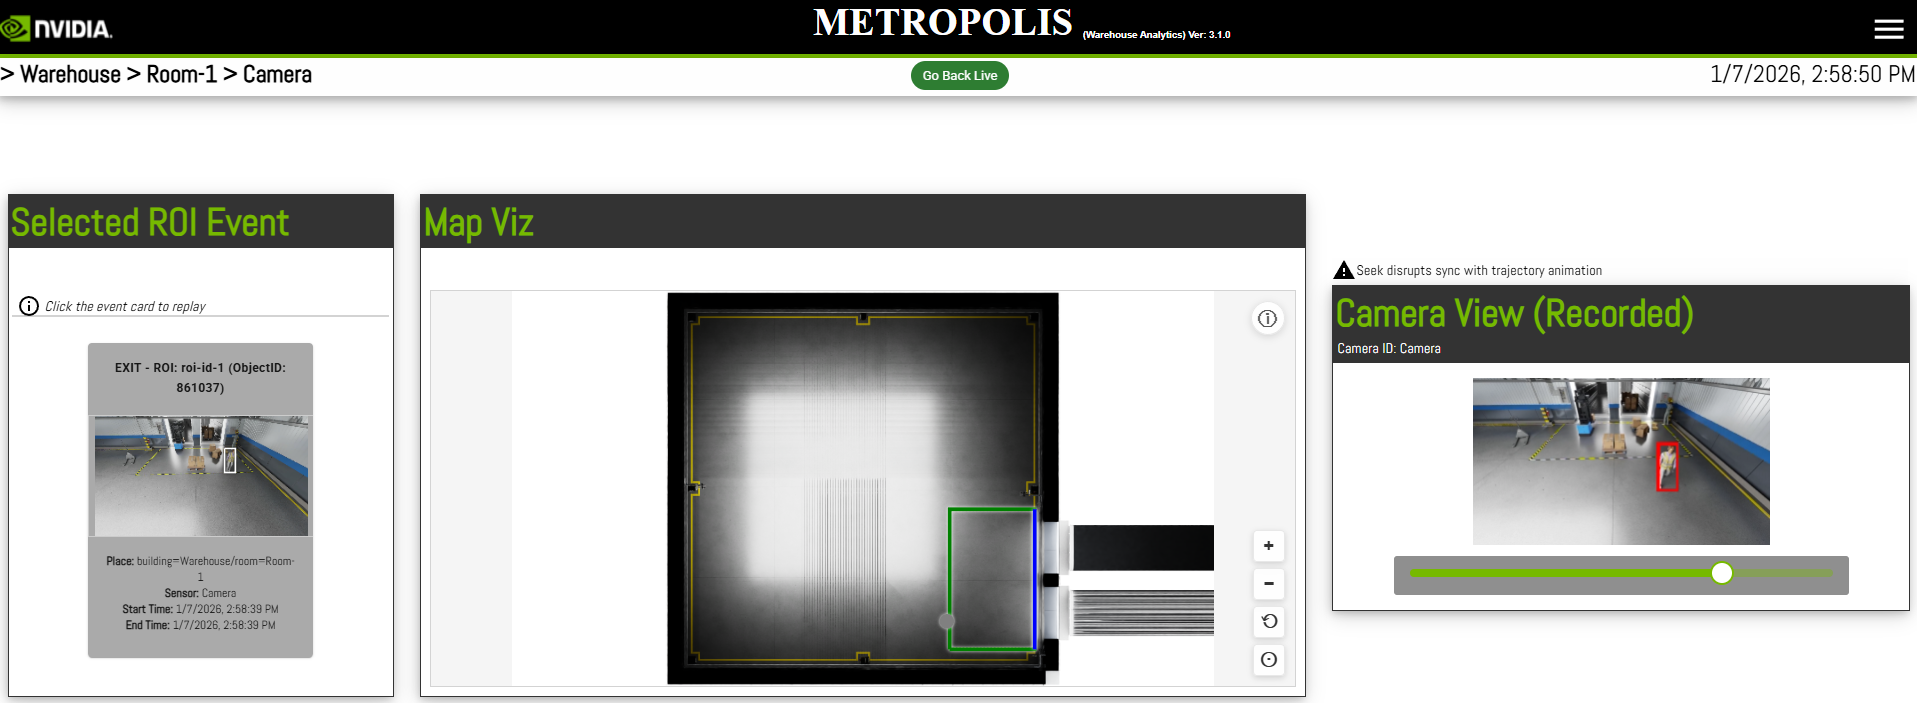
An example of an ROI event where a person (highlighted in red) exits the ROI is shown below in the Video Analytics UI using the event viewer:
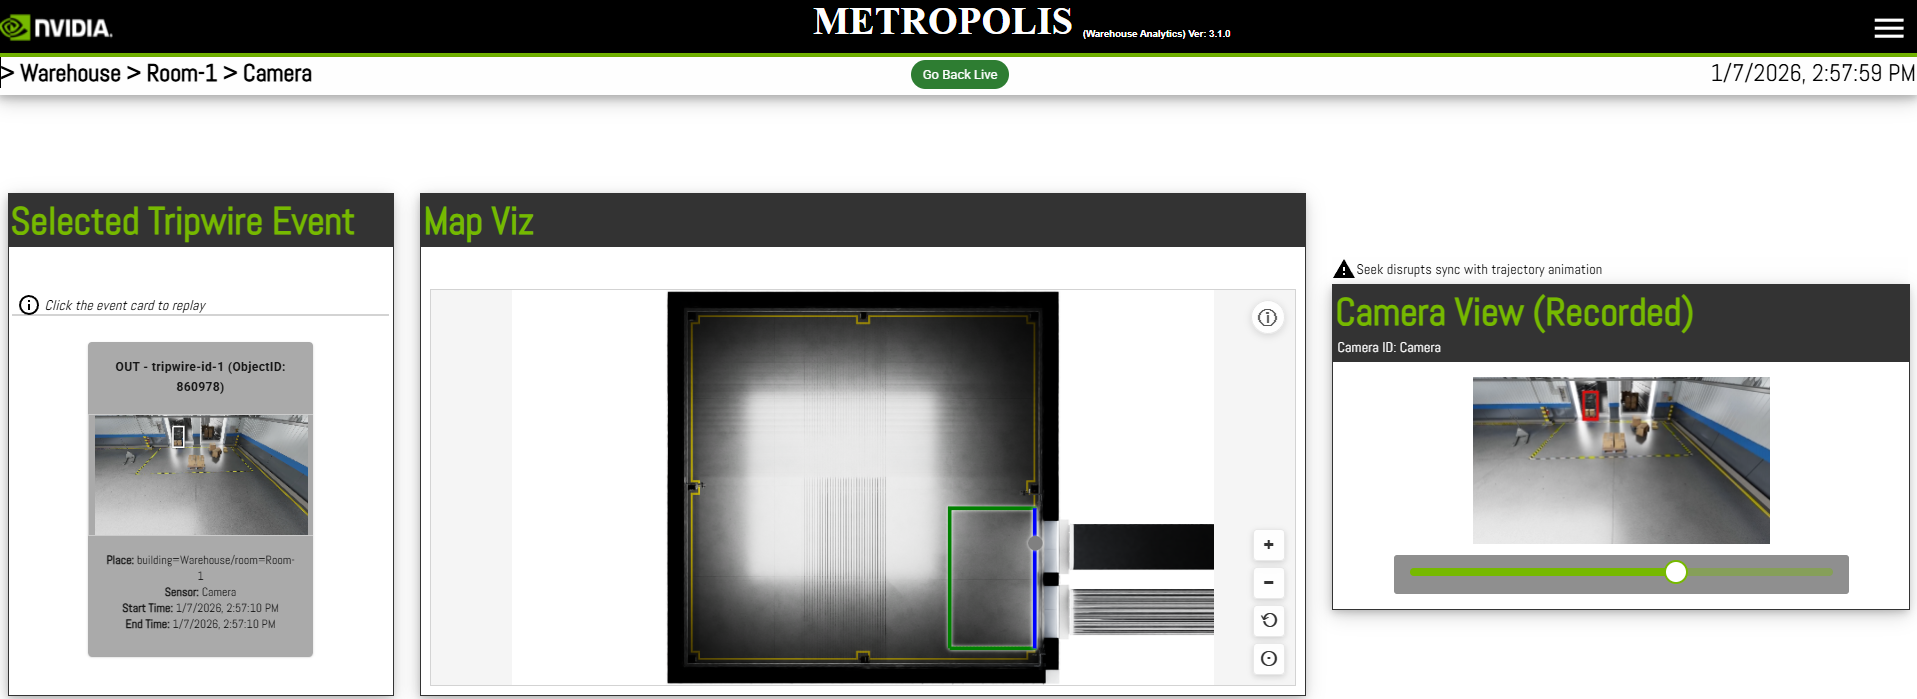
An example of a tripwire event where a forklift (highlighted in red) crosses the tripwire into the trailer is shown below in the Video Analytics UI using the event viewer:
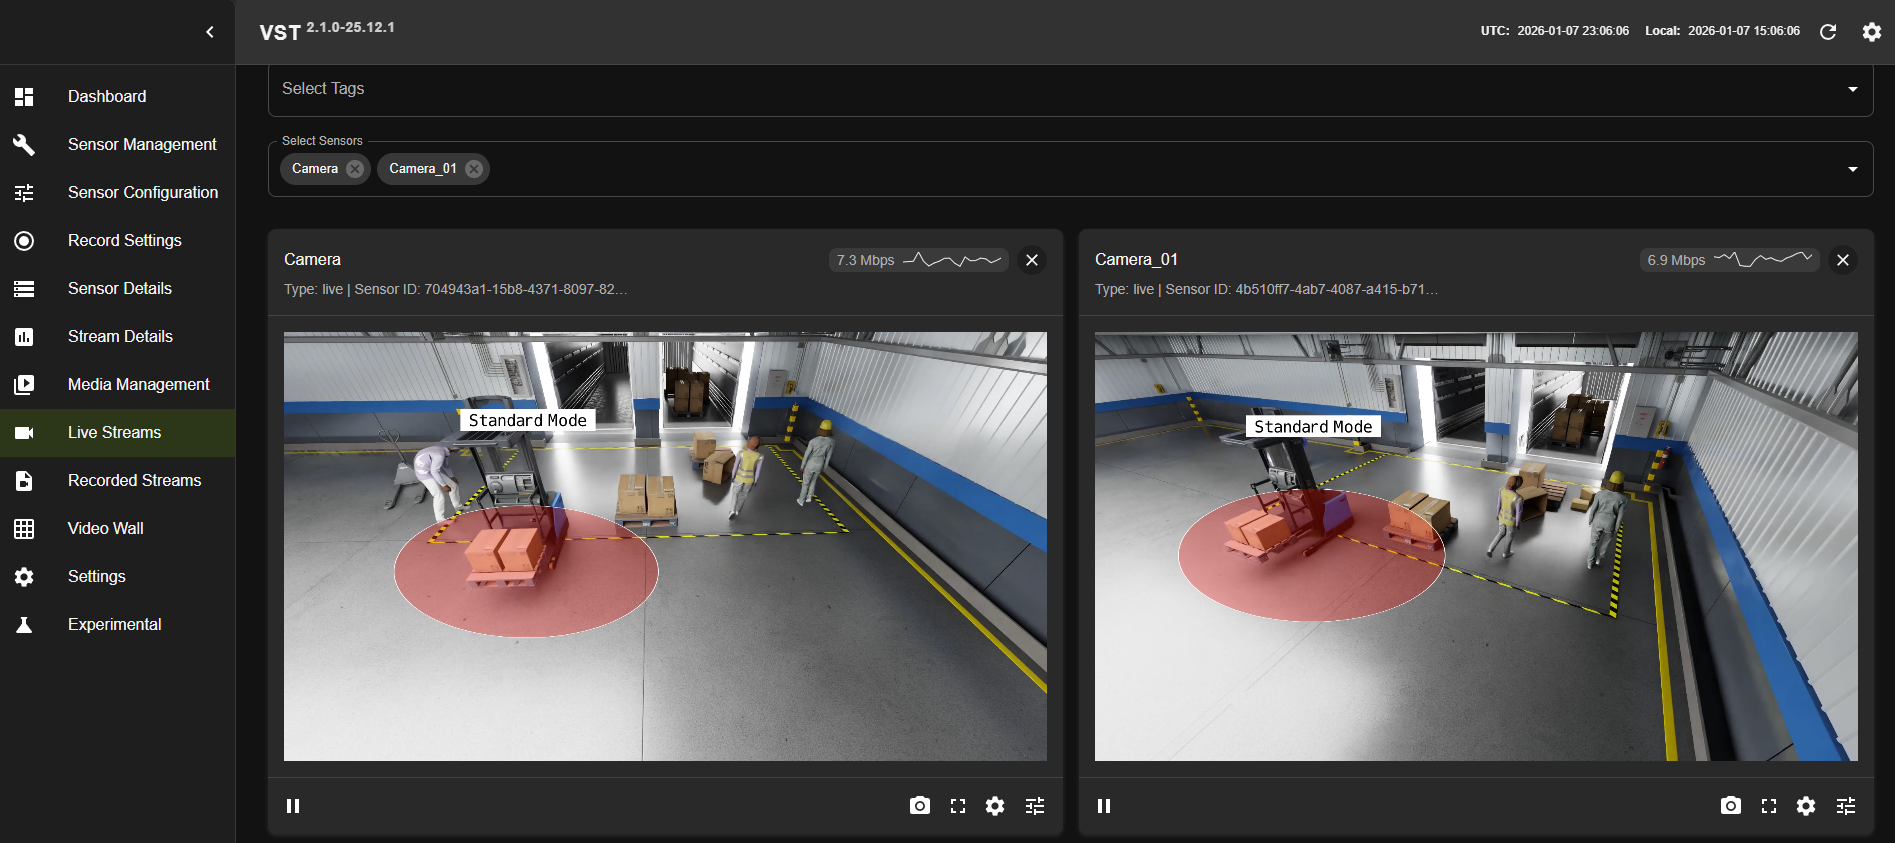
An example of a proximity event where a person is too close to the forklift is shown below in the VIOS UI:
Use Cases#
The three fundamental event types—ROI events, tripwire events, and proximity events—provide a powerful foundation for implementing comprehensive safety monitoring and operational intelligence in warehouse environments. These events enable real-time situational awareness and proactive safety management across multiple critical use cases.
For instance, in warehouse safety applications, ROI events can be leveraged to continuously monitor whether designated safety zones remain human-free or equipment-free, ensuring that hazardous areas such as automated vehicle pathways, robotic work cells, or restricted maintenance zones are clear before operations commence. By tracking cumulative enter and exit counts for defined ROIs, the system can maintain accurate occupancy counts and generate alerts when unauthorized access occurs or when occupancy thresholds are exceeded.
Tripwire events extend this capability by enabling precise directional counting at strategic locations such as doorways, loading dock entrances, and zone boundaries. This becomes particularly valuable for monitoring areas that may not be directly visible to cameras, where inferring object presence through systematic tracking of entry and exit events across tripwires provides indirect but reliable occupancy estimation. For example, if a person crosses a tripwire entering a blind corridor but no corresponding exit event is detected within an expected timeframe, the system can infer continued presence and raise appropriate safety alerts or delay automated equipment operations in that zone.
Proximity events complement these spatial monitoring capabilities by detecting dangerous situations where humans come too close to moving equipment such as forklifts, autonomous mobile robots (AMRs), or industrial manipulators, enabling immediate collision avoidance alerts or automatic equipment slowdown protocols.
Together, these event types form a comprehensive safety net that supports critical warehouse operations including dynamic safe zone enforcement, pedestrian-vehicle collision prevention, restricted area access control, loading dock safety management, and temporal-spatial workflow optimization—all while providing the rich event data necessary for compliance reporting, incident investigation, and continuous safety process improvement.
Latency Measurements#
System |
Model |
No. of streams |
Fps |
(NvStreamer + VIOS + DeepStream) latency |
Behavior-analytics latency |
E2E latency |
|---|---|---|---|---|---|---|
RTX6000pro + AMD EPYC 9124 16-Core Processor (3.0GHz) |
RT-DETR |
3 |
30 |
79 ms |
25 ms |
104 ms |
NVIDIA DGX Spark + ARM Cortex-X925/A725 20-Core (4.0GHz) |
RT-DETR |
3 |
30 |
84 ms |
32 ms |
116 ms |
NVIDIA IGX Thor + ARM 14-Core (2.6GHz) |
RT-DETR |
3 |
30 |
130 ms |
51 ms |
181 ms |
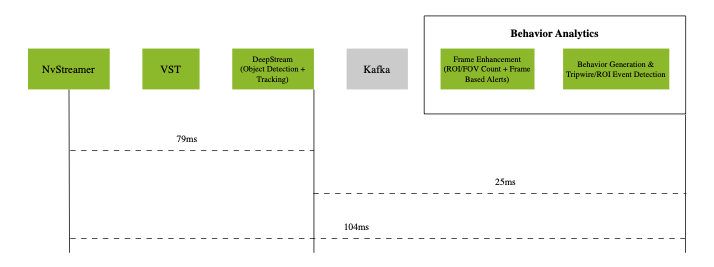
Latency Measurements on RTX6000pro (p50)
The above diagram shows the p50 latency of the VSS Warehouse 2D Blueprint, measured using an RTX6000pro GPU and an AMD EPYC 9124 16-Core Processor (3.0GHz) with 3 streams at 30 fps for RT-DETR model.

Latency Measurements on DGX Spark (p50)
The above diagram shows the p50 latency of the VSS Warehouse 2D Blueprint, measured using an NVIDIA DGX Spark + ARM Cortex-X925/A725 20-Core (4.0GHz) with 3 streams at 30 fps for RT-DETR model.
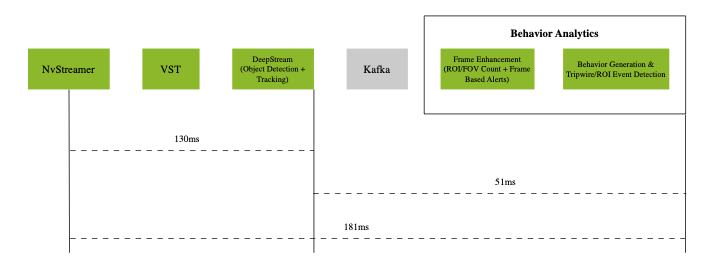
Latency Measurements on IGX Thor (p50)
The above diagram shows the p50 latency of the VSS Warehouse 2D Blueprint, measured using an NVIDIA IGX Thor + ARM 14-Core (2.6GHz) with 3 streams at 30 fps for RT-DETR model.
The system demonstrates the following p50 latency breakdown:
Video pipeline (nvStreamer + VIOS + DeepStream): 79ms with RTX6000pro, 84ms with DGX Spark, and 130ms with IGX Thor for RT-DETR model
Behavior analytics pipeline: 25ms with RTX6000pro, 32ms with DGX Spark, and 51ms with IGX Thor
The end-to-end system latency is 104ms with RTX6000pro, 116ms with DGX Spark, and 181ms with IGX Thor at p50.
Note
The latency may vary based on the hardware, the number of objects in a scene, the number of ROIs and tripwires, and the machine’s load.
Customization#
The Blueprint supports several levels of customization:
Data Level: Add, remove, or replace cameras while maintaining the existing workflow.
Model Level: Fine-tune perception models to better suit your use cases.
Application Level: Build new microservices or applications using the provided APIs and components.
Microservice Level: Modify existing microservices from source code to extend functionality.
Adding New Cameras#
Prepare and Calibrate New Cameras#
Before integrating a camera into the VSS Warehouse 2D Blueprint workflow, you must generate a proper calibration file.
The 2D Blueprint supports both live RTSP feeds and recorded video files from real cameras. Both require proper calibration files.
For detailed instructions on calibrating real cameras for the 2D use case, see Manual Calibration Guide.
As an easier alternative, you can use the VSS Auto Calibration microservice to automatically calibrate cameras through a simple, web-based workflow and generate a calibration file from archived videos, without manual steps or downtime. For details, see VSS Auto Calibration.
Integrating New Cameras#
There are two approaches to integrate new cameras into the 2D Warehouse Blueprint:
Option 1: NvStreamer/VIOS (Recorded Videos)
Use this approach for recorded videos or when managing cameras using NvStreamer/VIOS.
Configure NvStreamer/VIOS:
For recorded videos:
First upload videos to NvStreamer (see uploading videos section)
Then add RTSP links to VIOS (see add camera section)
For live feeds: Directly add RTSP links to VIOS (see add camera section)
Update DeepStream Configuration:
Modify the source-list in the DeepStream configuration
Update sensor count and batch size settings
See source config section for details
Update Calibration File:
Maintain a single calibration.json file per deployment
Add new camera information following the schema defined in Schema Documentation
Reference Prepare and Calibrate New Cameras for guidance
Option 2: Live RTSP Feeds
Use this approach for realtime RTSP streams when you want to define camera configurations declaratively via a JSON file.
Create a Sensor Info File (
camera_info.json):{ "sensors": [ { "camera_name": "camera-01", "rtsp_url": "rtsp://192.168.1.100:554/stream1", "group_id": "entrance-group", "region": "building-A" }, { "camera_name": "camera-02", "rtsp_url": "rtsp://192.168.1.101:554/stream1", "group_id": "entrance-group", "region": "building-A" } ] }
Required fields:
camera_name,rtsp_urlOptional fields:
group_id,region(can also be obtained from calibration data)Configure Blueprint Configurator Environment Variables:
SENSOR_INFO_SOURCE=file
SENSOR_FILE_PATH=<path_to_camera_info.json>
Update Calibration File:
Ensure your
calibration.jsonincludes calibration data for all cameras defined in the sensor info file.Refer to Prepare and Calibrate New Cameras for guidance.
Configuring Number of Streams
For both approaches, the number of streams/sensors to be processed can be configured in two ways:
Static Configuration: Set the
NUM_STREAMSenvironment variable to specify the desired number of streams.NUM_STREAMS=4
The configured number of streams should be less than or equal to the maximum streams supported by your hardware profile and deployment mode. Blueprint Configurator can be used to automatically cap the stream count using the formula:
final_stream_count = min(NUM_STREAMS, max_streams_supported). For more details, refer to the How to Count Files Dynamically (Prerequisites) section in Blueprint Configurator Documentation.Dynamic Configuration: Use the Blueprint Configurator’s prerequisite operations to automatically count the number of video files in the recorded videos directory and use that count for configuration updates. Please note that this approach cannot be used for live RTSP feeds.
Example: Automatically determine stream count from video files in dataset directory:
# In blueprint_config.yml
commons:
  # Step 1: Count video files BEFORE variable processing
  prerequisites:
    2d:
      - operation_type: "file_management"
        target_directories:
          - "${MDX_DATA_DIR}/videos/warehouse-2d-app"
        file_management:
          action: "file_count"
          parameters:
            pattern: "*.mp4"
          output_variable: "available_video_count"  # Stores count (e.g., 6)

  # Step 2: Use the count to compute final stream count
  variables:
    2d:
      # Cap to minimum of: available videos, GPU limit
      - final_stream_count: "min(${available_video_count}, ${max_streams_supported})"

  # Step 3: Use computed variable in config file updates
  file_operations:
    2d:
      - operation_type: "yaml_update"
        target_file: "${DS_CONFIG_DIR}/config.yaml"
        updates:
          num_sensors: ${final_stream_count}
How it works: If your dataset directory has 6 video files, and GPU supports max 4 streams, the configurator computes:
final_stream_count = min(6, 4) = 4. For more details, refer to the How to Count Files Dynamically (Prerequisites) section in Blueprint Configurator Documentation.
Model Customization#
Perception Model Fine-tuning#
The Blueprint uses RT-DETR (Real-Time Detection Transformer) as its primary perception model. RT-DETR features an EfficientViT/L2 backbone and is pretrained on warehouse scene datasets for precise 2D object detection in industrial environments. For details, see: 2D Single Camera Detection and Tracking.
For fine-tuning the RT-DETR model via TAO Toolkit on custom datasets, refer to: TAO RT-DETR Finetuning.
Application Customization#
The Blueprint uses a modular microservices architecture with the following communication channels:
Message Broker (Kafka or Redis)
Elasticsearch database
REST APIs
Users can build their own microservices by consuming data from the above channels.
For complete API documentation, see API Reference Page.
Available Service Ports#
The following ports are used during deployment, and users can leverage them for any potential integration:
Service |
Port |
|---|---|
Calibration-Toolkit |
8003 |
Kafka |
9092 |
ZooKeeper |
2181 |
Elasticsearch |
9200 |
Kibana |
5601 |
NvStreamer |
31000 |
VIOS |
30888/vst |
Video Analytics API |
8081 |
Reference Video Analytics UI |
3002 |
Analytics Microservices Customization (Advanced)#
For detailed information about customizing specific analytics microservices, refer to:
Hardware Config Customization#
The 2D Warehouse Blueprint requires several configuration files to be properly tuned based on your GPU hardware and deployment requirements. When changing hardware (e.g., switching from H100 to L4 GPU) or adjusting the number of video streams, multiple configuration files must be updated to ensure optimal performance and prevent GPU overload.
Configuration Files Requiring Hardware-Based Updates#
The following table lists the configuration files that typically require updates when hardware changes:
Configuration File |
Parameters to Update |
Why Update is Needed |
|---|---|---|
|
|
Batch sizes must match stream count for optimal GPU utilization |
|
|
Same as above for Redis-based deployments |
|
|
Sync file count must align with stream count |
|
|
Device limits must match GPU capacity |
|
|
Same as above for Redis-based deployments |
There are two approaches to customize these configuration files:
Approach 1: Manual Configuration#
Manually update all required configuration files before deploying the blueprint. This is time consuming, error prone and often not suitable for production deployments.
# Update DeepStream main config
vi <PATH_TO_DS_CONFIG_DIR>/ds-main-config.txt
# Set: num-source-bins=0, max-batch-size=<stream_count>, batch-size=<stream_count>

# Update DeepStream Redis main config
vi <PATH_TO_DS_CONFIG_DIR>/ds-main-redis-config.txt
# Set: num-source-bins=0, max-batch-size=<stream_count>, batch-size=<stream_count>

# Update NvStreamer config
vi <PATH_TO_NVSTREAMER_CONFIG_DIR>/vst-config.json
# Set: "nv_streamer_sync_file_count": <stream_count>

# Update VST Kafka config
vi <PATH_TO_VST_CONFIG_DIR>/vst_config_kafka.json
# Set: "max_devices_supported": <max_streams>, "always_recording": true

# Update VST Redis config
vi <PATH_TO_VST_CONFIG_DIR>/vst_config_redis.json
# Set: "max_devices_supported": <max_streams>, "always_recording": true
Approach 2: Automatic Config Management using Blueprint Configurator#
The Blueprint Configurator provides a declarative approach to automatically update all required configuration files based on your hardware profile and deployment mode. This is the recommended approach for production deployments and simplifies the configuration management process.
To enable the Blueprint Configurator, in Blueprint Configurator’s environment variables you must set:
ENABLE_PROFILE_CONFIGURATOR=true
By default, the Blueprint Configurator is disabled (ENABLE_PROFILE_CONFIGURATOR=false).
When enabled, it runs before the Blueprint Deployment starts and adjusts configuration files based on the hardware profile and deployment mode as defined in the HARDWARE_PROFILE and MODE environment variables.
The Blueprint Configurator provides a comprehensive set of features for automated profile configuration management:
Feature |
Description |
|---|---|
Configuration File Updates |
Automatically update configuration files in multiple formats:
|
Environment Variable Validation |
Validate environment variables before deployment to catch configuration errors early:
|
Prerequisite Operations |
Run operations before variable processing to dynamically determine values:
|
Variable Computations |
Create computed variables for intermediate calculations and condition checking. Use case: Automatically cap stream count to GPU limits using
|
Execution Order: Prerequisite Operations → Environment Variable Validation → Variable Computations → Configuration File Updates
For detailed information on how to create custom hardware profiles and advanced configuration options, refer to the Profile Configuration Manager section in Blueprint Configurator Documentation.