

RAN Simulations
This guide walks through running a simulation in Batched RAN mode, where AODT runs both the EM solver and the 5G RAN L1/L2 transmit/receive stack.
Complete EM Simulations first if you are new to AODT. RAN mode builds on the batched EM workflow.
1. Start the AODT backend
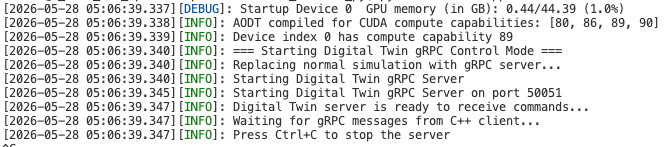
On the worker host, start the backend services:
When startup completes, the backend is ready to accept client requests.
2. Run the simulation
From the client machine, activate the virtual environment and run the batched RAN example:
Note: If you installed the client with cmake --install, omit the PYTHONPATH line.
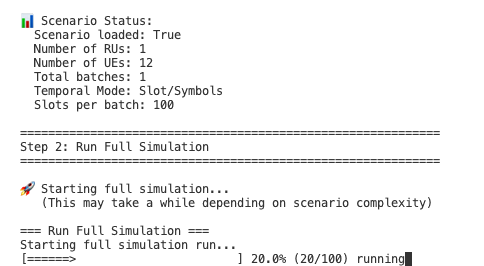
The worker console shows progress as the simulation runs.
3. Batched EM vs batched RAN
Batched RAN runs the EM solver and the downstream RAN receiver. Batched EM runs the EM solver only.
Comparing the YAML files for batched EM and batched RAN, the key differences are:
Parameter reference:
sim_is_full— Enables or disables the RAN stacksim_simulation_mode— Duration/interval-based (0) or slot-based (1) simulationsim_duration— Total simulation duration in secondssim_interval— Time interval between samples in secondssim_samples_per_slot— Samples per slot (1 or 14)sim_slots_per_batch— Number of slots per batch
All parameters are configurable through the YAML authoring APIs. EM mode supports both duration/interval and slot-based modes. RAN mode supports only slot-based mode, to preserve 5G timelines.
4. Read RAN telemetry from the database
In addition to CIRs and CFRs, RAN simulations produce telemetry stored as Parquet files in the database.
This prints BLER, throughput, and proportional-fair (PF) metrics for each UE per slot. Review examples/ran_metric.py to understand the telemetry table schema.
5. Procedural UE generation
By default, UEs are manually configured in the YAML file. Procedural UE generation places UEs dynamically within a geographic spawn zone.
Key parameters in the YAML file:
This generates 10 UEs randomly within the spawn zone bounding box. The simulation runs for 100 slots. The console lists UEs scheduled in each slot. When visualized in the viewer, the spawn zone and UEs appear on the map.
Use the configuration builder tools to create the YAML file instead of manually editing an existing YAML file. See Configuring Sim YAML.
Next steps
Continue to the GIS Pipeline quickstart to generate 3D scene maps for your simulations.
Optional exploration
- Review the options in
examples/example_full_sim.pyfor additional simulation parameters. - Modify the YAML configuration and rerun the simulation to explore different scenario settings.