Comparison tool for ASR Models#
The Comparison Tool (CT) allows to compare predictions of different ASR models at word accuracy and utterance level.
Comparison tool features: |
navigation across dataset’s vocabulary using an interactive datatable that supports sorting and filtering |
interactive visualization of model’s accuracy |
visual comparison of predictions of different models |
visual comparison of utterances by their WER/CER |
listening selected utterance |
Getting Started#
The Comparison Tool is integrated in NeMo Speech Data Explorer (SDE) that could be found at NeMo/tools/speech_data_explorer.
Please install the SDE requirements:
pip install -r tools/speech_data_explorer/requirements.txt
Then run:
python tools/speech_data_explorer/data_explorer.py -h

usage: data_explorer.py [-h] [--vocab VOCAB] [--port PORT] [--disable-caching-metrics] [--estimate-audio-metrics] [--debug] manifest

Speech Data Explorer

positional arguments:
manifest              path to JSON manifest file

optional arguments:
-h, --help            show this help message and exit
--vocab VOCAB         optional vocabulary to highlight OOV words
--port PORT           serving port for establishing connection
--disable-caching-metrics
                        disable caching metrics for errors analysis
--estimate-audio-metrics, -a
                        estimate frequency bandwidth and signal level of audio recordings
--debug, -d           enable debug mode
--audio-base-path A base path for the relative paths in manifest. It defaults to manifest path.
--names_compared, -nc names of the two fields that will be compared, example: pred_text_contextnet pred_text_conformer.
--show_statistics, -shst field name for which you want to see statistics (optional). Example: pred_text_contextnet.
CT takes a JSON manifest file (that describes speech datasets in NeMo) as an input. It should contain the following fields:
audio_filepath (path to audio file)
duration (duration of the audio file in seconds)
text (reference transcript)
pred_text_<model_1_name>
pred_text_<model_2_name>
SDE supports any extra custom fields in the JSON manifest. If the field is numeric, then SDE can visualize its distribution across utterances.
JSON manifest has attribute pred_text, SDE interprets it as a predicted ASR transcript and computes error analysis metrics. If you want SDE to analyse another prediction field, then please use –show_statistics argument.
User Interface#
SDE has three pages if –names_compared argument is not empty:
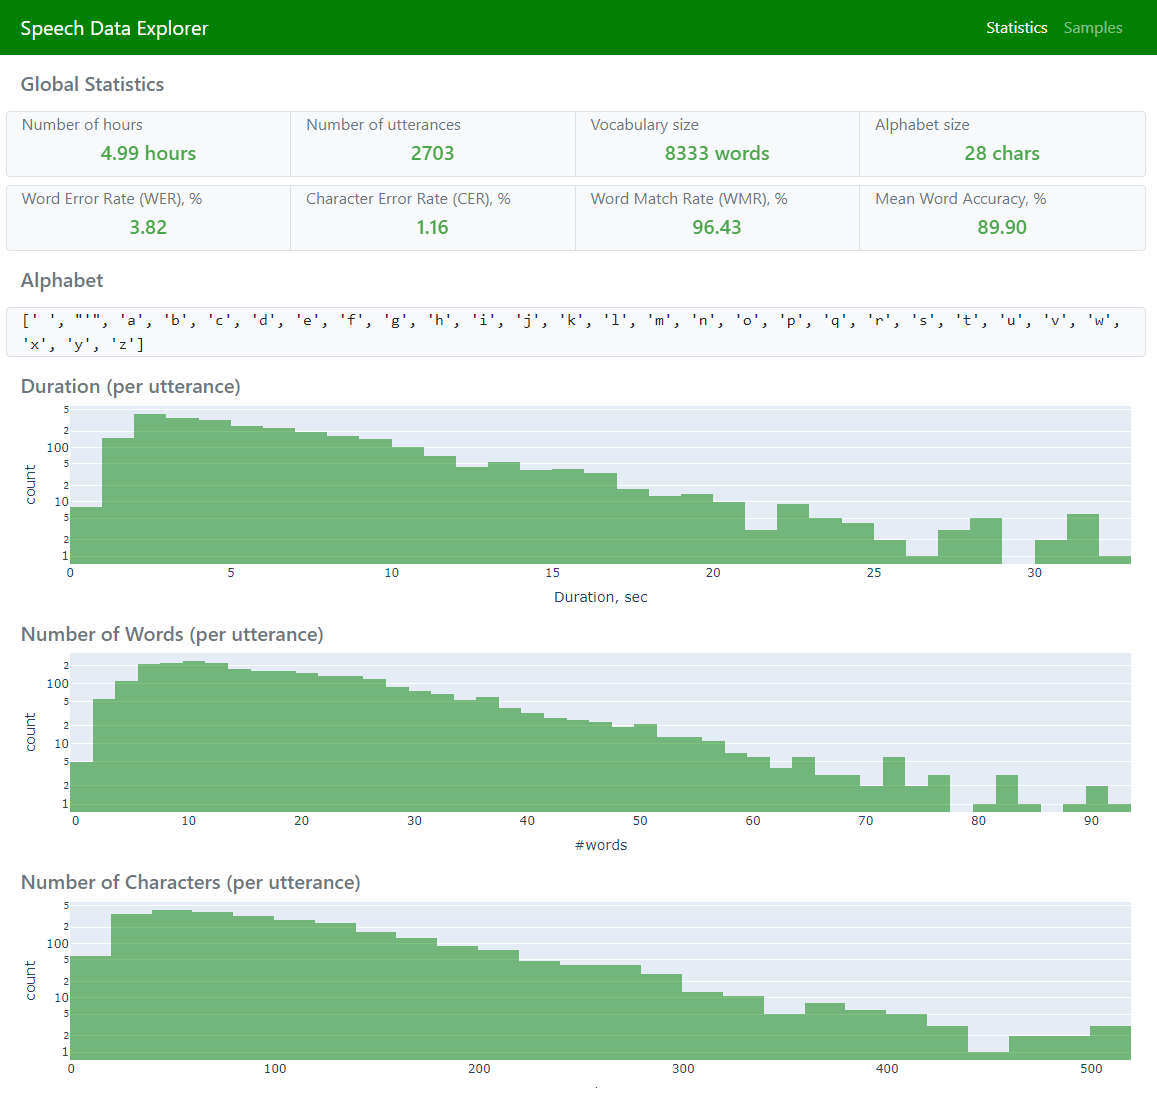
Statistics (to display global statistics and aggregated error metrics)
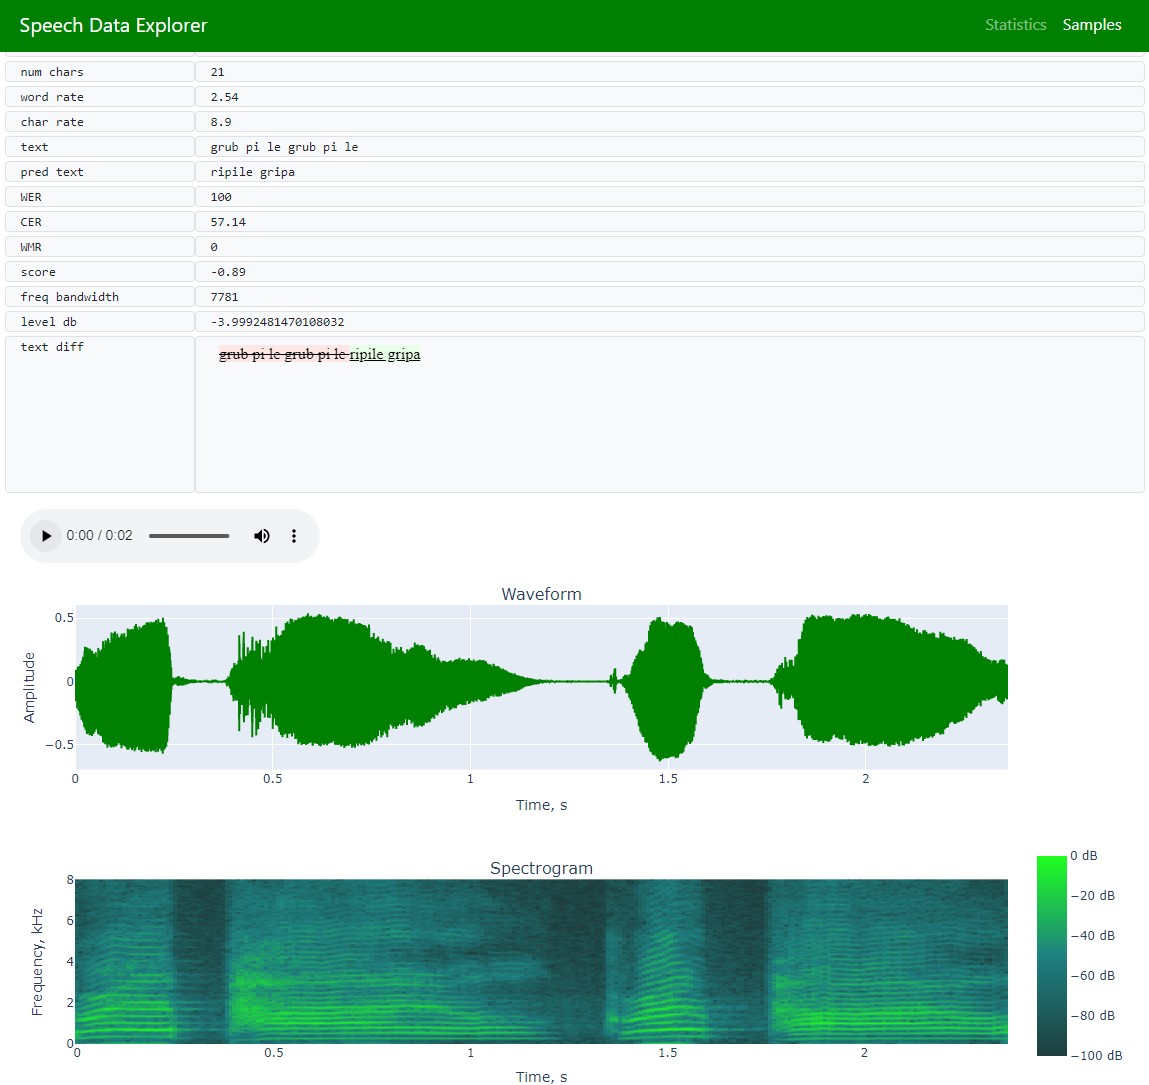
Samples (to allow navigation across the entire dataset and exploration of individual utterances)
Comparison tool (to explore predictions at word level)
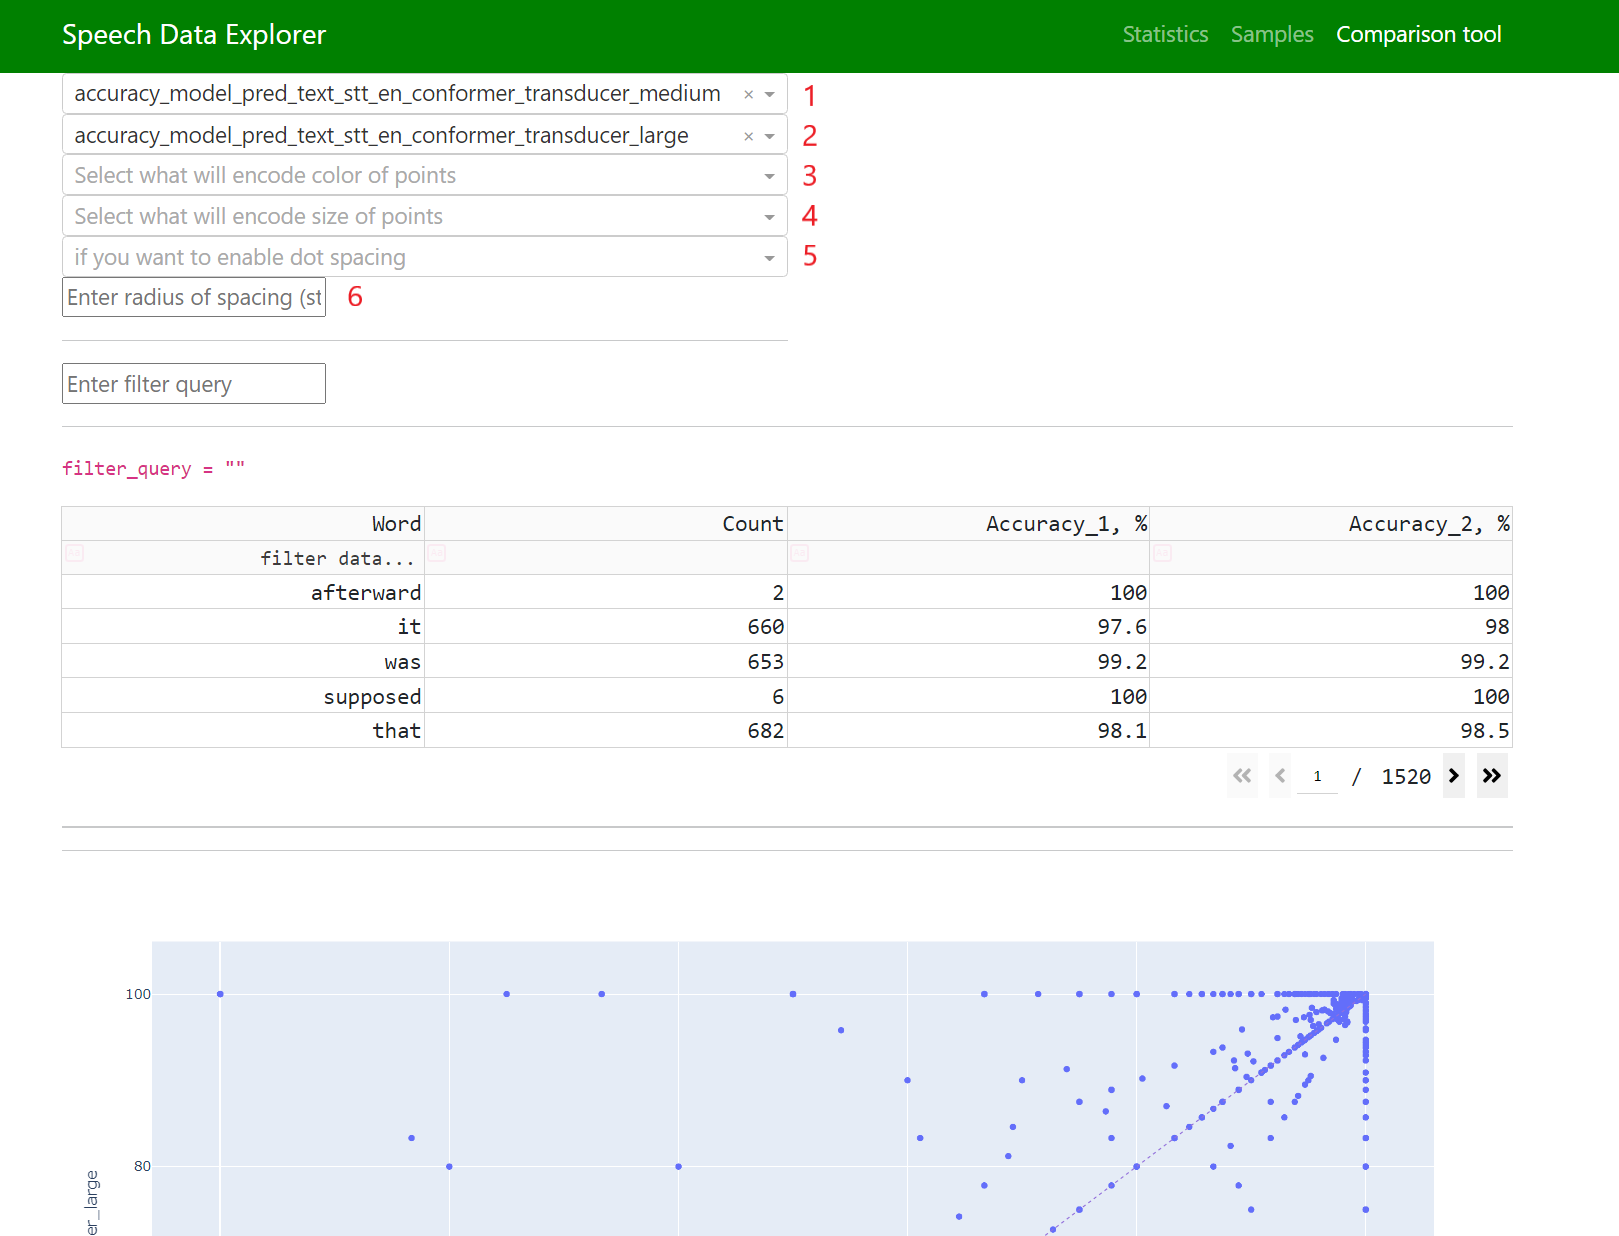
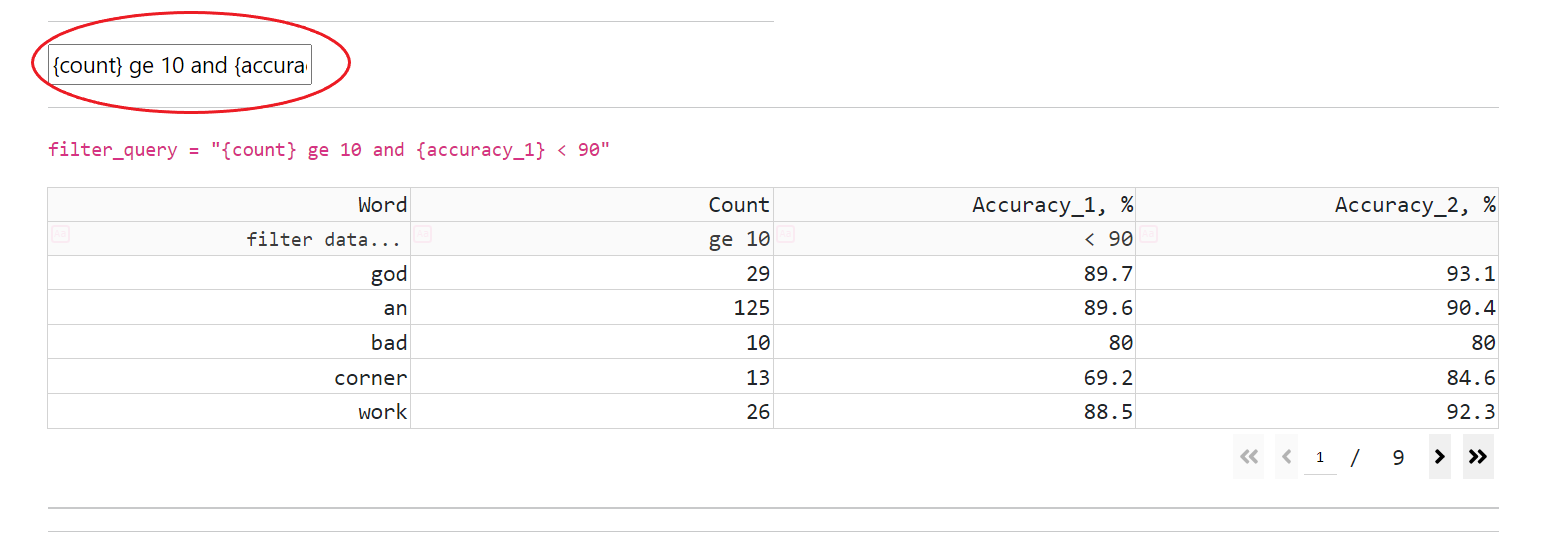
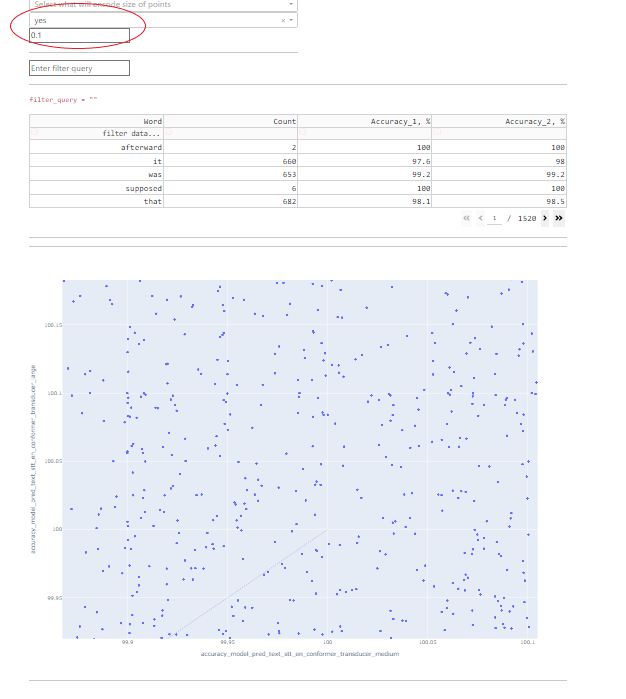
CT has an interactive datatable for dataset’s vocabulary (that supports navigation, filtering, and sorting):
Data (that visualizes all dataset’s words and adds each one’s accuracy)
CT supports all operations, that present in SDE, and allows combination of filtering expressions with “or” and “and” operations
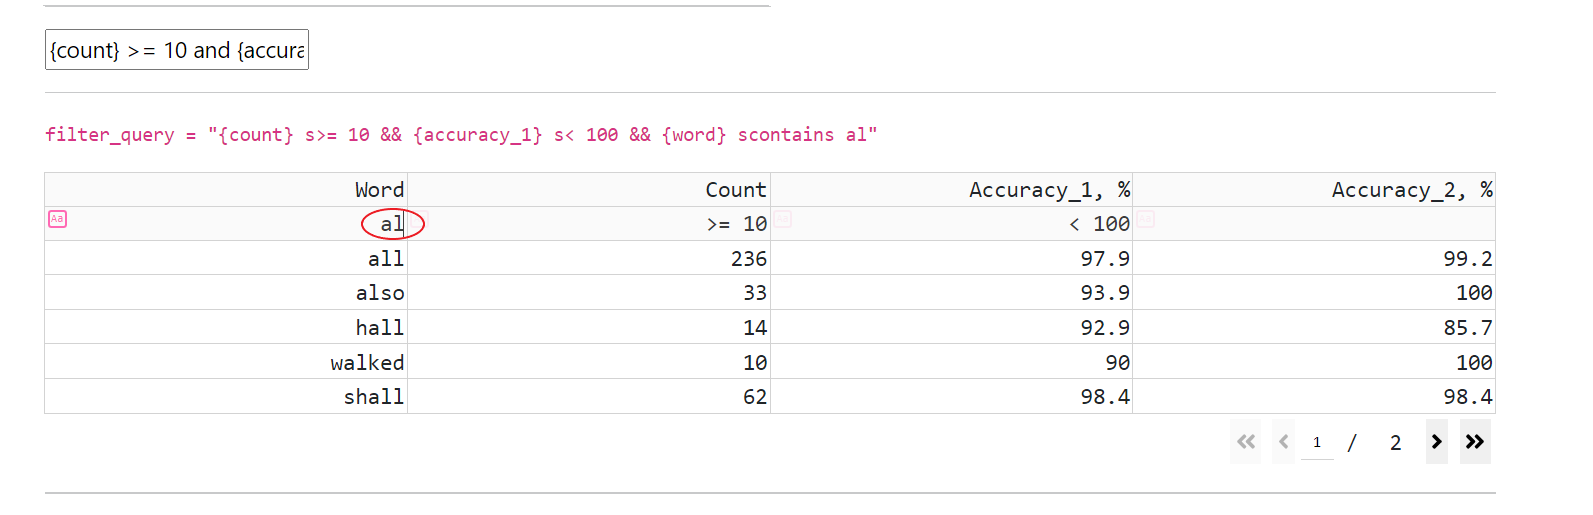
filtering (by entering a filtering expression in a cell below the header’s cell)
Analysis of Speech Datasets#
If there is a pre-trained ASR model, then the JSON manifest file can be extended with ASR predicted transcripts:
python examples/asr/transcribe_speech.py pretrained_name=<ASR_MODEL_NAME> dataset_manifest=<JSON_FILENAME> append_pred=False pred_name_postfix=<model_name_1>
More information about transcribe_speech parameters is available in the code: NeMo/examples/asr/transcribe_speech.py. .
Fields 1 and 2 are responsible for what will be displayed on the horizontal and vertical axes.
Fields 3 and 4 allow you to convert any available numeric parameter into color and size, respectively.
Fields 5 and 6 are responsible for point spacing. Some data points might have the same coordinates on both axes, in which case there will be an overlap, and in order to be able to explore each point, the option for their spreading was added.
Point spacing works as follows: a small random value is added to all point coordinates, the value of which is limited by the “radius” parameter, which can be set manually.
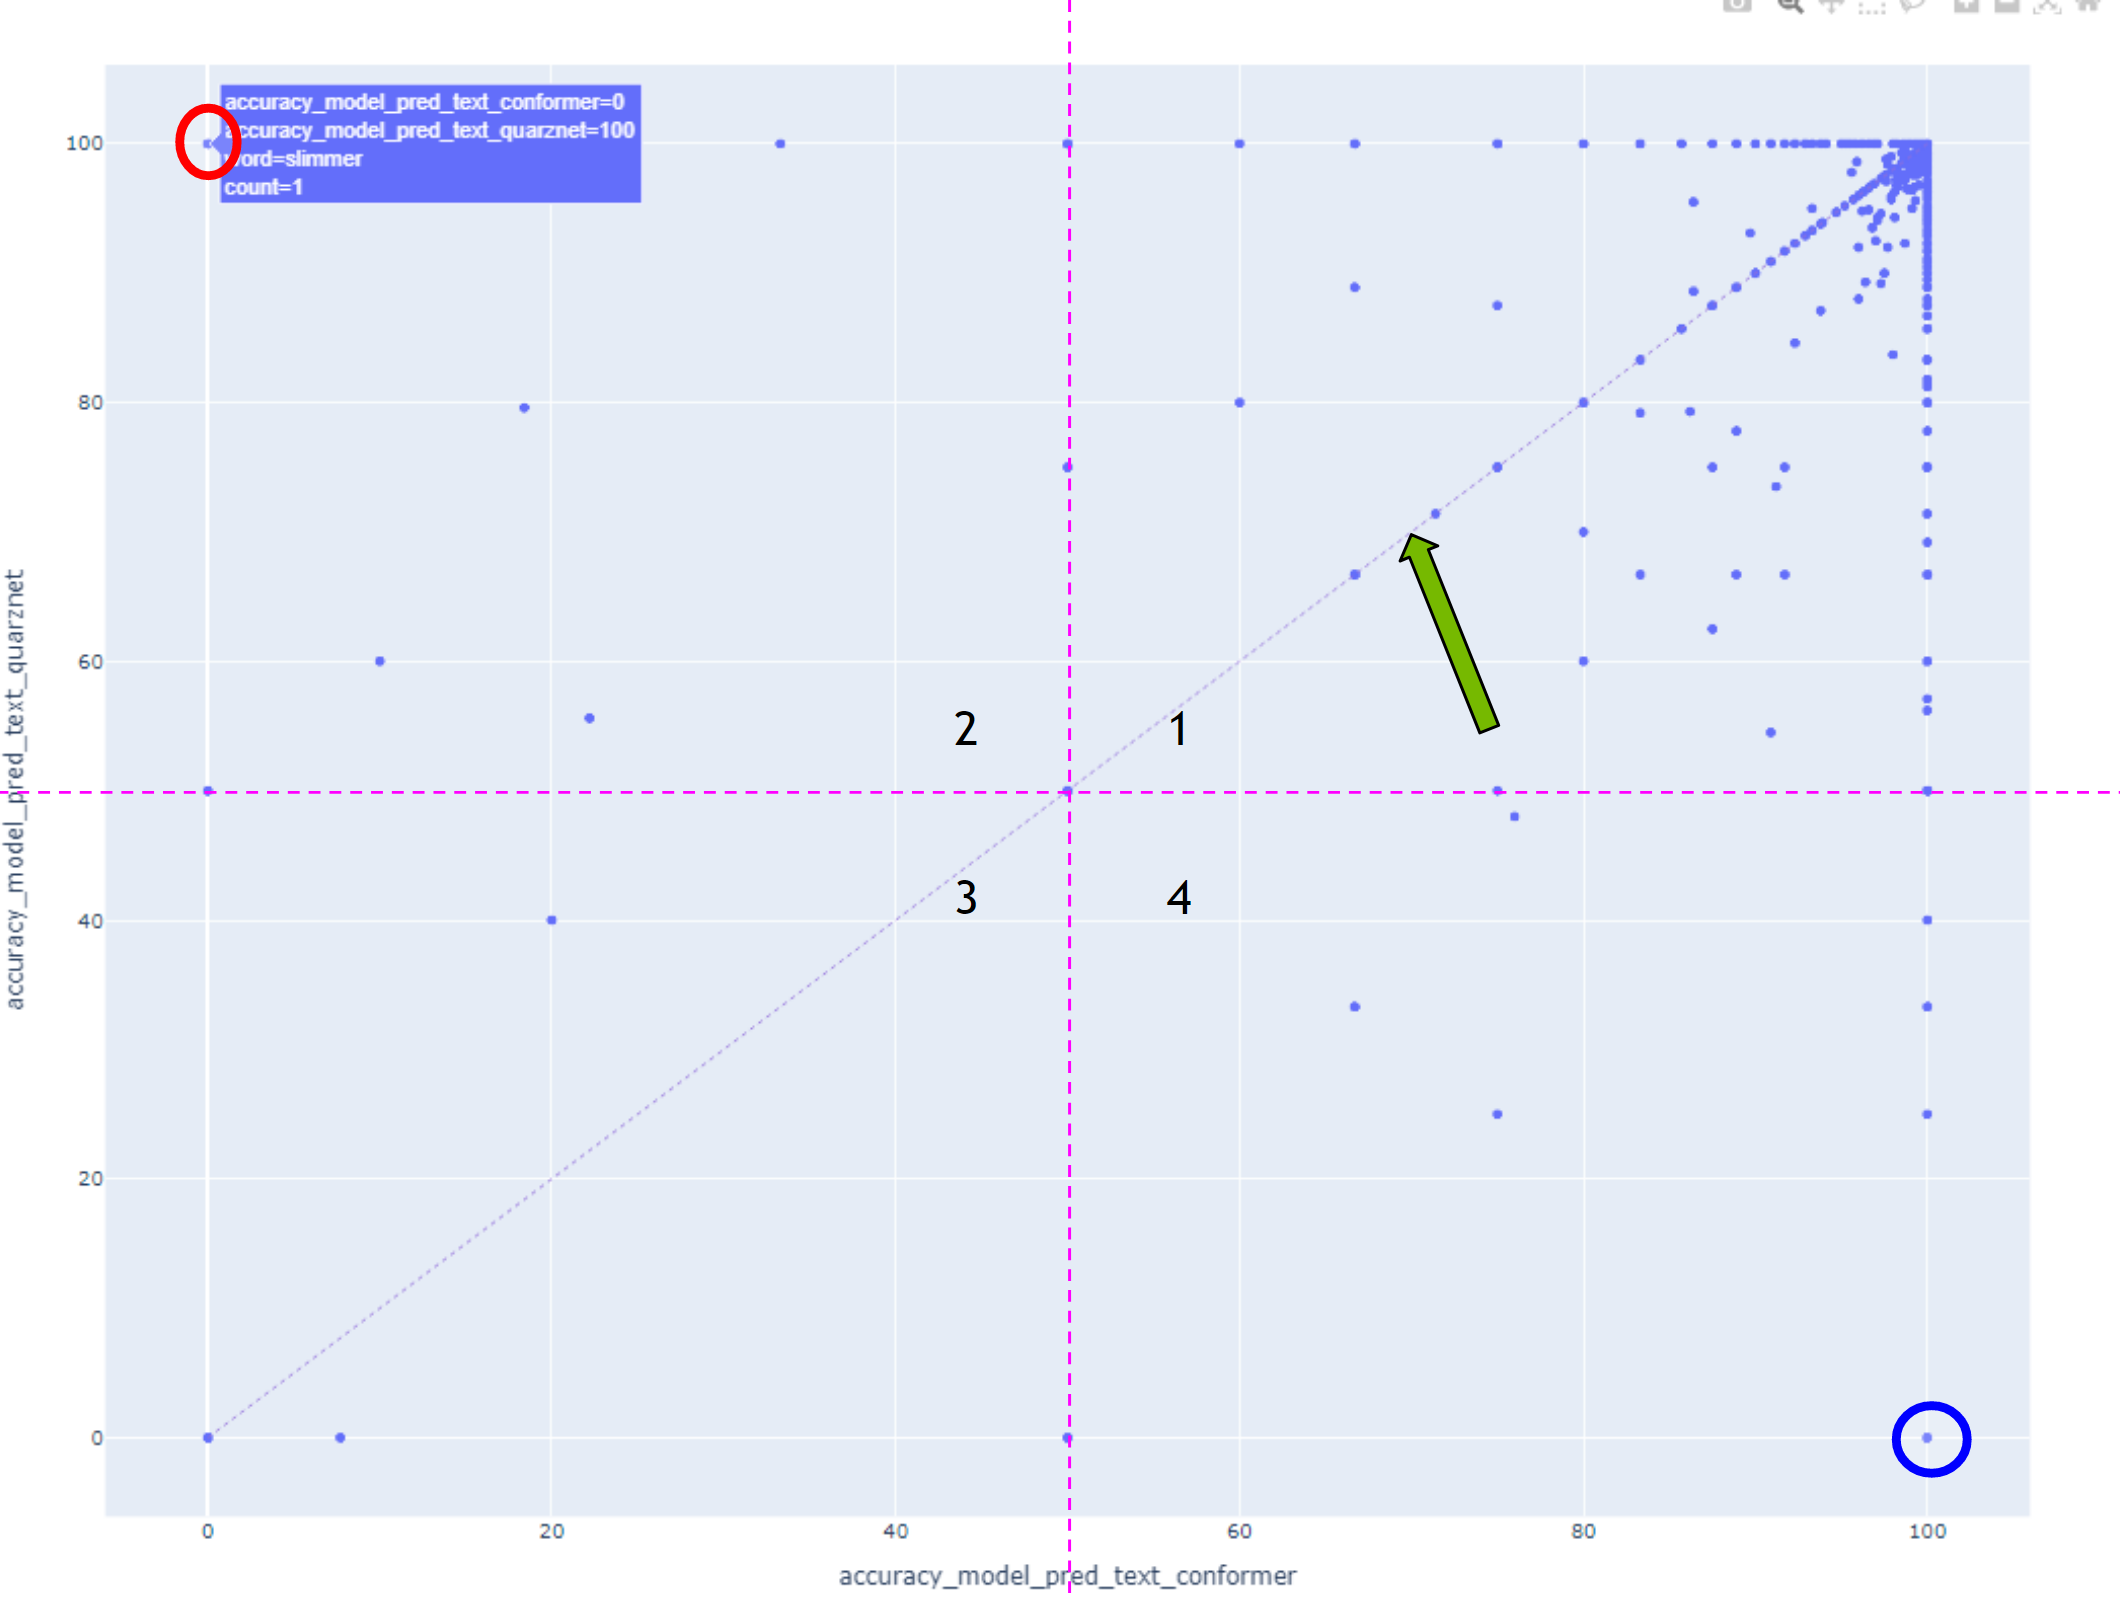
In this case, all points lying above the diagonal have higher accuracy with the model displayed on the vertical axis, and all points below the diagonal were recognized better with the model displayed on the horizontal axis.
Points marked with circles should be explored first.
Words in the first quarter were well recognized by both models, and conversely, words in the third quarter were poorly recognized by both models.
To compare models at utterance level, pick it at top dropdown field.
At the next field you could choose metric: WER or CER
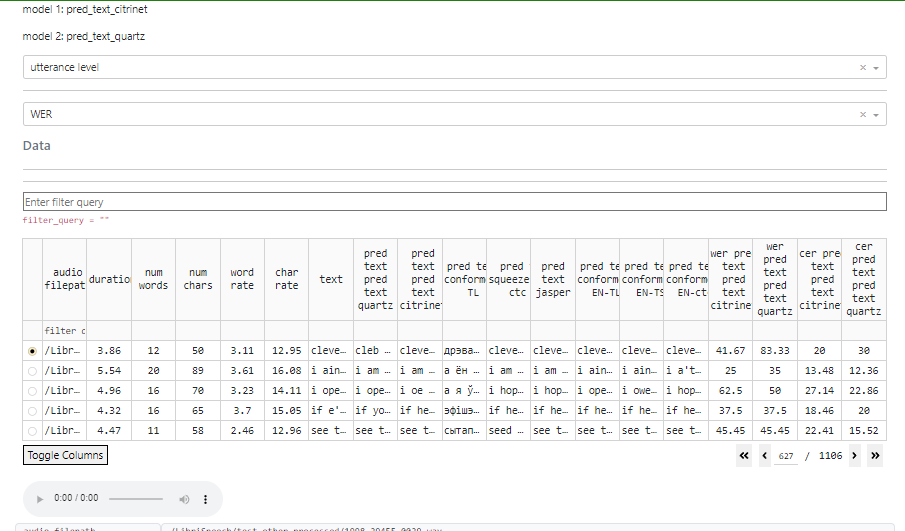
When an utterance level is selected, it is possible to click on a point on the graph, and the corresponding utterance will be automatically selected.
If audio files are available, there will be an option to listen to the audio recording and view its waveform.
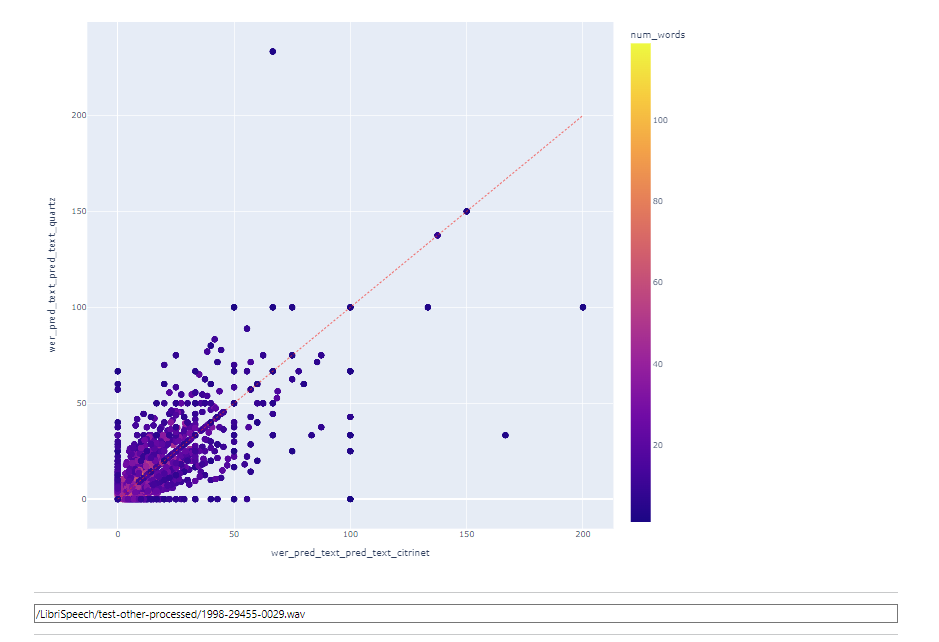
In this mode, filtering is still available as well.
Limitations
To ensure efficient processing and avoid issues with memory limitations and slow performance, it is recommended to keep the manifests within the limits of 320 hours or around 170,000 utterances. Exceeding these limits may result in both memory constraints and slower processing.