NEO GUI
NVIDIA® NEO® features several main GUI views. Before exploring the different options, it is recommended to perform the following steps:
The steps below can be performed by administrators only.
Click on the "Settings" tab:
Select the "Users" view to add new NEO users, and define users’ roles and credentials.
Select the "Email" view to add recipient lists. Upon user’s definition, these lists could be used to distribute specific event alerts to a group of recipients.
For further instructions, see "Settings".
Click on the "Events" tab to activate and deactivate events, and define the severity, condition-value, description and notification parameters for each event. For further instructions, see "Events".
Profile Icons

When clicking the small profile icon on the top left corner of the left-hand menu, a drop down menu will appear, providing the user with the following:
Username – can either be a regular user or an admin
The ability to change the account password
The following table describes the main NEO windows and categories:
Navigator Tabs
|
Tab Icon |
Function |
Description |

|
Dashboard |
Provides single view highlighting information and network status |

|
Managed Elements |
Provides a list of devices, inventory, ports, groups, virtual machines, and virtual switches |

|
Network Map |
Provides a visual view of the physical connectivity between managed devices |

|
Services |
Provides automation tools for complex networking configurations |

|
Configurations |
Available for administrators only. Provides the ability to create/edit configuration files and provisioning templates and manage network snapshots. |

|
Telemetry |
Presents several reports of information collected by the management system, and allows to save and load them |

|
Tasks |
Available for administrators only. Displays future scheduled Jobs. |

|
Jobs |
Available for administrators only. Displays all the running and completed jobs in the system. |

|
Events |
Provides notification events or critical device faults of the switch and server data events. The "Events Policy" view allows the user to activate and deactivate events, and define the severity, condition-value, description and notification parameters for each event. |

|
Notifications |
Displays all network notifications |

|
System Health |
Provides information on NEO building blocks |

|
Settings |
Available for administrators only. General system settings (default access credentials, user management). |
|
Tab Icon |
Function |
Description |

|
Dashboard |
Provides single view highlighting information and network status |

|
Managed Elements |
Provides a list of devices, inventory, ports, groups, virtual machines, and virtual switches |

|
Network Map |
Provides a visual view of the physical connectivity between managed devices |

|
Configurations |
Available for administrators only. Provides the ability to create/edit configuration files and provisioning templates and manage network snapshots. |

|
Telemetry |
Presents several reports of information collected by the management system, and allows to save and load them |

|
Tasks |
Available for administrators only. Displays future scheduled Jobs. |

|
Jobs |
Available for administrators only. Displays all the running and completed jobs in the system. |

|
Events |
Provides notification events or critical device faults of the switch and server data events. The "Events Policy" view allows the user to activate and deactivate events, and define the severity, condition-value, description and notification parameters for each event. |

|
Notifications |
Displays all network notifications |

|
System Health |
Provides information on NEO building blocks |

|
Settings |
Available for administrators only. General system settings (default access credentials, user management). |
Monitoring Window
The NEO dashboard enables an efficient network view from a single screen and serves as a starting point for event or metric exploration.
There are 4 dashboard views:
General dashboard
RoCE dashboard
What Just Happened dashboard
Network Health dashboard
General Dashboard
The fabric dashboard provides single view that is highlighting information and network status in the following smaller dashboard windows:
Events
Network Health
WJH Category Distribution
Services
Configuration Changes
Last 24 Hours Events
Network Health
Devices Heatmap
Fabric Utilization (pie chart which also appears in the daily report)
Top Alerted Devices
Recent Activity
For more information, please refer to page NEO Fabric Interface Dashboard.
What Just Happened®
The What Just Happened dashboard provides a view of the fabric packet drops information and statistical data of the drop reasons. The information is retrieved from the Telemetry Agent by a dedicated "What Just Happened" session.
RoCE Dashboard
The RoCE dashboard provides a single view that is highlighting information and network status related to RoCE traffic. The information is displayed in the following smaller dashboard windows:
Last 24 Hours RoCE Related Events
RoCE Services
Recent RoCE Related Activity
Network Health Dashboard
This dashboard provides a graphic display for each device in the system representing its status and the severity of events reported on it.
Managed Elements Windows
The Managed Elements panel provides a list of devices, inventory, ports, groups, virtual machines, virtual switches, cables and sites.
The Devices window displays a list of all devices on the machine, with the following related to each device: its IP address, name, system type, status, and MAC address.
A click on any device will display in a right panel a list of "Device Information" that includes: Stats, Ports, Inventory, OS, Events, Jobs, Credentials, Groups, Links, Config, Telemetry Snapshots, VLAN, LAG, Cables and Docker Containers.
A right click on a device or on multiple devices will allow performing any of the following actions, provided that the selected devices are capable of these actions: Provisioning, Connectivity Check, Install, Reboot, Remove, Acknowledge, Go To Map, History Monitoring, Live Monitoring, Create MLAG with, Add to Group, Add to Site and Generate Dump.
For more information on the Devices window, refer to "Devices"
The Inventory window provides detailed information about each device part (such as CPU and FAN) - its serial number (S/N), part number (P/N), model, vendor, state and health. For more information on the Inventory window, refer to "Inventory".
The Ports window provides information about all ports in the fabric – the device they are connected to, their name, protocol type, active speed, MTU, operational state and admin state. A click on one of the ports will display further information about that specific port: Counters, Errors, Cable, VLAN and LAG, when available. For more information on the Ports window, refer to "Ports".
The Cables window provides the following information about the cables connected to the switches: the ports to which the cable is connected, its serial number, cable type, part number, revision, length and speed.
The Groups window provides information about existing groups, their members and group credentials (if defined), and allows the user to create new groups. For more information on the Groups window, refer to "Groups".
The Sites window allows you to define physical locations of devices with information about the site's members. For more information on the Sites window, refer to "Sites".
The Virtual Machines window lists all the Virtual Machines (VMs) that run on all KVMs in the network. For more information on the Virtual Machines window, refer to "Virtual Machines".
The Virtual Switches window lists all the Virtual Switches that run on all KVMs in the network. For more information on the Virtual Switches window, refer to "Virtual Switches".
The Telemetry Snapshots window provides a view of the system telemetry snapshots:


Network Map Window
The Network Map window shows the fabric, its topology, elements and properties. NEO performs automatic fabric discovery and displays the fabric elements and the connectivity between the elements. In the Network Map window you can see how the fabric and its elements are organized (e.g. switches and servers).
For more information on the Network Map window, refer to "Network Map".
Configuration Management Window
This panel is visible to administrators only.
The Configuration Management panel allows creating and editing configuration files and provisioning templates, as well as managing network snapshots. This panel is composed of three tabs: Network Snapshots, Global Configuration and Provisioning Templates.
For more information on the Configuration Management window, refer to "Configuration Management".
Telemetry Window
The Telemetry panel is composed of three windows:
Monitoring – allows creating live and history monitoring sessions
Snapshots – allows creating monitoring snapshots
Streaming – allows to view the current telemetry sessions (predefined and customized sessions), their status, and their members (switches)
For more information on the Streaming window, refer to "Streaming".
Tasks Window
This panel is visible to administrators only.
The Tasks panel presents user’s defined tasks (future scheduled Jobs). The following tasks are supported:
Selecting a single or multiple devices and setting an action such as software upgrade or provisioning (CLI-command) and the action setting data
Selecting a specific action on a device/a group of devices and creating a task from this action and its setting data
Adding or deleting a task
Dynamically selecting devices using filters (wildcards) tasks
For more information on the Tasks window, refer to "Tasks".
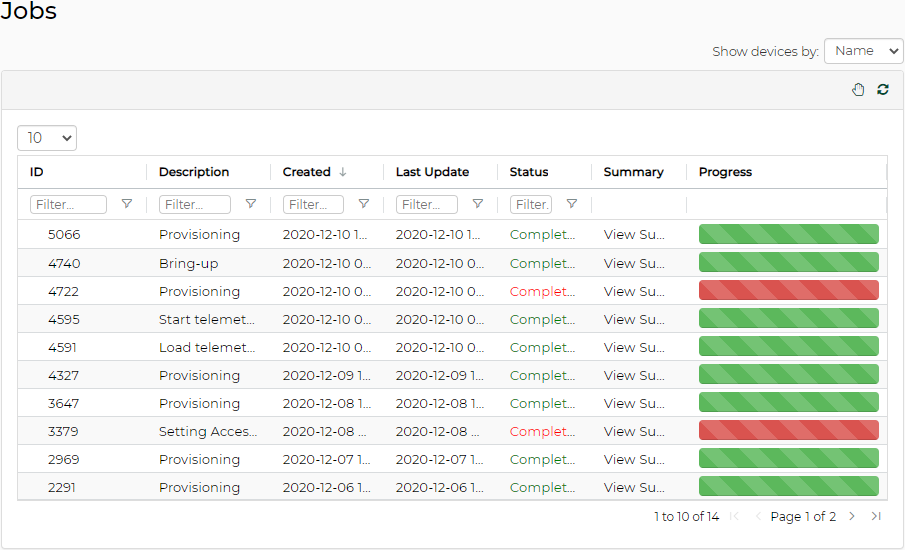
Jobs Window
This panel is visible to administrators only.
The Jobs panel displays all of NEO’s running Jobs. A Job is a running task defined by a user and applied on one or more of the devices (provisioning, software upgraded, switch reboot etc.)
NEO users can monitor the progress of a running job, as well as the time it was created, its last update description and its status. The status value can be "Running", during operation, "Pending", if another job is already running in the same device, "Completed with Errors" if an error has occurred, and "Completed". To cancel a pending job, right-click on the relevant job, and then choose "Abort".
Job States
|
Job State |
Description |
|
Created |
Job was created and will shortly start running. |
|
Pending |
Job is pending by NEO. This state appears in case another job that contains at least one common device is already running. |
|
Running |
The pending job was released and is now running. |
|
Completed |
All sub-jobs were completed successfully |
|
Completed with Errors |
All sub-jobs were completed, but on some of them, errors occurred. |
|
Aborted |
A pending job was canceled by the user. |
Jobs can also be tasks scheduled by the system. In such cases, the users can monitor the progress of these jobs but cannot control them.
For further information on the Jobs window, refer to "Jobs".
Events Window
NEO includes an advanced granular monitoring engine that provides real time access to switch and server data events. Network events can either be notification events or critical device faults. The events information includes severity, time.
For further information on the Events window, refer to "Events".
Notifications Window
The Notifications tab is NEO’s incoming messages box, providing the administrators network notifications.
For further information on the Notifications window, refer to "Notifications".
System Health Window
"High Availability" panel is visible to administrators only.
The System Health panel is composed of three windows:
Providers – the building blocks of NEO
High Availability – a mechanism meant to serve as a backup if the active node on which NEO is installed should fail
Logs – presents detailed logs and alarms that are filtered and sorted by category, providing visibility into traffic and device events as well as into NEO server activity history.
For further information on the System Health window, refer to "System Health".
Settings Window
This panel is visible to administrators only.
For further information on the Settings window, refer to "Settings". The Settings panel allows administrators to edit users’ profiles, define general system settings such as default access credentials, generate backups and restoration points and create and manage provisioning templates.