Telemetry
Telemetry may be used to monitor the success and faults of the network and its operations. The initial view lists the saved reports. Administrators can view all saved reports, while standard users can only view the reports they create. A right-click on a specific report opens a menu with the options to load the report or delete it from the list. Multiple reports can be selected and deleted at once.
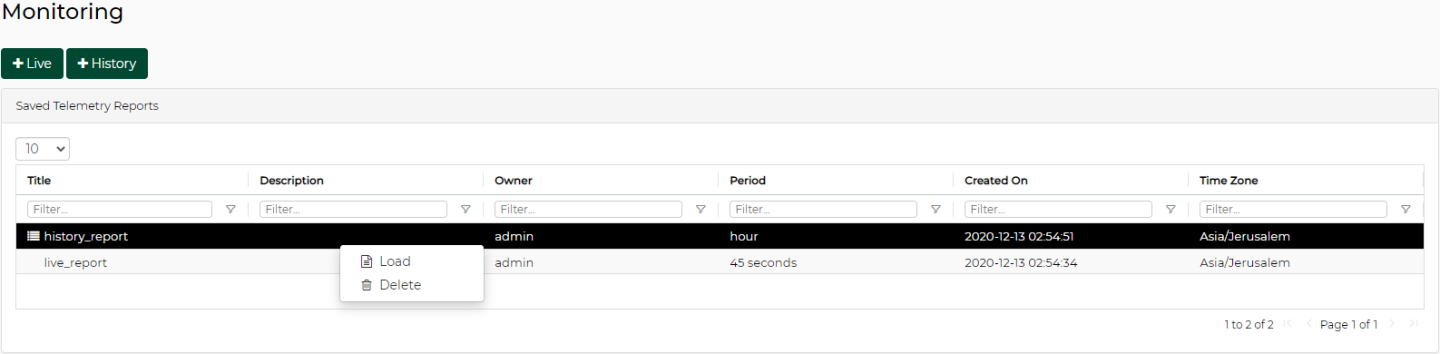
There are four types of reports that users can generate:
History Monitoring
Live Monitoring
Performance
Snapshot
The monitoring actions can be performed from multiple windows:
Managed Elements > Devices > Right-click on one or more devices
Managed Elements > Ports > Right-click on one or more ports
Managed Elements > Groups > Right-click on a group (available only for History Monitoring)
Telemetry streaming – refer to History Monitoring and Live Monitoring sections below.
History Monitoring
Provides a report of the device attributes values history.
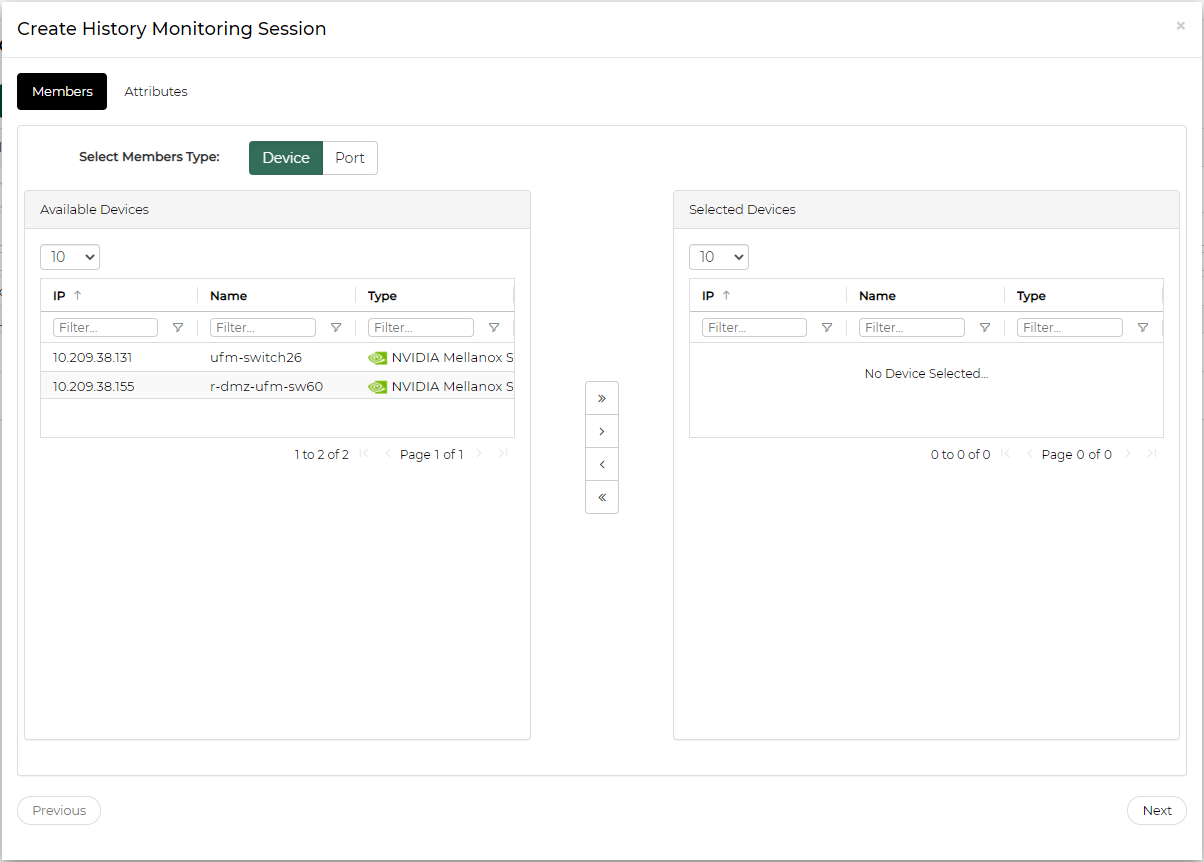
To create a history monitoring report:
Click the "+ History" button.
Choose the devices or ports you wish to generate a report for under "Members" (available objects: device, port).
Check the checkboxes of the attributes you wish to monitor their values (available attributes are listed in the table below), and define the time frame of the report (over the last hour, day, week or month).
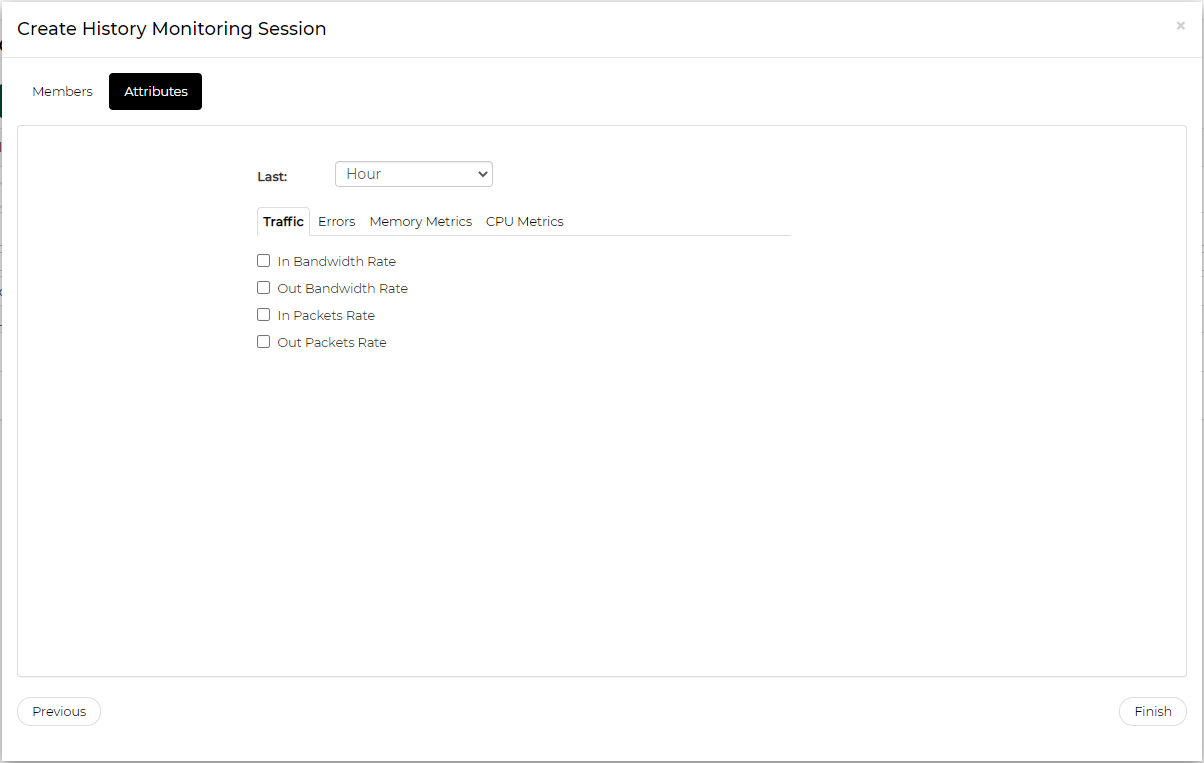
History Monitoring Available Attributes
Available Objects
Available Attributes
Devices
Counters
Errors
Memory Metrics
CPU Metrics
Ports
Counters
Errors
Once clicked "Finish", the report will be generated.
For saving the generated reports, see "Saving Reports".
Live Monitoring
Provides a live report of the device attributes values.
To create a live monitoring session:
Click the "+ Live" button.
Choose the devices or ports you wish to generate a report for under "Members" (available objects: device, port).

Check the checkboxes of the attributes you wish to monitor their values (available attributes are listed in the table below), and define the interval of the monitoring (the minimal monitoring interval can be as low as 2 seconds).
WarningThe minimal interval of 2 seconds applies to Spectrum and SwitchX switches, while for other devices, the minimal interval is 20 seconds for ports, and 5 seconds for devices.
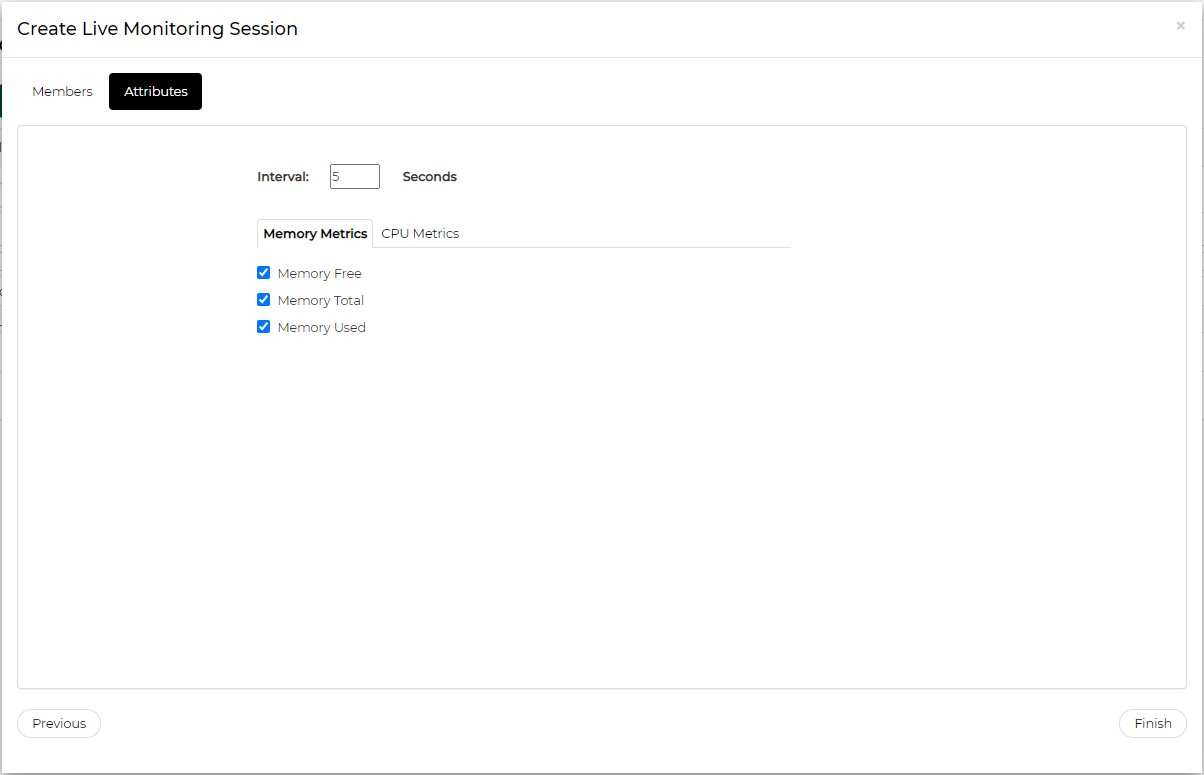
Live Monitoring Available Attributes
Available Objects
Available Attributes
Devices
Memory Metrics
CPU Metrics
Ports
Counters
Errors
Clicking Finish starts the monitoring session.
For saving the monitoring session, see "Saving Reports" section.
Live Monitoring is not supported for third party switches (non-NVIDIA switches), but is supported for the ports of those switches.
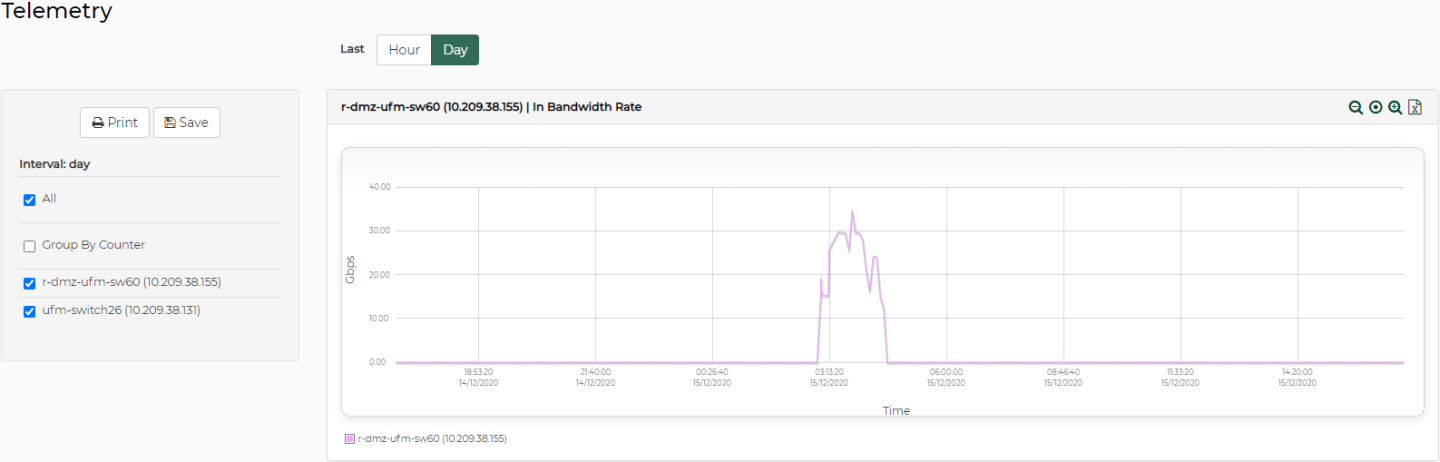
Saving Reports
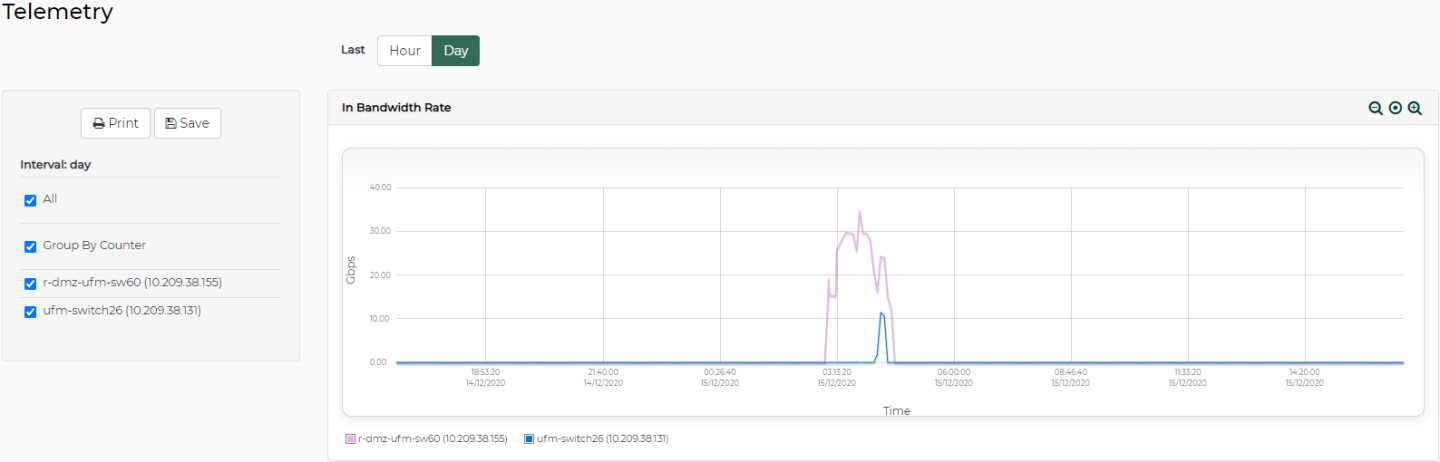
The generated reports can be saved or printed by clicking on the designated buttons.
A Report Title can be composed of 4-20 alphanumeric characters, as well as "_" (underscore) and "-" (dash). See Appendix – NEO GUI Fields Validations.
The Report Description field is optional, and can contain an unlimited number of characters.
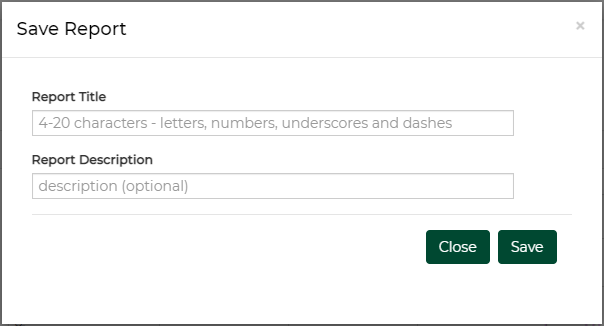
Users can save a report within 30 minutes from its creation time.
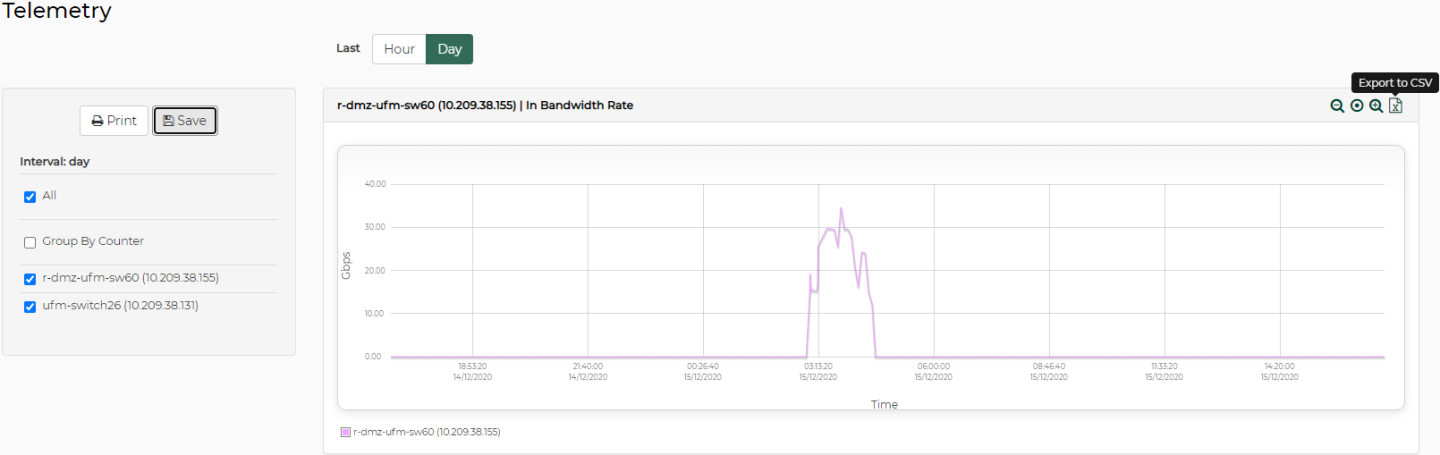
Once a report is generated, it can be exported to a CSV file.
If the report was generated for multiple devices – the CSV file can only be created if each graph contains a single device ("Group by Counter" checkbox on the left side of the graph is unchecked).
If the report was generated for a single device – the option of creating a CSV file will automatically become available.
Removing temporary reports is done by a garbage collector mechanism that is activated every 5 minutes.
By default, the maximum number of reports that can be saved is 200, while each user can save up to 20 reports (the administrator can keep saving reports even after reaching the 20 report limit, but once the system’s 200 report limit is met, no additional reports could be saved, unless reconfiguration is performed).
To configure the maximum number of reports to save:
Open the /opt/neo/controller/conf /controller.cfg file.
Find the Report section.
Set the maximum allowed number of saved reports in the system by changing the max_reports_per_system value (the default is 200).
Set the maximum allowed number of saved reports per user by changing the max_reports_per_user value (the default is 20).
Restart NVIDIA ® NEO ® -controller.
To configure the report’s garbage collector cycle interval:
Open the /opt/neo/controller/conf /controller.cfg file.
Find the Report section.
Set the garbage_collector_interval value to the desired number (the default is 5 minutes).
Restart NEO-controller.
Streaming is supported on Spectrum systems with either Onyx or Cumulus operating systems.
Predefined Sessions
For every Telemetry Agent controlled by Mellanox NEO, the sessions below are defined by default:
WJH
Interface Counters
Buffer Events
By default (when Telemetry Agent is started on the switch) only "Interface Counters" session is enabled (activated).
These sessions retrieve information for various NEO views. They cannot be edited or deleted, and devices will be automatically added to/removed from them according to their telemetry capability. Some of them can be enabled or disabled by need.
To perform an action on an added session, right-click on it, and select "Disable/Enable", "Modify Members" or "Delete".
The default streaming sessions are:
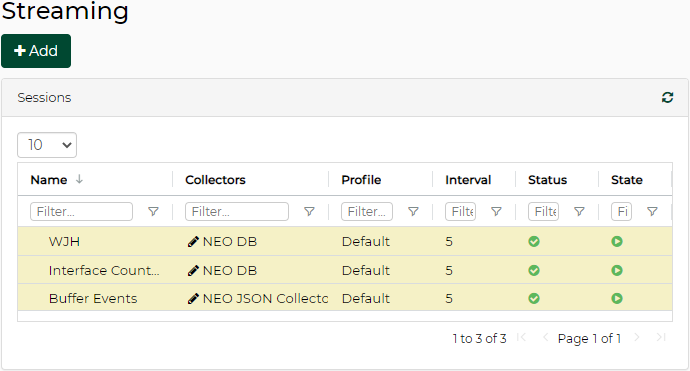
WJH – samples the dropped packets buffer, and streams the data to Mellanox NEO.
Interface Counters – samples interface counters. Please refer to the "Supported Telemetry Data Streaming" page of the Telemetry Agent User Manual for more information on the supported profiles and the available counters per profile.
Buffer Events – samples the buffer histogram and creates an event every time the defined threshold is crossed. To view the buffer histogram when an event is created, go to Network Map, and click on "Buffers Utilization" under Network Analysis. For more information, see "Network Analysis".
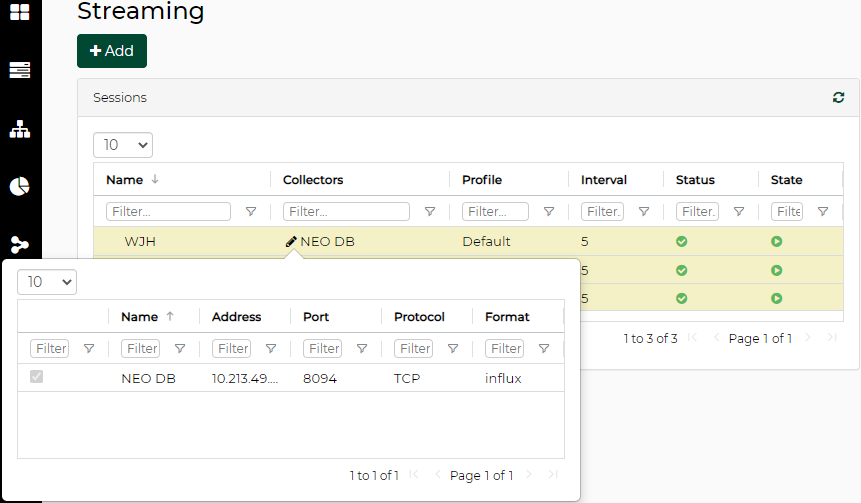
To perform a change of collectors to an existing session, go over the pencil mark under Collectors and mark the relevant collectors to add.
Sessions Management
View Session
In order to view all available sessions, go to "Telemetry" > "Streaming". A table will appear with a list of all sessions, including the predefined sessions marked in yellow.
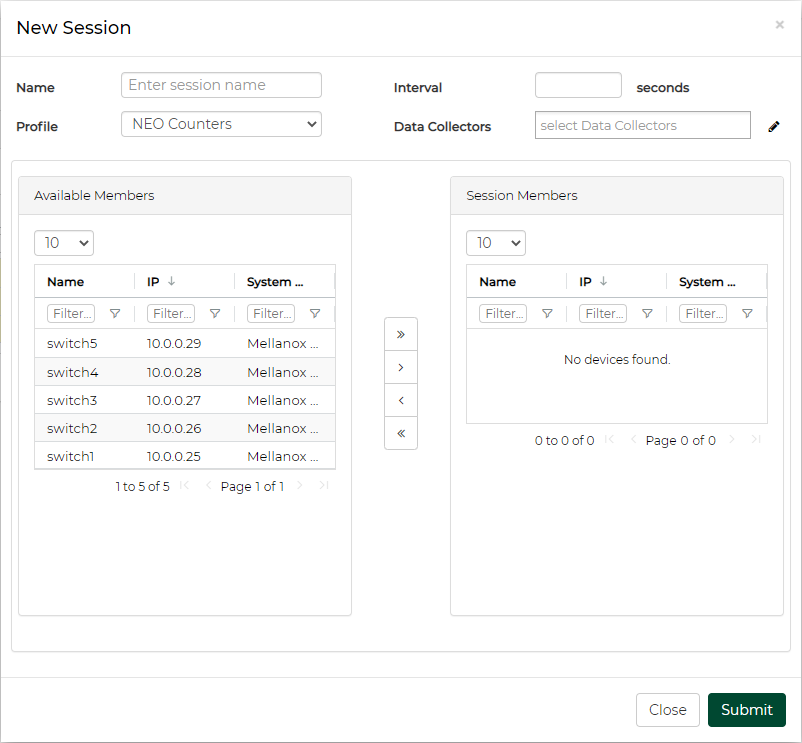
Create New Session
To add a new streaming session, click on the "Add" button, insert the new session’s name, and fill-in the required parameters:
Profile: Select one of the profiles -
NEO Counters
Traffic Counters
Priority Counters
FDB Table
Routing Table
Interval: The time interval for the data collection
Data Collectors: The collectors to which the data will be sent. For more information on defining the collectors, you can use the pencil icon, or refer to "Data Collector".
WarningIt is possible to define up to five sessions per system, and one per type.
WarningIt is impossible to create more than one session on the same profile for a specific device.
WarningUse the "Enable Histogram" template to configure default session "buffer events".
WarningBefore running the routing profile, make sure it is enabled on the switch (run "ip routing").
Telemetry Agent Supported Counters Per Profile
Please visit the Telemetry Agent User Manual under Appendixes>Supported Telemetry Data Streaming>Supported Counters Per Profile for more information.
Enable/Disable Session
To enable or disable a session, right-click on it, and select the desired action: Enable/Disable.
Running multiple sessions in high frequency may lead to high switch CPU conception.
Edit Sessions Members
To modify the session members, right click on a session, and select "Modify Members". The session member's view will open. You can use the arrows to add and remove members from a session. You can run only one session per profile and no more than 5 sessions (in total) per switch. Each session can be sent to several collectors.
You can run up to one session per profile, and each session can be sent to up to 3 different collectors (destinations).
Delete Session
To delete a session, right-click on it, and select "Delete". When deleting a session from the sessions table, the specified session will be stopped on all session members (switches) that are currently running it.
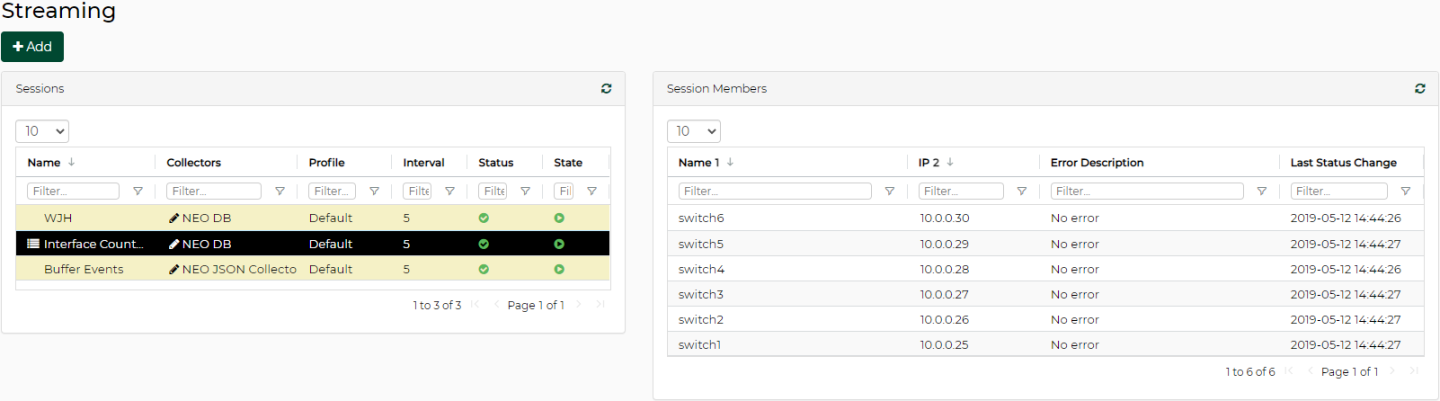
Session Members Status
To view the status of session members, click on the session, and a table with the following parameters will appear on the right side of the screen:
IP: System IP
Status: OK, Fail/Warning or Stop (green, yellow or gray icon, respectively)
Error Description: Will be displayed only in case there is a general telemetry error
Last Status Change: Specifies the exact time in which the last status change occurred.
Device Sessions Information
You may view the running sessions and the sessions status of each device, by selecting "Managed Elements" > "Devices", and clicking on the relevant device. The "Sessions" tab will appear in the "Device Information" panel on the right, as shown below. In case of a problem with the session, the problem type will be reflected in the session status.
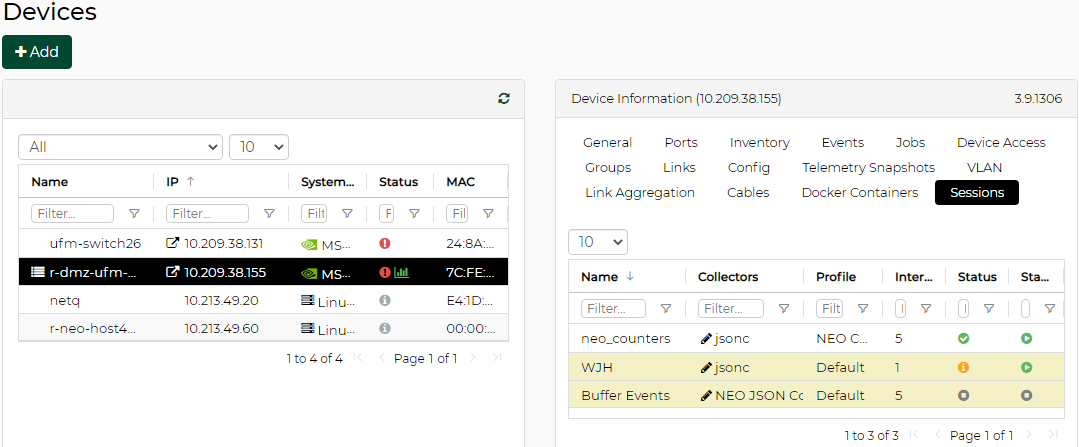
Running multiple sessions in high frequency may lead to high switch CPU conception.
What Just Happened Filtering
For WJH session, it is possible to get drops of specific categories only and silence alerts about other categories. Unselected categories will not be streamed, thus it is recommended to select all the wanted categories.

Recirculation Port
This section is relevant only for Spectrum based devices.
Spectrum-based switches require a recirculation port in order to receive WJH buffer drops.
In order to do that:
From the Devices view, right-click a Spectrum switch, and Install Telemetry Agent on it.
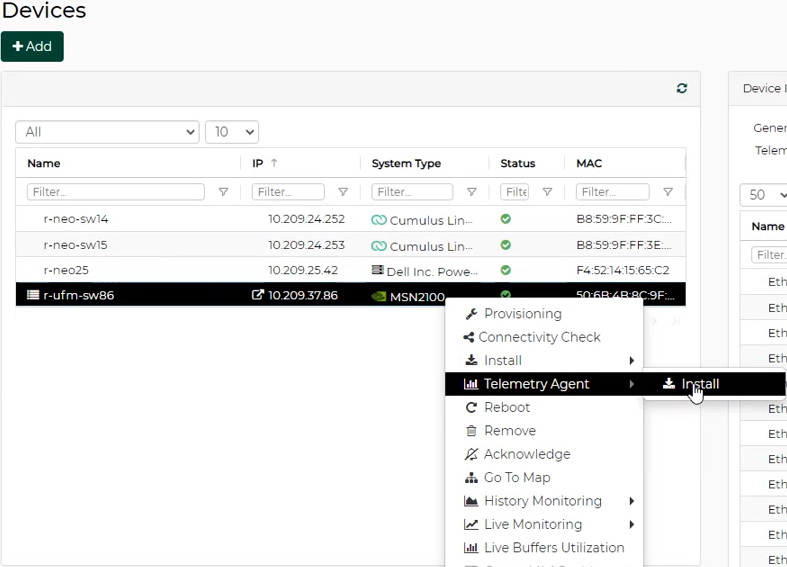
NEO, detects the Spectrum switch and prior to starting Telemetry Agent installation, prompts you to select an Ethernet port to use as a recirculation port from the drop-down menu. Click "Apply" when done.
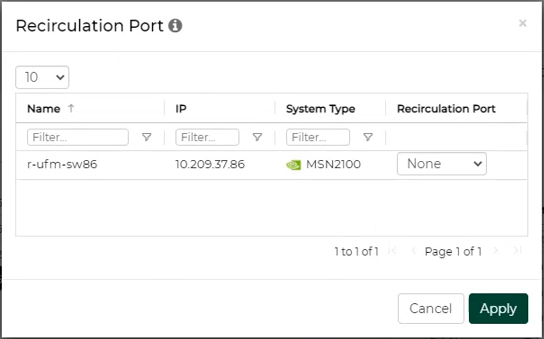
If port recirculation is already configured, you may use this window to modify the Ethernet port assignment or remove port recirculation configuration entirely (by selecting "None").
WarningThe Ethernet port assigned as a recirculation port will not be available to the user.
Telemetry snapshots allow the user to store snapshots of commands running periodically if the output was changed, and allow the user to search, view and compare these snapshots.
To create a telemetry snapshot:
Click the "+ Snapshot" button:
Select devices or group of devices.
Select a template or a command.
Select snapshot interval.
Click Finish.
Right clicking an existing snapshot allows the user to run it immediately, edit, or delete it.
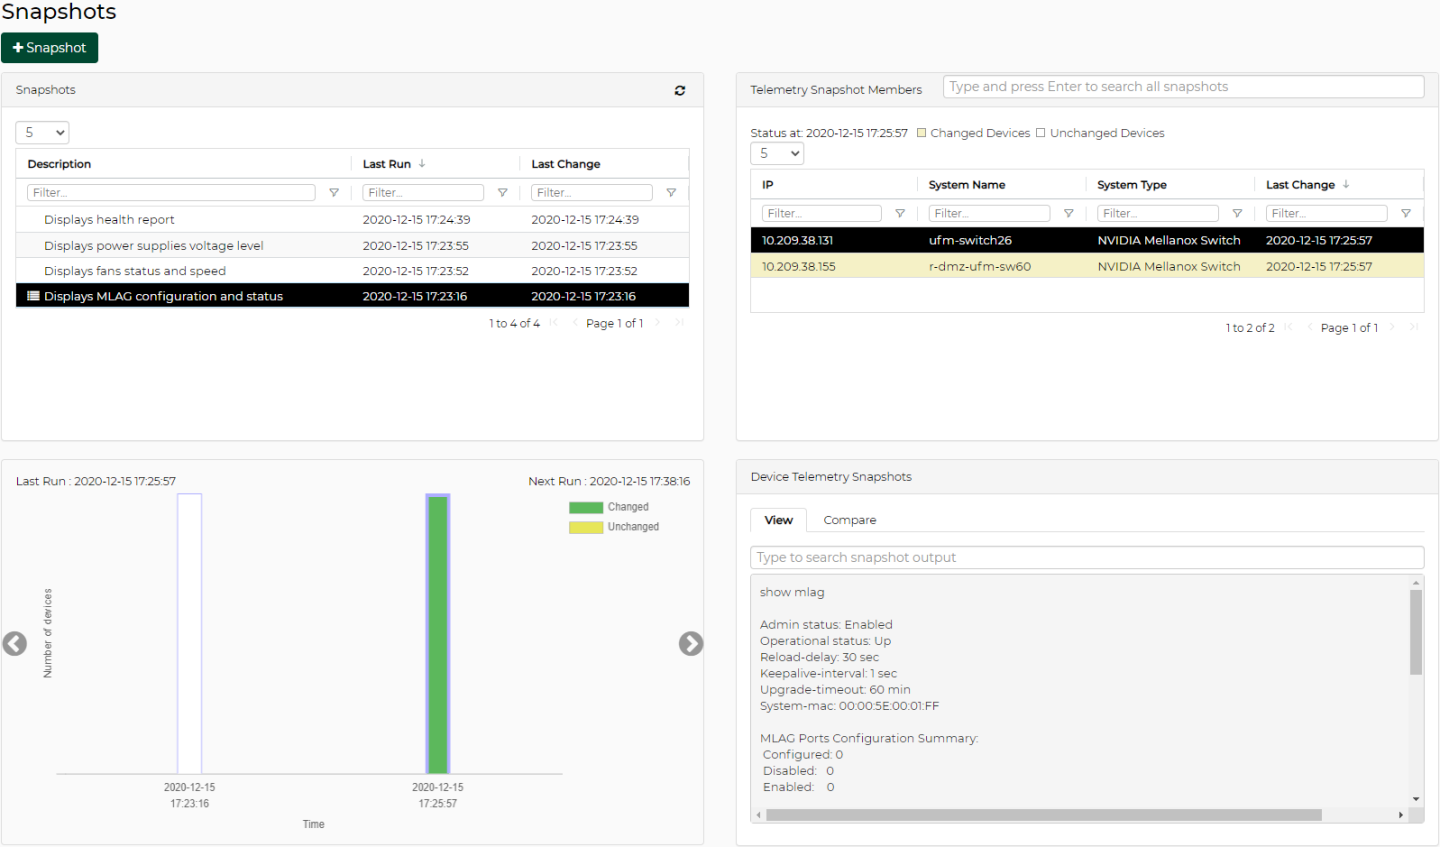
Snapshots Tab
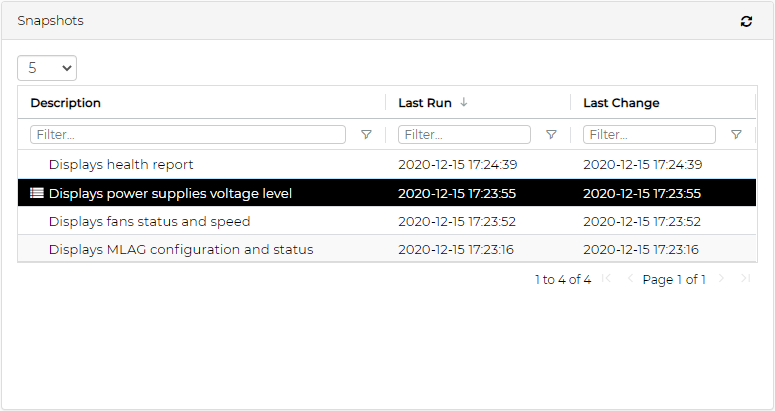
The Snapshots tab displays information about all the snapshots that were taken, and it is divided to four sections:
The snapshots section displays all the telemetry snapshots configured by the user.
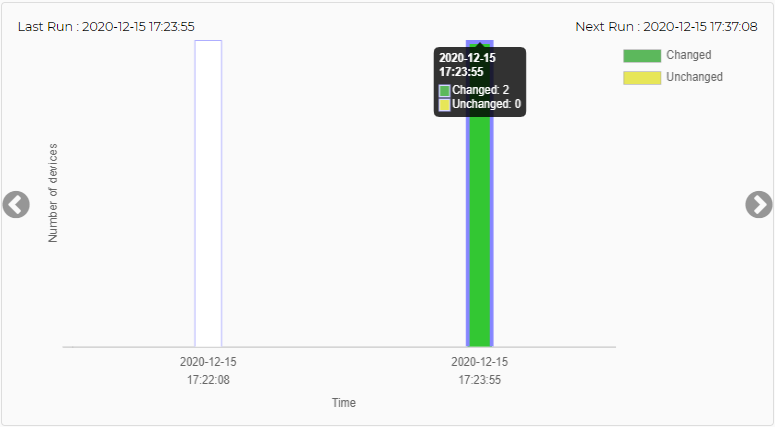
The selected snapshot timeline displays the times of latest changes detected.
 Warning
The maximum number of snapshots presented in this chart is 10.
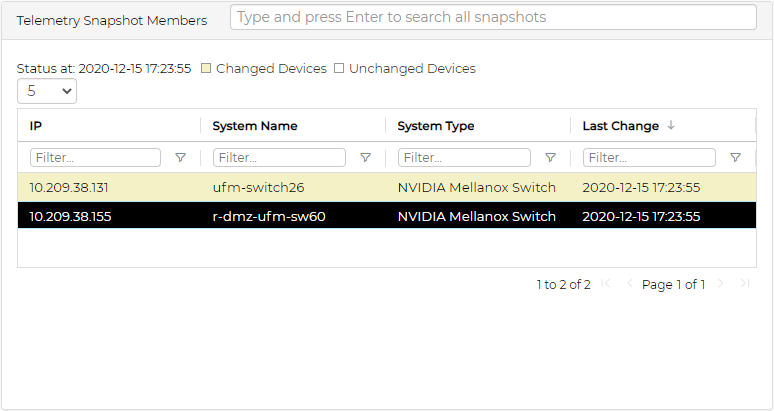
Telemetry Snapshots Members displays a list of the devices which are members in the selected telemetry snapshots.
Device Telemetry Snapshots displays the content of the selected device snapshot.
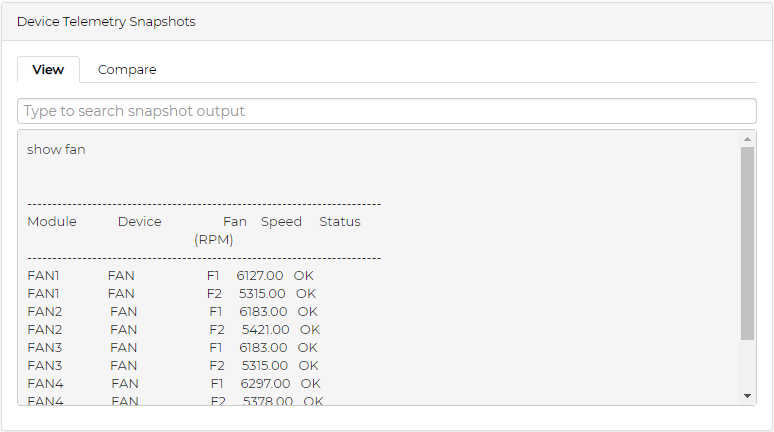
The Compare tab displays the differences between the selected snapshot and any other snapshots.
