Network Map
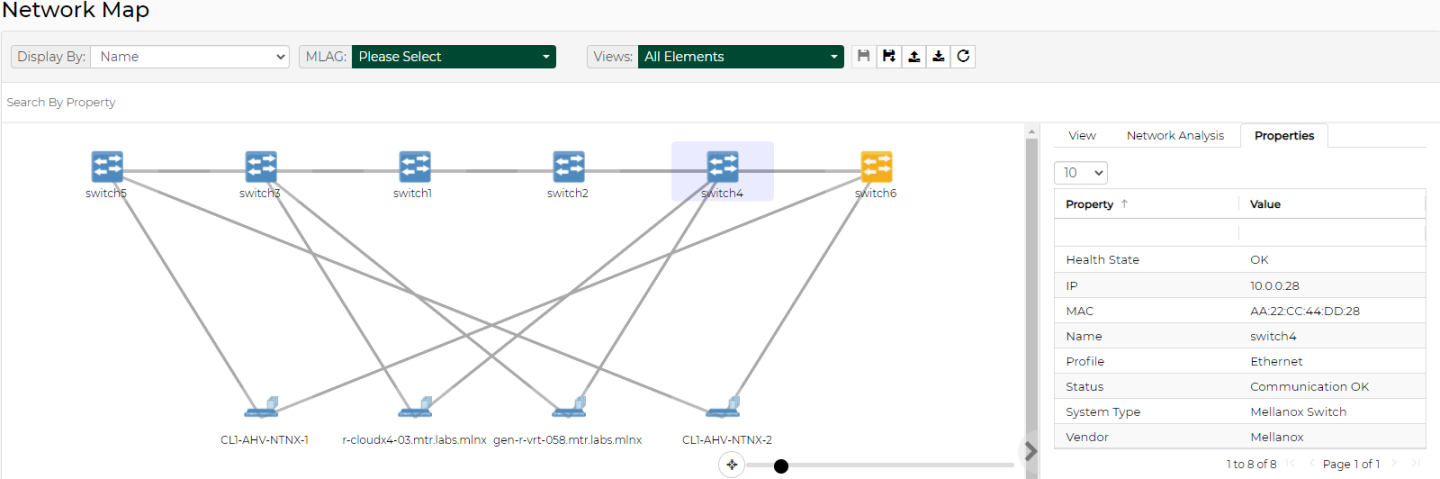
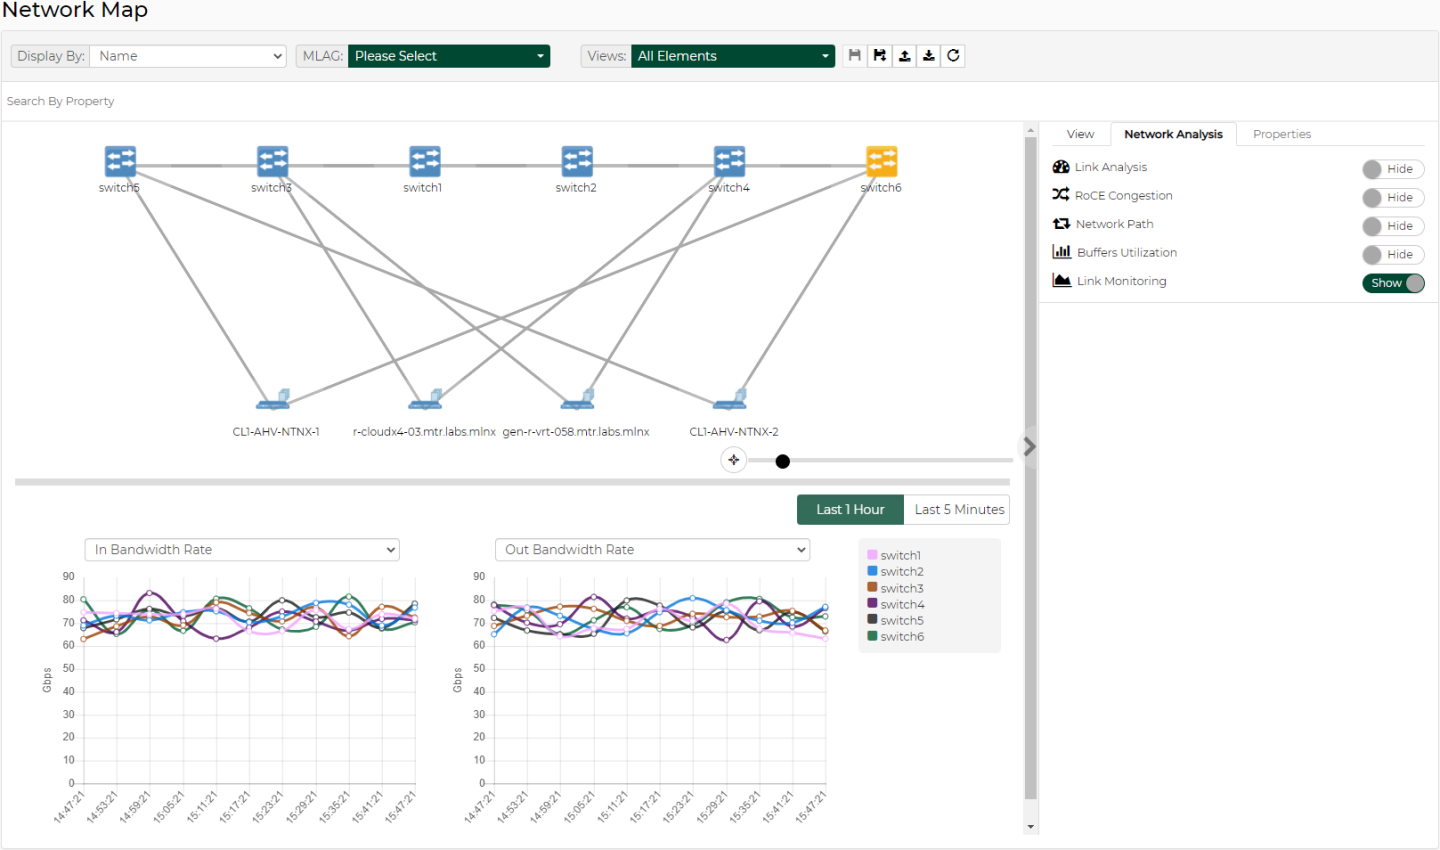
The Network Map screen shows the fabric, its topology, elements and properties. NVIDIA® NEO® performs automatic fabric discovery and displays the fabric elements and the connectivity between the elements. In the Network Map screen, you can see how the fabric and its elements are organized (e.g., switches and servers). In addition, it helps to utilize resources and traffic by performing telemetry and monitoring actions on the fabric in a colorful, user-friendly interface.
The network map and its inner components are automatically refreshed every 30 seconds.
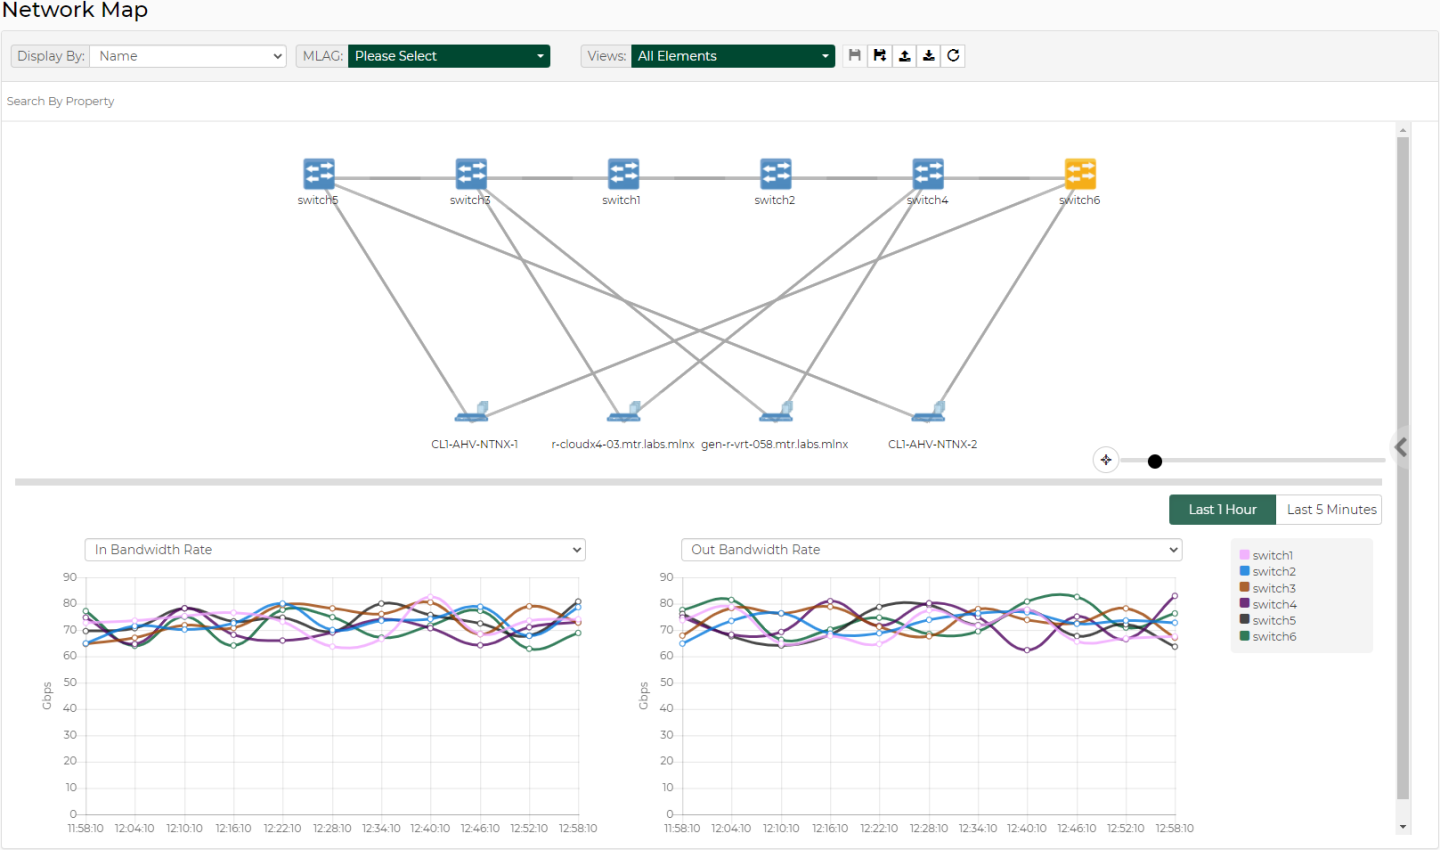

The zoom slider enables zooming in and out on the map, while the compass icon serves as a reset button.
"Search By Property" allows users to search for keywords using free text.
|
Component |
Description |
|
NVIDIA Onyx Switches* 
|
Represents Mellanox-OS switches discovered/ managed by NEO. |
|
Servers 
|
Represents the computer (host) connected to the discovered/managed switches. |
|
Links 
|
In the Network Map view, you may also see the connections (represented by a line) between each of the devices and between switches and servers. |
|
Network icon 
|
Represents a group of unknown discovered devices. |
|
Unknown connection 
|
Represents an unknown physical connection (while one of the peers is unknown). |
|
Component |
Description |
|
NVIDIA Onyx Switches*
|
Represents Mellanox-OS switches discovered/ managed by NEO |
|
Non-NVIDIA OS Switches* 
|
Represents third party switches discovered/ managed by NEO |
|
Servers
|
Represents the computer (host) connected to the discovered/managed switches |
|
Links
|
In the Network Map view, you may also see the connections (represented by a line) between each of the devices and between switches and servers |
|
Network icon
|
Represents a group of unknown discovered devices |
|
Unknown connection
|
Represents an unknown physical connection (while one of the peers is unknown) |
The color of the device varies according to its severity level. For further information, refer to Devices' Severity Levels.
A view is a combination of a topology of nodes with (x, y) positions, filters state and Network Analysis state. By default, NEO offers a view (called "All Elements") which provides a multi-layer topology, based on either Spine-Leaf topology or user-defined tiers.
It is possible to save custom views with their own topology. The following parameters can be customized, saved in a view, and accessed later, on another machine or browser:
Systems positions in the map
VLANs filter selection
Type filters state
Severity filters state
Network Analysis state
Saving Customized Views
To save a customized view, click the "Save As" button above (

).
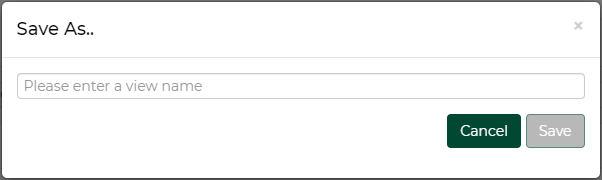
After clicking "Save", the view will be saved and can be accessed from the drop-down menu next to "Views". It can be deleted by clicking the "x" icon.

Note that the view can be edited by selecting it, modifying the filters, and saving it using the "Save" button (
). The refresh button (

) is used for reset.
Network map layouts can be exported and saved to text files by clicking on the Export icon (

). In addition, they can be exported from text files by clicking on the Import icon (

). This allows the sharing of a layouts between different users.
All Elements View
In the All Elements View display type, the devices are shown in layers (tiers), for better understanding of the network. To select the All Elements view, click on the "Views" drop-down menu, and select "All Elements".
Default All Elements View
This view follows the concept of Spine-Leaf topology, where the hosts are in the bottom line of a topology, the leaves are switches directly connected to those hosts, and the spines are switches connected to the leaves.

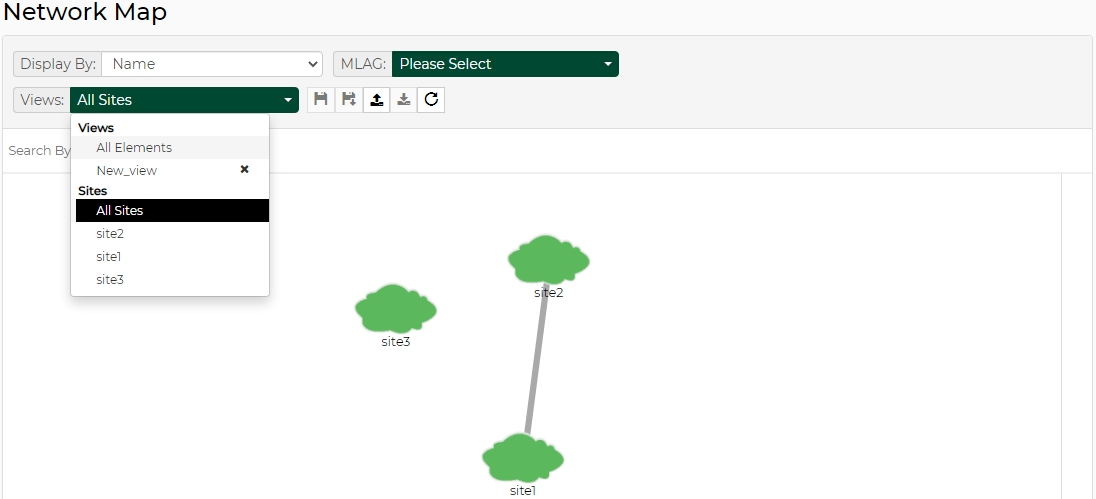
Sites View
Sites, once configured under Managed Elements, can be viewed from the Network Map screen.
The color for each site indicates the worst status for a device in that site.
At the top of the Network Map panel, there are several View options:
You can choose to display a device by its name or its IP address and search for it accordingly.

The device will be highlighted in the network map.
MLAG visualization drop down menu: will only appear if there is one/more instances of MLAG service in NEO. MLAG members of the instance selected will be highlighted in the Network Map.

Any change in the devices view using the filtering options can be saved using the "Save As" icon.

These new views can be saved and later accessed from the Views drop down menu.
The Network Map window includes physical hierarchies of the fabric. Hovering over one element in the map will highlight its connections and blur the other elements.
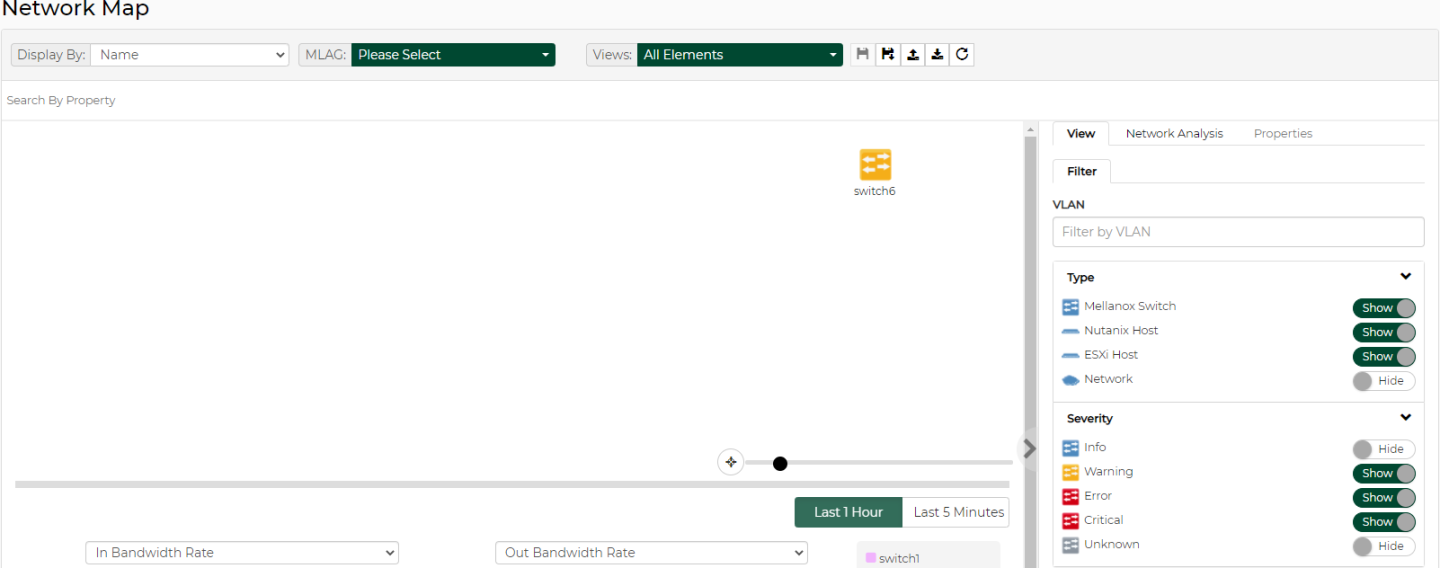
View Tab
The View tab in the right pane enables filtering for certain elements to be viewed in the Network Map, and allows performing monitoring and telemetry actions for network analysis (see below).

The views created are saved per user, thus cannot be accessed using a different username. Customized filters can be saved by clicking the "Save As" button above (
) the map view.
VLAN Filters
It is possible to filter for the devices allocated to one or more VLANs by selecting the VLAN number/numbers in the right pane:

Note that when filtering for members that belong to a certain VLAN, the option to hover over any device in the map will be disabled.
Type and Severity Filters
Under the Type section it is possible to filter the displayed systems in the map by toggling the buttons next to each system type. It is also possible to filter according to the severity of the system status (i.e. Info, Warning, Error, Critical, or Unknown).
Properties Tab
Device Info
When selecting a system in the network map, its name, vendor, profile, status, IP, system type, and health information will be displayed in a table under the properties tab.
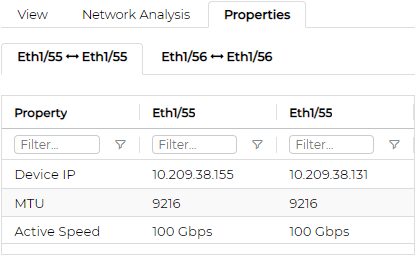
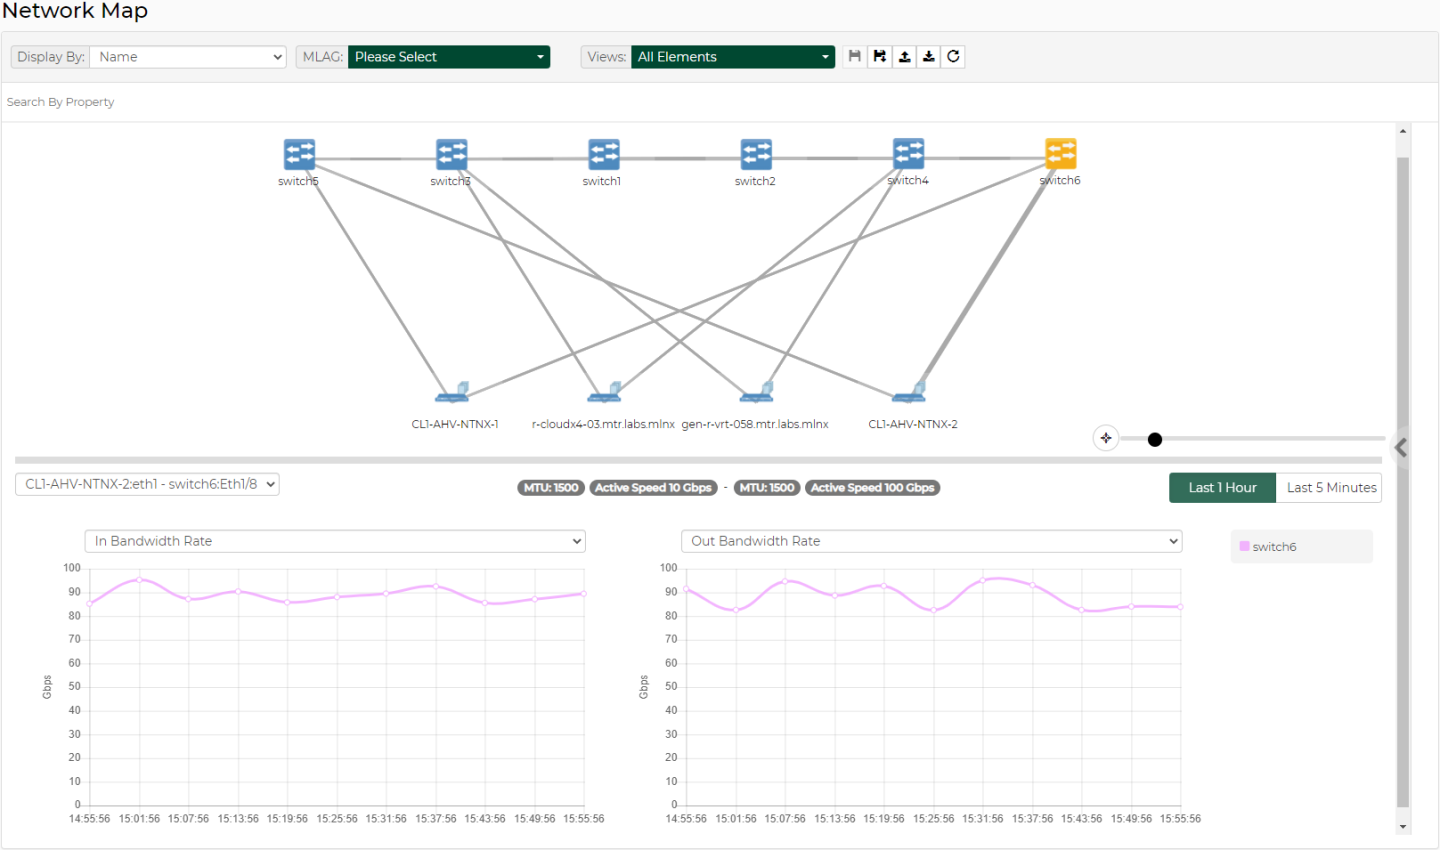
Links Info
When selecting a link on the map connecting two devices, the following information will be displayed:
A list of links between the two devices, recognized by the corresponding ports of each device.
A table of basic port information.
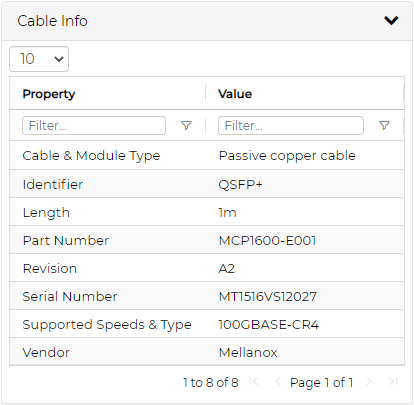
Port cable information is available when at least one of the devices connected in the link is an NVIDIA switch of communication status "OK". Cable info can be exposed by clicking "
". When this information is called for the first time, it will take a few minutes for the server to request and upload it.
Network Analysis
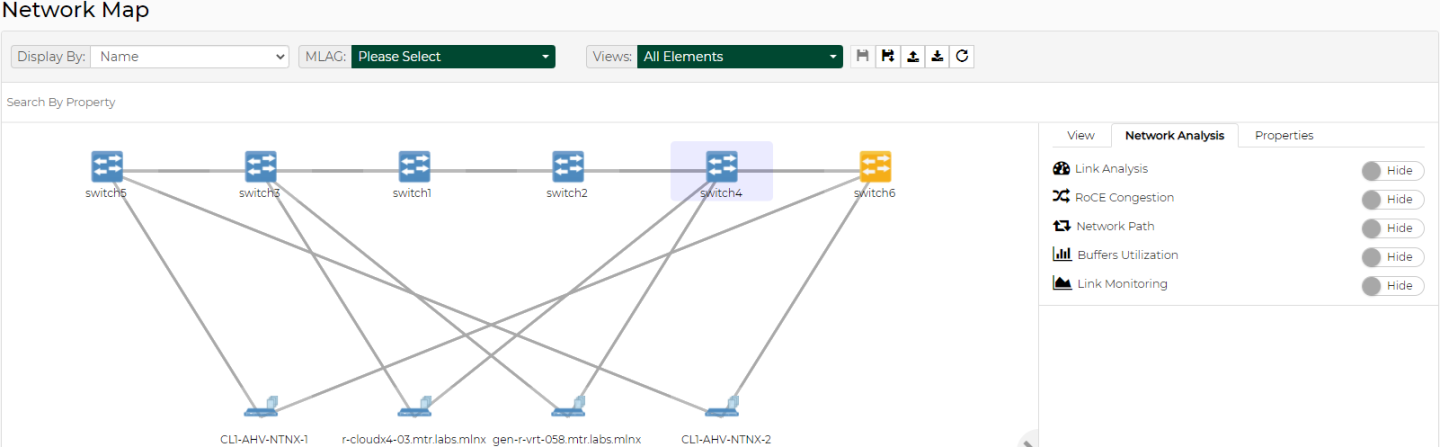
The Network Analysis pane provides several network monitoring and analysis options. One option may be enabled at a given time.
Link Analysis: Performs monitoring on the links based on specific counters and conditions.
RoCE Congestion: Performs monitoring on the links based on the ECN Normalized Packets counter.
Network Path: Finds a path composed of links between a switch & an In-Band IP and performs monitoring on these links based on Out Bandwidth Rate counter.
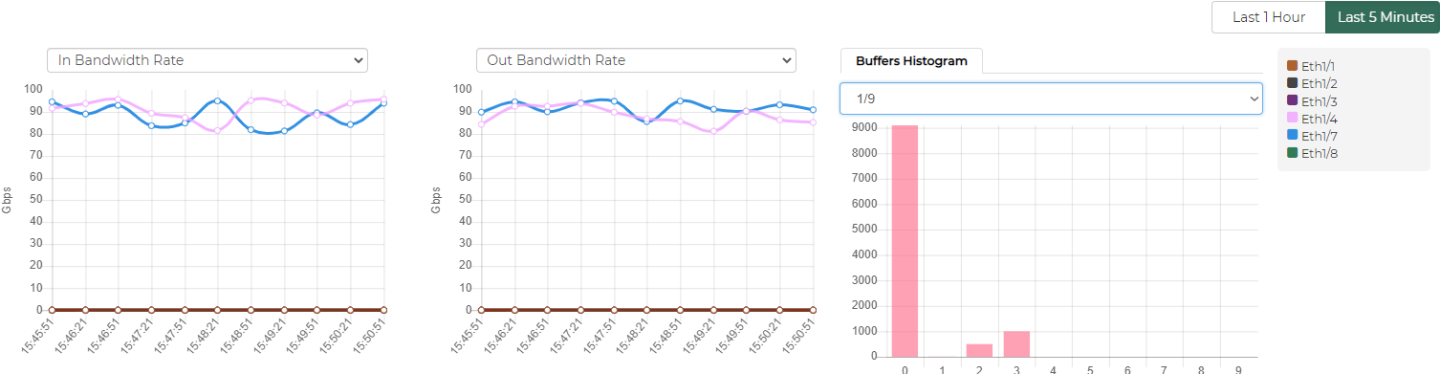
Buffers Utilization: Indicates the status of the buffers utilization for the switches, if a threshold event occurs. In addition, provides an option to view the switch buffers histograms in a bar chart.
WarningTo enable histograms, run the following template: NEO GUI → Managed Elements → SwitchXXX → Provisioning → Template → Enable histogram.
Link Monitoring: Retrieves telemetry data on switches and ports and presents it in line or bar charts.

Link Analysis
Link analysis allows you to display the link analytics according to a selected static counter, and define the conditions on which the analysis is based. The links will be colored according to the specified conditions. You may define up to five conditions.
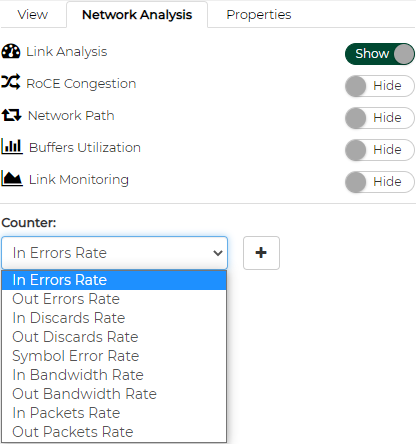
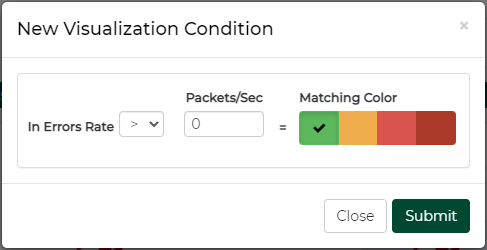
To define a condition, select the desired counter, and click on the [+] button.
A form will pop up. Select the appropriate operator, and define the desired threshold and color. This color will be applied on the link, if the link monitoring value matches the respective condition.
The added conditions are listed in the Network Analysis section, if Link Analysis is enabled. The links are colored and labeled accordingly.

Instead of aggregating all values, the displayed value represents the worst-case scenario:
If: (Condition) > X, the highest value will be shown
If: (Condition) < X, the lowest value will be shown
The data samples are retrieved using the Telemetry Agent, if it is installed on the switch. Otherwise, NEO uses the SNMP requests to retrieve the data. Sampling using the Telemetry Agent is done in higher resolution.
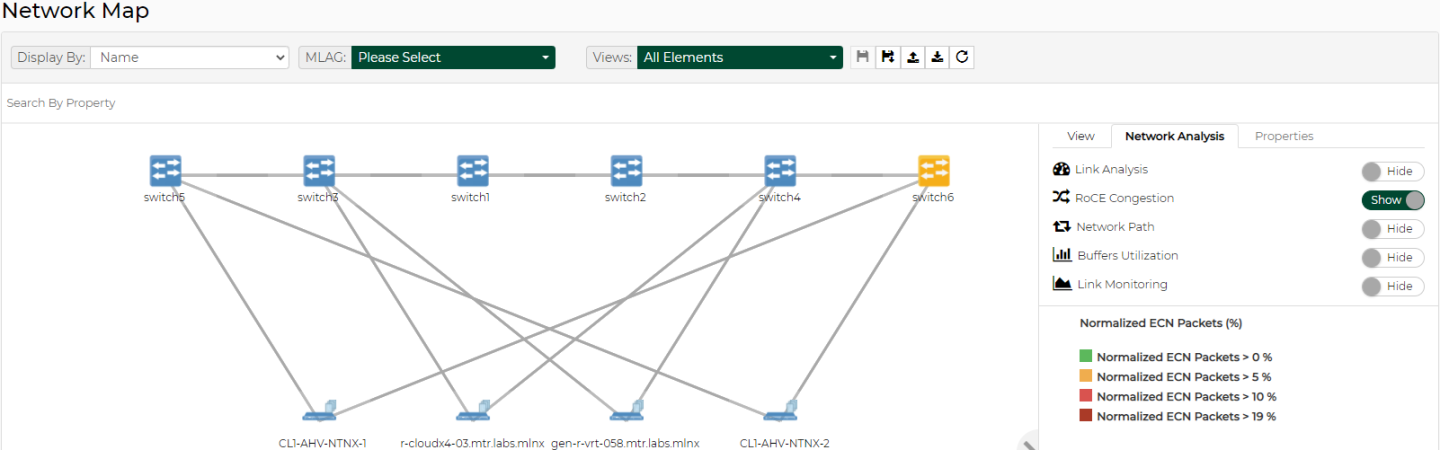
RoCE Congestion
The RoCE Congestion sub-pane provides monitoring based on ECN Normalized packets, given that there are 4 predefined conditions.
Network Path
The Network Path sub-pane allows you to display the paths between a selected source switch and a specific target host (In-Band IP). The display includes the Out-Bandwidth Rate values on top of these paths.
The Network Path capability is supported by both Onyx and Cumulus operating systems. For the OS versions, please refer to the latest Release Notes document.
The displayed out bandwidth rate value is the highest value of the interfaces. Thus, if two switch systems are connected by several links, only the highest value will be displayed. You may click on the link on the map for a table with all the values.
To do so, select the source switch from the drop-down menu, type the In-Band IP in the IP Field, and click the Trace button. The optional detected paths (can be more than one path) will be colored, and the Out-Bandwidth Rate value will be displayed on the map.

When entering a Loopback interface as the destination in NEO, one path is displayed.
Buffers Utilization
The Buffers Utilization feature samples and summarizes the capacity of admitted packets stored and queued in the buffer. This sub-pane allows a view on the switches' buffers utilization status, and provides an option to view the buffers histograms for each switch in a bar chart per interface.
The buffer icon beside each switch indicates the Buffer Utilization status. Each color corresponds to a specific status:
Grey: Unknown
Green: OK
Orange: Degraded
Red: Major or Critical
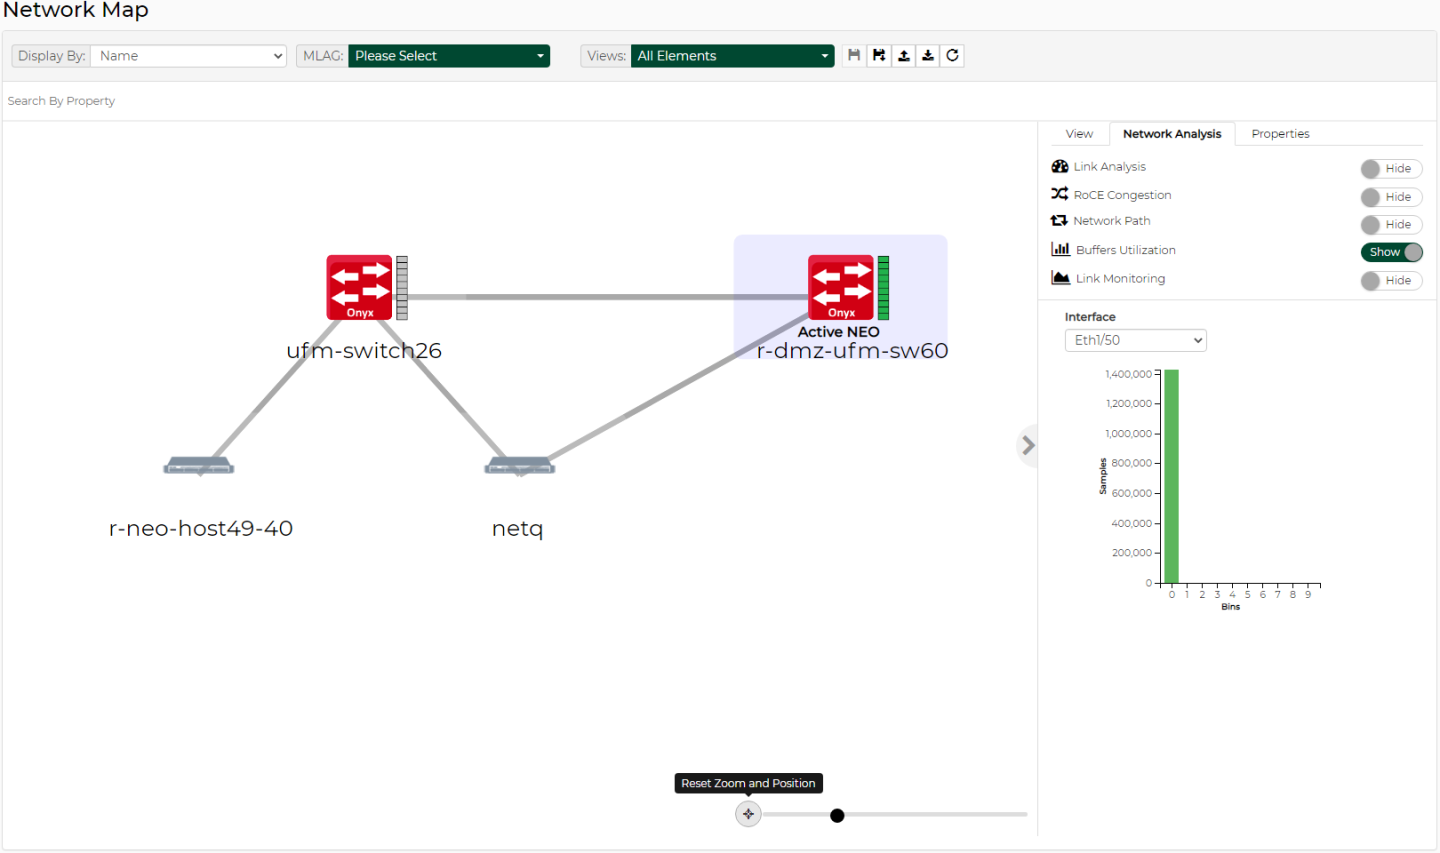
To view the histograms data for a switch if a threshold event occurs, select a switch in the map, and the interface for which you wish to see the histograms. The histograms are viewed in a bar chart. The X-axis represents the bin number, and the Y-axis represents the buffer size distribution.
For a live view of the current buffer utilization histogram, right-click on a device, and select "Live Buffers Utilization":

In order to configure Live Buffer Utilization follow this procedure:
Right-click the desired switch under Managed Elements → Devices and install/run telemetry on it.
Right-click the switch under Devices and click on Provisioning and choose the"Enable Histogram" template.
WarningBy default, the priority configured with NEO is 3 (i.e. TC=3 on the switch side). The priority can be changed under controller.cfg if desired.

Fill out the following global variables for this template.

Click on Live Buffer Utilization to show histogram samples based on switch histogram configuration.

Link Monitoring
Link Monitoring displays telemetry data in the form of line charts and bar charts. There are 3 cases of monitoring:
No selection: All the switches that support monitoring are monitored.
A switch is selected: The ports of the selected switch are monitored.
A link is selected: The ports of the two devices making that link are monitored.
Monitoring All Switches
If nothing is selected, we perform telemetry of all the supported switches.
Switch Monitoring
When a switch is selected, all its running ports are monitored.
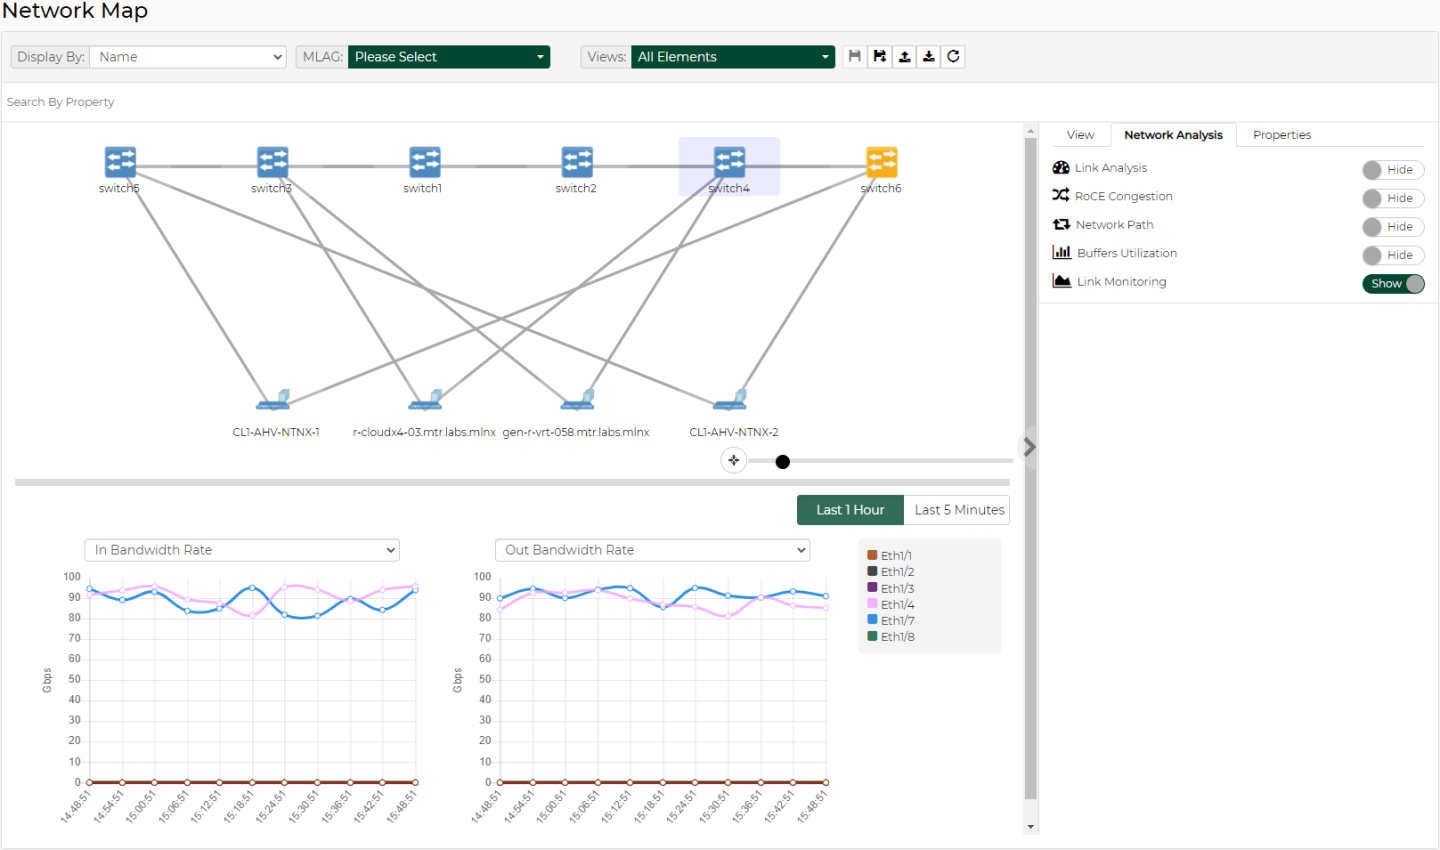
If you select the Last 5 Minutes mode, telemetry is streamed from the Telemetry Agent, and more counters are available.
Link Monitoring
If a link selected, the ports of the two devices taking part in this link are monitored.
To run operations on more than one element in the map, hold the ctrl key down and select the elements, right-click on one of them and choose the action.

The level of severity of the devices’ health state varies from OK to Critical, and is indicated by the device’s icon color.
Devices' Severity Levels
|
Icon |
Heath State |

|
Info/OK |

|
Error/Major |

|
Warning/Unknown/Degraded |

|
Critical |